MJO812 Posted December 3, 2019 Share Posted December 3, 2019 21 minutes ago, uncle W said: some analogs have a warm up the second week of December...then it gets colder the last 10 days or so with some snow...if we get into the 50's before mid month it would be a normal occurrence... Looks like a brief warmup on all the models Link to comment Share on other sites More sharing options...
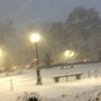
LibertyBell Posted December 3, 2019 Share Posted December 3, 2019 33 minutes ago, bluewave said: Report post Posted October 29 https://www.pnas.org/content/early/2019/10/15/1911130116 PNAS first published October 21, 2019 Significance How the magnitude of El Niño will change is of great societal concern, yet it remains largely unknown. Here we show analysis of how changing El Niño properties, due to 20th century climate change, can shed light on changes to the intensity of El Niño in the future. Since the 1970s, El Niño has changed its origination from the eastern Pacific to the western Pacific, along with increased strong El Niño events due to a background warming in the western Pacific warm pool. This suggests the controlling factors that may lead to increased extreme El Niño events in the future. If the observed background changes continue under future anthropogenic forcing, more frequent extreme El Niño events will induce profound socioeconomic consequences. Abstract El Niño’s intensity change under anthropogenic warming is of great importance to society, yet current climate models’ projections remain largely uncertain. The current classification of El Niño does not distinguish the strong from the moderate El Niño events, making it difficult to project future change of El Niño’s intensity. Here we classify 33 El Niño events from 1901 to 2017 by cluster analysis of the onset and amplification processes, and the resultant 4 types of El Niño distinguish the strong from the moderate events and the onset from successive events. The 3 categories of El Niño onset exhibit distinct development mechanisms. We find El Niño onset regime has changed from eastern Pacific origin to western Pacific origin with more frequent occurrence of extreme events since the 1970s. This regime change is hypothesized to arise from a background warming in the western Pacific and the associated increased zonal and vertical sea-surface temperature (SST) gradients in the equatorial central Pacific, which reveals a controlling factor that could lead to increased extreme El Niño events in the future. The Coupled Model Intercomparison Project phase 5 (CMIP5) models’ projections demonstrate that both the frequency and intensity of the strong El Niño events will increase significantly if the projected central Pacific zonal SST gradients become enhanced. If the currently observed background changes continue under future anthropogenic forcing, more frequent strong El Niño events are anticipated. The models’ uncertainty in the projected equatorial zonal SST gradients, however, remains a major roadblock for faithful prediction of El Niño’s future changes. https://agupubs.onlinelibrary.wiley.com/doi/abs/10.1029/2019GL083906?af=R First published: 25 October 2019 Abstract The El Niño‐Southern Oscillation (ENSO) represents the largest source of year‐to‐year global climate variability. While earth system models suggest a range of possible shifts in ENSO properties under continued greenhouse gas forcing, many centuries of preindustrial climate data are required to detect a potential shift in the properties of recent ENSO extremes. Here, we reconstruct the strength of ENSO variations over the last 7,000 years with a new ensemble of fossil coral oxygen isotope records from the Line Islands, located in the central equatorial Pacific. The corals document a significant decrease in ENSO variance of ~20% from 3,000 to 5,000 years ago, coinciding with changes in spring/fall precessional insolation. We find that ENSO variability over the last five decades is ~25% stronger than during the preindustrial. Our results provide empirical support for recent climate model projections showing an intensification of ENSO extremes under greenhouse forcing. Plain Language Summary Recent modeling studies suggest El Niño will intensify due to greenhouse warming. Here, new coral reconstructions of the El Niño‐Southern Oscillation (ENSO) record sustained, significant changes in ENSO variability over the last 7,000yrs, and imply that ENSO extremes of the last 50 years are significantly stronger than those of the pre‐industrial era in the central tropical Pacific. These records suggest that El Niño events already may be intensifying due to anthropogenic climate change. Key Points Line Island corals provide 1,751 years of monthly‐resolved ENSO variability from the mid‐Holocene to present ENSO strength is significantly weaker between 3,000 and 5,000 years ago compared to the 2,000‐year periods both before and after ENSO extremes of the last 50 years are significantly stronger than those of the pre‐industrial era in the central tropical Pacific Thanks Chris, I wonder if there is a supercycle that influences the long term fluctuation of ENSO? Also, on a different topic, do you have any nice pictures to share of the snow from Central Park? This was a very photogenic storm and last year and the year before you posted some nice images from the Park from a twitter feed, but I dont remember the site anymore Link to comment Share on other sites More sharing options...
LibertyBell Posted December 3, 2019 Share Posted December 3, 2019 3 minutes ago, bluewave said: These photos? Yes thanks thats the one! Seems like there are no photos from last night's storm from Central Park though Link to comment Share on other sites More sharing options...
MJO812 Posted December 3, 2019 Share Posted December 3, 2019 Eric Webb thinks his long range warmth call will fail. I'll definitely be the first to admit, the idea of a break in the pattern over the CONUS ~ Dec 10-25 that several people & including myself had on here is going to bust horribly. Details regarding the cyclonic wave break in the Gulf of Alaska make all the difference in the world. A more equatorward & negatively tilted CWB leads to a huge ridge in NW North America and dislodges a piece of the TPV sitting north of the Baffin Bay >>> major arctic outbreak ~ Dec 10-11. Given the active storm track we'll have around & following this period, it's hard not to be at least a little excited about renewed opportunities for wintry weather. Patterns like this can even get my neck of the woods in the action. This was a huge LR bust by myself but I honestly couldn't be happier about it. I'm beyond sick & tired of mild Decembers around here. Link to comment Share on other sites More sharing options...
LibertyBell Posted December 3, 2019 Share Posted December 3, 2019 6 minutes ago, bluewave said: Heres’s one. Thanks Chris, nice back story on that link too! Link to comment Share on other sites More sharing options...
bluewave Posted December 3, 2019 Share Posted December 3, 2019 8 minutes ago, LibertyBell said: Thanks Chris, nice back story on that link too! Sure. I just saw this report from Albany. They can pick up very heavy events this time of year even with a +AO and -PNA. The coast is limited to what it can get this time of year with the lack of good blocking. But even a light event is a really nice way to start December. Link to comment Share on other sites More sharing options...
LibertyBell Posted December 3, 2019 Share Posted December 3, 2019 8 minutes ago, bluewave said: Sure. I just saw this report from Albany. They can get very heavy events this time of year even with a +AO and -PNA. The coast is limited to what it can get this time of year with the lack of good blocking, But even a light event is a really nice way to start December, It's weird to get such a long event with no blocking! How can that happen? I was trying to remember all our 30 hour + events- did they all have blocking? The ones I can remember off the top of my head or read about- March 2018, Jan 2016, Feb 2010, Dec 2003, Feb 2003, March 2001, Jan 1996, Mar 1993, Dec 1992, Feb 1983, Feb 1978, Feb 1969, Mar 1962, Feb 1961, Dec 1960, Mar 1960, Mar 1958, Mar 1956, Dec 1947, Feb 1920, Feb 1899, Jan 1896, March 1888. There are others I'm probably forgetting. Link to comment Share on other sites More sharing options...
LibertyBell Posted December 3, 2019 Share Posted December 3, 2019 10 minutes ago, bluewave said: Sure. I just saw this report from Albany. They can get very heavy events this time of year even with a +AO and -PNA. The coast is limited to what it can get this time of year with the lack of good blocking, But even a light event is a really nice way to start December, it reminded me a bit of the post Xmas 2002 storm! Link to comment Share on other sites More sharing options...
bluewave Posted December 3, 2019 Share Posted December 3, 2019 36 minutes ago, LibertyBell said: It's weird to get such a long event with no blocking! How can that happen? I was trying to remember all our 30 hour + events- did they all have blocking? The ones I can remember off the top of my head or read about- March 2018, Jan 2016, Feb 2010, Dec 2003, Feb 2003, March 2001, Jan 1996, Mar 1993, Dec 1992, Feb 1983, Feb 1978, Feb 1969, Mar 1962, Feb 1961, Dec 1960, Mar 1960, Mar 1958, Mar 1956, Dec 1947, Feb 1920, Feb 1899, Jan 1896, March 1888. There are others I'm probably forgetting. The state of the NAO/AO/PNA isn’t as important to interior sections of the Northeast as it is to us this time of year. We needed extreme blocking for a Boxing Day Blizzard December high end outcome at the coast. Link to comment Share on other sites More sharing options...
LibertyBell Posted December 3, 2019 Share Posted December 3, 2019 4 minutes ago, bluewave said: The state of the NAO/AO/PNA isn’t as important to interior sections of the Northeast as it is to us this time of year. Well, it made me wonder if extremely long duration storms have gotten more rare with time? At least for us, our big storms seem to be more of the quick hitting high snowfall rate variety. When was the last time we had a big two or three day storm? The only three day storms I can think of are Dec 1991, Mar 1962, Feb 1920 and Mar 1888. And none of those were all snow, although the earlier two were HECS with high amounts of snow mixed in. Link to comment Share on other sites More sharing options...
SnoSki14 Posted December 3, 2019 Share Posted December 3, 2019 Models trying to kill the MJO before it gets to phase 3 instead of it freely traveling into the warmer phases like last December. Early signs of an arctic plunge that would easily deliver the coldest air of the season Dec 11-13. Still I'm a bit weary about this given the AO won't be in a hurry to turn negative. Link to comment Share on other sites More sharing options...
EasternLI Posted December 3, 2019 Share Posted December 3, 2019 35 minutes ago, LibertyBell said: It's weird to get such a long event with no blocking! How can that happen?. Well, there was blocking though. The block broke down and the storm happened. Which is how it usually goes. Look at Greenland at the end of November. Link to comment Share on other sites More sharing options...
SnowGoose69 Posted December 3, 2019 Share Posted December 3, 2019 12 minutes ago, bluewave said: The coast can also approach warning level snows this time of year with enough help from the Pacific. NYC saw this with the 12-14-13 snow event. That was at the tail end of a very big -EPO drop. So we were able to mitigate the raging +AO to some extent. 2013 12 01 -106.34 2013 12 02 -228.02 2013 12 03 -349.91 2013 12 04 -342.09 2013 12 05 -314.08 2013 12 06 -324.40 2013 12 07 -288.46 2013 12 08 -267.43 2013 12 09 -245.57 2013 12 10 -184.56 2013 12 11 -97.26 2013 12 12 -36.75 That was a SWFE though. It seems we can score in SWFEs in bad patterns. I mean nothing was worse than 12/27/84 and 12/28/90 and NYC saw 6 in both. If you time that disturbance ejecting right into the high over SE Canada you can get a big snow. The classic all snow events seem hard to get without the AO/NAO/PNA in our favor Link to comment Share on other sites More sharing options...
donsutherland1 Posted December 3, 2019 Share Posted December 3, 2019 3 hours ago, LibertyBell said: Chris, the 2017-18 winter was cold? I dstinctly remember unprecedented warmth (80 degrees) in February and early season mosquitoes and ticks! It got cold and stormy in March and early April. December (4.1° below normal in NYC) and January (0.9° below normal in NYC) were colder than normal in the region. February was exceptionally warm (Central Park set a monthly mean temperature record of 42.0° which surpassed the 41.6° average set just a year earlier). Link to comment Share on other sites More sharing options...
MJO812 Posted December 3, 2019 Share Posted December 3, 2019 1 hour ago, SnoSki14 said: Models trying to kill the MJO before it gets to phase 3 instead of it freely traveling into the warmer phases like last December. Early signs of an arctic plunge that would easily deliver the coldest air of the season Dec 11-13. Still I'm a bit weary about this given the AO won't be in a hurry to turn negative. The MJO stalls in 2. It was supposed to travel into 3 but now its not. Link to comment Share on other sites More sharing options...
LibertyBell Posted December 3, 2019 Share Posted December 3, 2019 1 hour ago, EasternLI said: Well, there was blocking though. The block broke down and the storm happened. Which is how it usually goes. Look at Greenland at the end of November. what would it have taken for this two day storm to be all snow for us? Just a small track change or some major global indices shift to make the pattern more favorable? Link to comment Share on other sites More sharing options...
EasternLI Posted December 3, 2019 Share Posted December 3, 2019 Well I'd venture a guess that climo would be one factor. It's still really early in the season. So you would probably need something more anonymous. Maybe a stronger block. Or a better PNA perhaps, along with that block. Link to comment Share on other sites More sharing options...
MJO812 Posted December 3, 2019 Share Posted December 3, 2019 It's a nice sight to see the models delaying the warmth . This is way different than last winter. Gfs is also cold with alot of chances of snow going forward. Link to comment Share on other sites More sharing options...
EasternLI Posted December 3, 2019 Share Posted December 3, 2019 Wow, we're going into the freezer if this is right. Link to comment Share on other sites More sharing options...
SnowGoose69 Posted December 3, 2019 Share Posted December 3, 2019 7 minutes ago, EasternLI said: Wow, we're going into the freezer if this is right. Unfortunately not a great pattern for big storms (in general) January 87 had a pattern like that but it’s not likely to see an all snow event there with that setup Link to comment Share on other sites More sharing options...
EasternLI Posted December 3, 2019 Share Posted December 3, 2019 This was a really impressive GEFS run today. Link to comment Share on other sites More sharing options...
LibertyBell Posted December 3, 2019 Share Posted December 3, 2019 29 minutes ago, SnowGoose69 said: Unfortunately not a great pattern for big storms (in general) January 87 had a pattern like that but it’s not likely to see an all snow event there with that setup More of a mid-late 80s pattern? Link to comment Share on other sites More sharing options...
SnoSki14 Posted December 3, 2019 Share Posted December 3, 2019 8 minutes ago, bluewave said: Now the Euro is going even more extreme than the GFS with the -EPO block near Alaska next week.This looks like something out of the winter 13-14 and 14-15 playbook. Could be a massive arctic outbreak if trends continue followed by a possible SWFE. Euro even has some -NAO ridging. Link to comment Share on other sites More sharing options...
David-LI Posted December 3, 2019 Share Posted December 3, 2019 24 minutes ago, SnoSki14 said: Could be a massive arctic outbreak if trends continue followed by a possible SWFE. Euro even has some -NAO ridging. Euro looks interesting around the 13th Link to comment Share on other sites More sharing options...
Rtd208 Posted December 3, 2019 Share Posted December 3, 2019 DT (WxRisk) has posted his final winter outlook. https://onedrive.live.com/view.aspx?resid=1CA2F9A16D1A6375!13380&ithint=file%2cpptx&authkey=!AC_lsieTX6tAQh0 Link to comment Share on other sites More sharing options...
David-LI Posted December 3, 2019 Share Posted December 3, 2019 7 minutes ago, bluewave said: The NEPAC warm blob associated with these extreme -EPO blocks is running at very warm levels. There is also record low sea ice extent around Alaska. An experimental forecast for the NEPAC SST’s gets close to the 2015 warmth record. So that Arctic high that the Euro generates is very impressive for this time of year. It could be one of the stronger Arctic outbreaks for mid-December. Could also be SWFE potential as the Arctic high slides east. Current +NPM warm blob Experimental forecast with full forecast in the link https://www.dropbox.com/s/xxuft0mmb3qzvzb/DiLorenzo-heatwave-prediction-2020.pdf?dl=0 What does this all mean for snow in the northeast? Link to comment Share on other sites More sharing options...
binbisso Posted December 3, 2019 Share Posted December 3, 2019 This is from PSU Hoffman in the Mid-Atlantic forum who I always enjoy reading his insights. They have some really good discussion is in there medium-range thread. I thought I would post it here for us to see. I hope he doesn't mind. QBO for November came in at 5.07. Looking at the progression the closest matches to this year are 2004, 2002, 1997, 1978, and 1969. Of those the best match purely on QBO continues to be 2002 with the last 3 months all being nearly identical. Of the 15 winter months those years the AO was negative 12/15 months. The only year of those that didn't feature a -AO for 2/3 months was 2004-5 but it is notable that year started with an extremely +AO and flipped mid January. There were 2 other years that were somewhat close, 1955 and 1961. If we include those the AO was negative 17/21 months. Link to comment Share on other sites More sharing options...
MJO812 Posted December 3, 2019 Share Posted December 3, 2019 51 minutes ago, bluewave said: Now the Euro is going even more extreme than the GFS with the -EPO block near Alaska next week.This looks like something out of the winter 13-14 and 14-15 playbook. Those dates are some analogs for this winter Link to comment Share on other sites More sharing options...
LibertyBell Posted December 3, 2019 Share Posted December 3, 2019 56 minutes ago, bluewave said: Now the Euro is going even more extreme than the GFS with the -EPO block near Alaska next week.This looks like something out of the winter 13-14 and 14-15 playbook. what exactly changed that the models didn't pick up on earlier, Chris? Link to comment Share on other sites More sharing options...
LibertyBell Posted December 3, 2019 Share Posted December 3, 2019 17 minutes ago, bluewave said: The NEPAC warm blob associated with these extreme -EPO blocks is running at very warm levels. There is also record low sea ice extent around Alaska. An experimental forecast for the NEPAC SST’s gets close to the 2015 warmth record. So that Arctic high that the Euro generates is very impressive for this time of year. It could be one of the stronger Arctic outbreaks for mid-December. Could also be SWFE potential as the Arctic high slides east. Current +NPM warm blob Experimental forecast with full forecast in the link https://www.dropbox.com/s/xxuft0mmb3qzvzb/DiLorenzo-heatwave-prediction-2020.pdf?dl=0 that's the first time I've ever seen an alert for a marine heatwave posted lol. Link to comment Share on other sites More sharing options...

Recommended Posts
Archived
This topic is now archived and is closed to further replies.