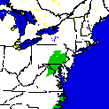
Ian Posted November 18, 2010 Share Posted November 18, 2010 the original thread asking for snow total submissions is attached, and here is the map Katie (mapgirl18) created. i had cited the eastern thread in forthcoming book but i might need to fix that... heh. i'd like to come back to it again soon if we can get more data. Full story: http://voices.washin..._2009_2010.html Data set: http://voices.washin..._nov10-ver1.pdf This and other maps by Katie covering last yrs storms will appear in "Snowmageddon: Washington's Record-breaking Winter of 2009-10". Howmuchsnowdidyougetin2009-10-EasternUSWeatherForums.html Link to comment Share on other sites More sharing options...
soadforecaster Posted November 18, 2010 Share Posted November 18, 2010 map i say over all looks a little sketchy, i can tell you for a fact that most of Delaware County had at least 80". i would say most of south east pa had close to 80", i think it would be best if you compared it with this map all the numbers from this map are reports from member of eastern. Link to comment Share on other sites More sharing options...
Ian Posted November 18, 2010 Author Share Posted November 18, 2010 They are pretty similar outside a dot or two. The scale is not the same. Link to comment Share on other sites More sharing options...
ORH_wxman Posted November 18, 2010 Share Posted November 18, 2010 map i say over all looks a little sketchy, i can tell you for a fact that most of Delaware County had at least 80". i would say most of south east pa had close to 80", i think it would be best if you compared it with this map all the numbers from this map are reports from member of eastern. Why are you claiming that when the map you posted as a reference shows only a few bulleyes of 80"+. BTW nice map Ian/Katie....I like to do them every year now for SNE. I think they are a great way to archive a winter. You see surprisingly few seasonal snowfall maps around. Link to comment Share on other sites More sharing options...
Ian Posted November 18, 2010 Author Share Posted November 18, 2010 Why are you claiming that when the map you posted as a reference shows only a few bulleyes of 80"+. BTW nice map Ian/Katie....I like to do them every year now for SNE. I think they are a great way to archive a winter. You see surprisingly few seasonal snowfall maps around. Yeah, I couldnt find one when I looked so it was good Katie does it for a living. I think it can still be tweaked.. we have not really filled in much for orographics etc, and we removed a few more of the dots for the book purposes. It's a work in progress if we can find more totals, but I'm not sure where else to look right now. It would be nice to keep doing them going forward, perhaps not as interesting though... Link to comment Share on other sites More sharing options...
mappy Posted November 18, 2010 Share Posted November 18, 2010 Nice to see you on the board Ian Link to comment Share on other sites More sharing options...
mappy Posted November 18, 2010 Share Posted November 18, 2010 Why are you claiming that when the map you posted as a reference shows only a few bulleyes of 80"+. BTW nice map Ian/Katie....I like to do them every year now for SNE. I think they are a great way to archive a winter. You see surprisingly few seasonal snowfall maps around. Thank you! Yeah, I couldnt find one when I looked so it was good Katie does it for a living. I think it can still be tweaked.. we have not really filled in much for orographics etc, and we removed a few more of the dots for the book purposes. It's a work in progress if we can find more totals, but I'm not sure where else to look right now. It would be nice to keep doing them going forward, perhaps not as interesting though... I'm down to continue to make maps for you - as you said, I do it for a living and making weather related maps are a bit more exiciting than mapping test pit, geoprobe, soil and groundwater samples as I do each day haha Link to comment Share on other sites More sharing options...
sauss06 Posted November 18, 2010 Share Posted November 18, 2010 That is a very cool map. Link to comment Share on other sites More sharing options...
2010 extreme Posted November 18, 2010 Share Posted November 18, 2010 Map looks very accurate, will be saving it, and will probably not be seeing anything like it in my life time. Link to comment Share on other sites More sharing options...
Allsnow Posted November 18, 2010 Share Posted November 18, 2010 Very nice work...good job katie and ian Link to comment Share on other sites More sharing options...
Riptide Posted November 18, 2010 Share Posted November 18, 2010 Very nice and very accurate maps. They are now in my collection. Link to comment Share on other sites More sharing options...
YoRyz Posted November 18, 2010 Share Posted November 18, 2010 Nice map! The scale makes it easy on the eye. Such high snow totals could make for a rainbow nightmare if you try to get too fine with the detail. Also, I'm sure the plotting for the map around the Philadelphia region is accurate. IF you read the methodology, there were multiple plot points used in and around Philadelphia. Link to comment Share on other sites More sharing options...
Ian Posted November 18, 2010 Author Share Posted November 18, 2010 I'm down to continue to make maps for you - as you said, I do it for a living and making weather related maps are a bit more exiciting than mapping test pit, geoprobe, soil and groundwater samples as I do each day haha yeah, i know, it's mostly just been me being busy lately plus you did a lot of hard work over a short period so i dont want to bother you nonstop. we're finally done with the book though so that's nice. i may take a few weeks and not think about any related matters.... Link to comment Share on other sites More sharing options...
Ian Posted November 18, 2010 Author Share Posted November 18, 2010 Nice map! The scale makes it easy on the eye. Such high snow totals could make for a rainbow nightmare if you try to get too fine with the detail. Also, I'm sure the plotting for the map around the Philadelphia region is accurate. IF you read the methodology, there were multiple plot points used in and around Philadelphia. yeah i think the scale works pretty well for the data we have obtained. katie did in 10 and 20" increments as well that i can dig up and post for comparo or she can share if she'd like. i really like the 10 but we need more numbers for it i think. i think everything is pretty accurate save some data holes and potentially incorrect measurements etc. katie used a program to plot etc, rather than doing by hand. sure the second method can produce fine results but it might also be more open to error if the person isnt skilled. Link to comment Share on other sites More sharing options...
mappy Posted November 18, 2010 Share Posted November 18, 2010 Nice map! The scale makes it easy on the eye. Such high snow totals could make for a rainbow nightmare if you try to get too fine with the detail. Also, I'm sure the plotting for the map around the Philadelphia region is accurate. IF you read the methodology, there were multiple plot points used in and around Philadelphia. Thank you I should say that I don't doubt that the other map posted in this thread isn't accurate, however it's probably not 100% accurate. Mine isn't even 100% accurate because we had a lot of areas where we just didn't have data and had to guess. Though, I'd love to read the methodology on how that map was created. Link to comment Share on other sites More sharing options...
mappy Posted November 18, 2010 Share Posted November 18, 2010 yeah i think the scale works pretty well for the data we have obtained. katie did in 10 and 20" increments as well that i can dig up and post for comparo or she can share if she'd like. i really like the 10 but we need more numbers for it i think. i think everything is pretty accurate save some data holes and potentially incorrect measurements etc. katie used a program to plot etc, rather than doing by hand. sure the second method can produce fine results but it might also be more open to error if the person isnt skilled. 10 and 20 are below Link to comment Share on other sites More sharing options...
yoda Posted November 18, 2010 Share Posted November 18, 2010 Who has that dot of over 100 inches in Howard County? Link to comment Share on other sites More sharing options...
mappy Posted November 18, 2010 Share Posted November 18, 2010 Who has that dot of over 100 inches in Howard County? Elkridge - 103 Link to comment Share on other sites More sharing options...
Avdave Posted November 18, 2010 Share Posted November 18, 2010 Elkridge - 103 I still think in that one storm they had a bogus reading. I cant remember which one, but I know we were all talking about it on the board. Link to comment Share on other sites More sharing options...
mappy Posted November 18, 2010 Share Posted November 18, 2010 I still think in that one storm they had a bogus reading. I cant remember which one, but I know we were all talking about it on the board. Oh I know - there were some that were totally off - like the Bethesda one. When Ian wants to go back and re-work on it, we will. We never said it was 100% correct. Link to comment Share on other sites More sharing options...
Avdave Posted November 18, 2010 Share Posted November 18, 2010 Oh I know - there were some that were totally off - like the Bethesda one. When Ian wants to go back and re-work on it, we will. We never said it was 100% correct. Oh I know, Im not blaming you guys. You can only go with what data you had to work with. Well we know why the Bethesda one was off It is still a really good map from the historic season though Link to comment Share on other sites More sharing options...
aldie 22 Posted November 18, 2010 Share Posted November 18, 2010 Nice map Link to comment Share on other sites More sharing options...
Master of Disaster Posted November 19, 2010 Share Posted November 19, 2010 Ive got to be honest, I dont get along with Mapgirl at all, but the GIS work she did on that map is really good. Better then I can pull from our GIS department and they have a staff of 15 or so. As far as how MOCO is depicted with its totals, the cutoff over the DC line is pretty dead on and reflects how they had some precip issues over that precise area during the Feb Blizzard. From an Emergency Manager who doesnt get impressed by much, job well done guys. Link to comment Share on other sites More sharing options...
Midlo Snow Maker Posted November 19, 2010 Share Posted November 19, 2010 WHERE IS TH DT 5" BUBBLE? Link to comment Share on other sites More sharing options...
Avdave Posted November 19, 2010 Share Posted November 19, 2010 WHERE IS TH DT 5" BUBBLE? Link to comment Share on other sites More sharing options...
clskinsfan Posted November 19, 2010 Share Posted November 19, 2010 Well done. Even got the little bubble west of Winchester or MBY. Looks about perfect to me. Link to comment Share on other sites More sharing options...
BayStatuh2NoVA Posted November 19, 2010 Share Posted November 19, 2010 Very nice maps. My IRL job includes working with our GIS gurus on maps and the ones you have posted are pleasing to the eye, especially in terms of color choices. I particularly like the 10 map. Thanks for posting them. Link to comment Share on other sites More sharing options...
mappy Posted November 19, 2010 Share Posted November 19, 2010 Thank you all... and I mean all... for the kind words. Link to comment Share on other sites More sharing options...
Kmlwx Posted November 19, 2010 Share Posted November 19, 2010 Thank you all... and I mean all... for the kind words. I will echo the compliments. Awesome map! I have already showed it to a few friends looking for information on last winters snow...they were also impressed. Great work! Link to comment Share on other sites More sharing options...
Wow Posted November 20, 2010 Share Posted November 20, 2010 Pretty cool....Katie we could use your talents around here more often. Love the map work. Link to comment Share on other sites More sharing options...

Recommended Posts
Archived
This topic is now archived and is closed to further replies.