All Activity
- Past hour
-

September 2025 OBS-Discussion centered NYC subforum
donsutherland1 replied to wdrag's topic in New York City Metro
Additional rain is likely tonight into tomorrow. A storm total 0.50"-1.50" rainfall covering late yesterday through tomorrow is likely in New York City and nearby suburbs. Some locations could see higher amounts in excess of 2.00". The potential for an area of 1.00"-3.00" rainfall exists for parts of Connecticut, Massachusetts, and a secton of southeastern New York State well north and west of New York City. Above normal temperatures will continue through at least the coming weekend. Another round of showers is possible Saturday night into Sunday. In addition, Humberto has developed in the central Atlantic and a second tropical cyclone could develop in the western Atlantic in coming days. The extent of ridging to the north and interaction between the two systems could ultimately determine whether one of these systems poses an eventual threat to a portion of the Southeast or stays out to sea. The potential Fujiwhara interaction would be unusual for the Atlantic basin. Typically, if the stronger system is to the right or east of the weaker one (possibly Invest. 94 as per most of the guidance at present), the stronger system will tend to deflect the weaker one northward and eastward sooner than might otherwise be the case. If both systems are of similar strength, they can rotate counterclockwise around a midpoint roughly between the centers of the two storms as they move along the steering flow. For now, tropics bear watching. The ENSO Region 1+2 anomaly was 0.0°C and the Region 3.4 anomaly was -0.4°C for the week centered around September 17. For the past six weeks, the ENSO Region 1+2 anomaly has averaged -0.03°C and the ENSO Region 3.4 anomaly has averaged -0.38°C. La Niña conditions will likely develop during mid- or late-autumn. The SOI was +1.43 today. The preliminary Arctic Oscillation (AO) was +1.113 today. Based on sensitivity analysis applied to the latest guidance, there is an implied near 82% probability that New York City will have a warmer than normal September (1991-2020 normal). September will likely finish with a mean temperature near 70.0° (0.8° above normal). Supplemental Information: The projected mean would be 2.0° above the 1981-2010 normal monthly value. -
Occasional Thoughts on Climate Change
donsutherland1 replied to donsutherland1's topic in Climate Change
By “unmanageable,” I mean a future marked by significant disruption (economic dislocation, migration, and irreversible environmental/biodiversity loss). These changes will not unfold overnight, but they are already being set in motion. Even a one-meter rise in global sea level, plausible by 2100 and very likely to continue beyond, would reclaim entire neighborhoods of many major coastal cities. Even at one-meter, tens of millions of people would be displaced from major coastal cities. See: https://pmc.ncbi.nlm.nih.gov/articles/PMC8208600/ We don’t have to rely solely on climate models to understand where things are headed under current policy. Paleoclimate evidence is unambiguous. During the mid-Pliocene, when atmospheric CO2 concentrations hovered around 350–450 ppm (levels we have already reached) global temperatures were roughly 3 °C (5.4 °F) warmer than today, and sea level stood at least 10 m higher than at present. See: https://sciences.ucf.edu/biology/d4lab/wp-content/uploads/sites/23/2018/08/Science-2015-Dutton-.pdf The climate system responds slowly but inexorably to sustained forcing. Ice sheets have not yet equilibrated to today’s CO2 levels, but over centuries to millennia continued melt is inevitable. Research indicates potential hysteresis once a critical threshold is crossed. Under hysteresis, cooling back to current temperatures will not fully restore lost ice. Some modeling places the Greenland Ice Sheet’s critical threshold at roughly 1.7 °C–2.3 °C above pre-industrial temperatures, a range that will likely be surpassed later this century. Warming also amplifies extremes rather than simply shifting the average. Climate change does not “cause” every drought, heatwave, or flood, but it makes them more frequent and more severe, a conclusion supported by a rapidly expanding body of attribution science. See: https://www.worldweatherattribution.org/ Being honest about these well-documented risks is not scaremongering. Communicating evidence-based threats, whether to coastal cities, food and water security, or human health, is a fundamental responsibility of scientists, leaders, and citizens. Describing dangers that the data clearly support is not “spreading fear.” It is providing the information societies need to plan and adapt. That some shrink from the task e.g., as one witnessed at the UN General Assembly, is not an act of courageous leadership. It is an abdication of leadership responsibility and a demonstration of leadership failure. It is a profound display of disregard for the wellbeing of future generations who will have to live with the consequences of bad choices made by those who will evade those very consequences by their having departed the scene well before the tragic returns on their bad policy investments are realized. Given this evidence, the burden of proof no longer lies with scientists who have documented human-induced climate change and its risks. It lies with those who advocate inaction, who must explain how a 3 °C or warmer world relative to pre-industrial temperatures, which is likely by 2100 on the current path, could remain “manageable” despite escalating threats to food and water systems, ongoing ocean acidification, intensifying extreme weather, and one-meter sea-level rise (with more to come beyond 2100). It is their burden to prove at a high confidence level that the laws of physics somehow don't apply in the case of greenhouse gases. Finally, claims that models are unreliable are belied by their track record. Climate models have consistently captured the long-term warming trend with striking accuracy despite the climate system’s complexity. See: https://agupubs.onlinelibrary.wiley.com/doi/full/10.1029/2019GL085378 -
Tornado confirmed in Livingston Manor
-

September 2025 OBS-Discussion centered NYC subforum
jm1220 replied to wdrag's topic in New York City Metro
Looks very Hurricane Florence-ish. -
You just need to send me out jogging. It only rained here today when I was out running. Fortunately, I grabbed a zip-loc bag for my phone. Only Helene was worse. The weight of my shoes and clothes was ROUGH by the end of the run. Unrelated to John's post(and so I don't have to post again)...Definitely keeping an eye on recent trends for the tropical system early-mid week. The 12z GFS has it hitting the Apps at a 90 degree angle. I don't think it will be as bad as last year or even close to that. So, I don't want to raise that alarm. The storm just doesn't hold together...moving slower to boot. Some model runs do have several inches on the taller peaks of W NC. The one thing I am watching is that it has had a tendency to stall on some runs.
-
Great to hear. Right now, trying to guess where storms are going to pop is akin to wearing a blindfold and throw darts at a dart board. There is some degree of accuracy, but not a lot. Anyway, glad you all were able to get the event in. I am always hesitant to offer specifics, but will when I can. During my early years of following weather model snow output(late 90s), I had a coworker heading to W NC for a wedding. The NWS had issued heavy snow warnings, and I told her it might not be a good idea to travel over the mountain. We might have received a brief snow shower - even in the mountains. We got totally blanked. So, I always get a bit queasy when lots of money and big events are held...and I give any input. I have an old roommate who currently works on-air for ESPN's college football programming. Several years ago, the Euro started putting out HUGE snow outputs for Charlotte. I am talking 4-5 feet. I thought it was feedback, but the model was just adamant that a blizzard was coming. For like 4-5 days, it had huge amounts, and didn't budge even as it was apparent the storm was a no-go. Earlier I had sent him a message to keep an eye on it. I don't even think the grass was ever covered. When referencing another forecaster.....I think he used the word - charlatan. LOL - yikes. I gladly leave the real stuff to Jeff and Co. Ha!
-
Torrential ftw.
-
You got that right (soupy). Stayed in the upper 60s here both yesterday and this afternoon but it felt like earlier in the summer with the high humidity. Have received 0.61" over the last two days which is the most in two months, so I'll take what I can get. Be nice to cash in on whatever this weekend brings, but you (and especially me) look to be on the fringes. Fingers crossed.
-

September 2025 OBS-Discussion centered NYC subforum
Brian5671 replied to wdrag's topic in New York City Metro
they didn't get that much rain -
September 2025 OBS-Discussion centered NYC subforum
Brian5671 replied to wdrag's topic in New York City Metro
Nice line of storms coming into Eastern PA hopefully it holds together -
 Gonna whack Hatteras with la chancla.
 -
I wonder how much the rain this week will help change the colors on that map a little next week. Unfortunately it looks dry for a while also.
-
 Hoping Imelda stays away from NC and doesn't bring all her shoes with her. Gen X joke.
 -
From about 60 feet to the Stratus, looks like about 0.5".
- Today
-
70/68 2 day total: 2.60"
-
 Forecasts for October will appear below. This post will eventually become annual scoring update (around 1st of October).
 -

September 2025 OBS-Discussion centered NYC subforum
SACRUS replied to wdrag's topic in New York City Metro
81 / 74 here more breaks of clouds and sun -
After a VERY foggy start here, sun poked out for about 45 minutes, immediately followed by a quick thundershower that dropped about a tenth in ten minutes or less. Currently a soupy/muggy 71.9/70.0 at 3:40 pm after a high of 75.8 an hour ago.
-

September 2025 OBS-Discussion centered NYC subforum
Sundog replied to wdrag's topic in New York City Metro
The EURO is a crap model, a real flip flopper -

September 2025 OBS-Discussion centered NYC subforum
WeatherGeek2025 replied to wdrag's topic in New York City Metro
i need rain for my bet lol -
That’s assuming this is the time we finally have the floodgates open after the Niña breaks instead of the dry pattern injecting steroids against all logic.
-
Drought monitor is starting to look pretty rough to the S and E of the forum. Widespread D1 with pockets of D2 and even an area of D3 (!) in OH and S IL.
-

2025-2026 ENSO
PhiEaglesfan712 replied to 40/70 Benchmark's topic in Weather Forecasting and Discussion
I won't be surprised if it verifies. Signature -ENSO/strong -IOD January has very warm anomoly. Here are my top analogs: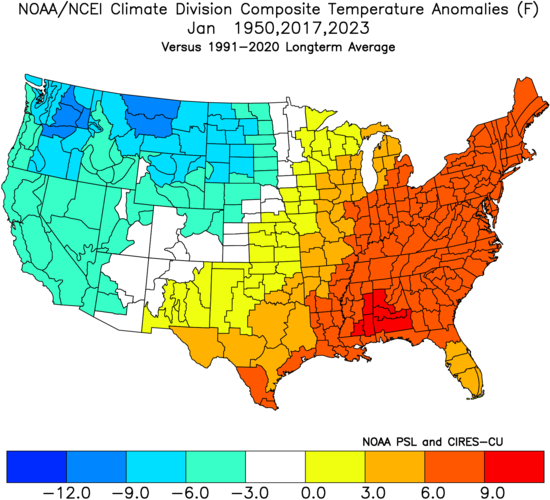
-
We'll have plenty of those this winter.
-

September 2025 OBS-Discussion centered NYC subforum
BobbyHolikWillFindYou replied to wdrag's topic in New York City Metro
Anybody heading to the Ryder Cup in LI tomorrow? Guessing it will be a muddy mess for the first half of the day.


.thumb.JPG.418e8a9a2902ae687ec35ff4bc0e038e.JPG)