All Activity
- Past hour
-
It’s also windy AF out. But finally some dim sun.
-
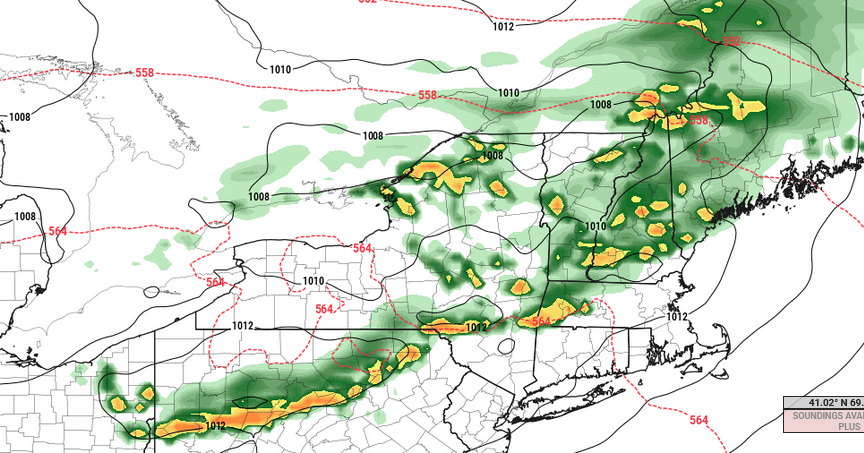
Too bad we don't have better lapse rates Tuesday afternoon because that looks modestly interesting given the other synoptic parameters. W to WNW at 700 mb, SW below 850mb is a directional +helicity. About 20 to 25 kts +d(v) between 925 and 500 so not great speed shear. But I said "modestly" heh But a front is approaching into a DP anomaly that pushed its way up to S VT/NH latitudes in most guidance. > 60 F, with ongoing temperatures 80+. This is a June CAPEd air mass smeared up under an impulse cutting through N VT/NH late in the afternoon and evening, arriving after the morning and early afternoon were baked under more sun than clouds. As an aside, tomorrow is going to seem out of place. Anachronistic because the landscape is still lagged lagged so far behind what people typically associate with air of summer aroma. Anyway, the Euro still sniffing out enough instability and a mechanics to ignite broken lines of coherent convective QPF structures in these charts.
-
Wow, the gradient of natural snow has been so pronounced all season in VT. I skied Killington Wednesday and Thursday and the natural snowpack was pretty sparse. Skied Friday at SLoaf and natural terrain on upper half of mountain was still very good, i.e. bubblecuffer and king pine area.
-
General rule is that pre-nino summers are colder and post-nino summers are warmer in the East. It wasn't 1995 (that was one of the warmest summers on record, as was 1993 and 1994). However, both 1996 and 1997 were cooler summers (1997 was a pre-nino summer). It must have been one of those years. The only time the rule didn't hold was when the pre-nino summer of 1991 was very warm, and the post-nino summer of 1992 was cool. However, we had a major volcano in 1991 (in Pinatubo), and that screwed things up. 91-92 behaved more like the reverse of the way an el nino would normally. Global temperatures actually cooled, as the effects of Pinatubo canceled out a robust el nino.
-
FYP.
-
The summer of 2023 wasn’t really that cool at all. But relative to the other recent years it seemed that way. I guess the new definition of a cool summer in the 2020s is under 30 days reaching 90° at a warm spot like Newark like in 2023. An actual cool summer like 2014 and 2009 had 15 or fewer days. A really cool summer like 1996 had under 10 days. Time Series Summary for NEWARK LIBERTY INTL AP, NJ - Jan through Dec Days Reaching 90° Click column heading to sort ascending, click again to sort descending. 2025 39 0 2024 33 0 2023 29 0 2022 49 0 2021 41 0 2020 31 0 Coolest summers since 1961 Time Series Summary for NEWARK LIBERTY INTL AP, NJ - Jan through Dec Days Reaching 90° Click column heading to sort ascending, click again to sort descending. 1 1967 7 0 2 1996 9 0 3 1985 11 0 4 1982 12 0 - 1975 12 0 5 2004 13 0 6 2009 14 0 - 1962 14 0 7 2014 15 0 - 1976 15 0 - 1969 15 0 The thing to watch as we head into the summer is if a much wetter pattern than we have been experiencing can develop. Since we had some record rainfall and flooding events going into the summer in 2023. Hard to tell at this early stage if this El Niño will respond with that much wetness. Long range precipitation forecasting is very low skill.
-
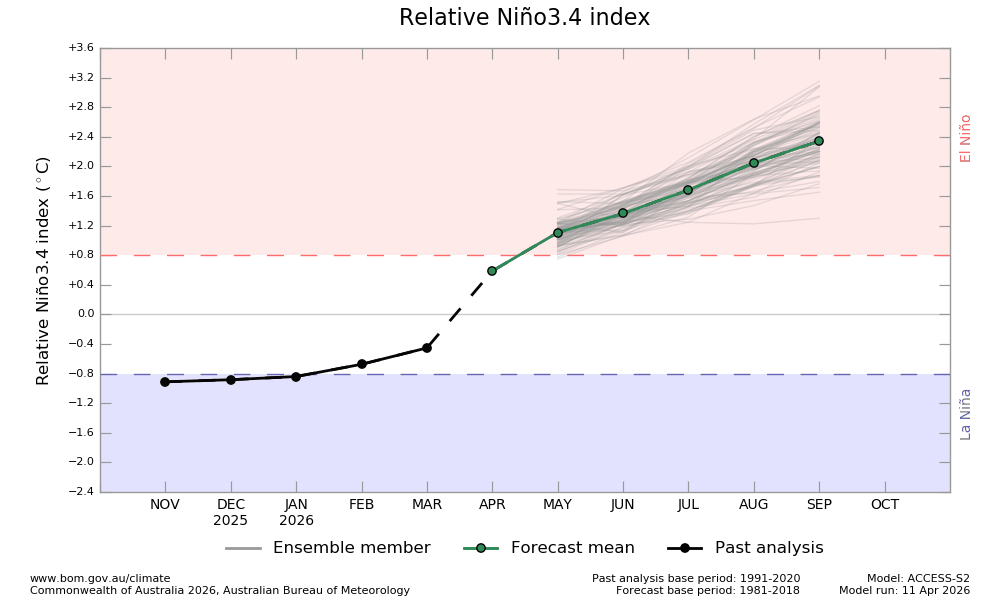
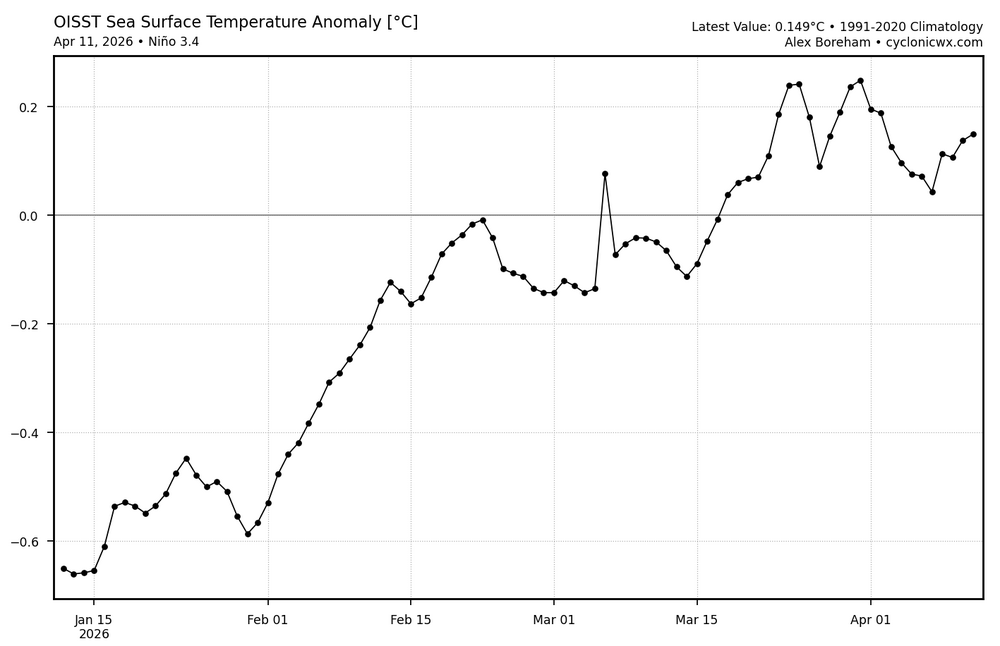
The newest BoM prog (dated April 11th) is unchanged and thus still has a RONI of +0.6 for April averaged out. This is almost certainly going to end up much too warm for April: How do I know it is almost definitely going to bust much too warm for April? Weekly RONI equivalent: 3rd column is 3.4 01APR2026 0.6 -0.3 -0.2 0.3 08APR2026 1.0 -0.2 -0.3 0.2 https://www.cpc.ncep.noaa.gov/data/indices/rel_wksst9120.txt So, the weeks centered on April 1/April 8 were -0.2/-0.3. Here’s the current OISST, which isn’t relative and thus one needs to subtract ~0.5 from it: As the above chart shows, there’s been no net warming for the last 3 weeks and the latest few days of OISST have been only +0.05 to +0.15. Subtracting 0.5 gives ~-0.4 for the RONI equivalent. April 1-11 OISST are likely no warmer than ~-0.3 for RONI equiv. To be conservative in converting from OISST to ERSST, I’ll call it -0.2 for RONI MTD. The weeklies I showed suggest between -0.2 and -0.3. How is it even possible for April RONI as a whole to come in anywhere near as warm as +0.6? These daily OISST readings (don’t forget these are not relative) would need to skyrocket to an avg of at least ~+1.5 for Apr 12-30!! And with OISST starting off at <+0.2, there are going to have to be some +2++ dailies starting no later than 2 weeks from now! Nothing even remotely close to that extremely rapid rate of warming has occurred on record.
-
Nino summer are not exactly known for warmth. I dont know if thats in play this summer or next, but I remember one such summer in 1995 when the AC rarely if ever went on. Granted, it was a cooler climate back then
-
The other thing to consider is that the long range models showed blocking developing in late March-early April and it never happened. So let's see if this is real or more longer term forecasts that don't work out.
- 350 replies
-
- 1
-

-
- april showers bring may..
- rain
- (and 2 more)
-

Central PA Spring 2026 Discussion/Obs Thread
Jns2183 replied to Voyager's topic in Upstate New York/Pennsylvania
I just want to get it as cold as possible going into this monstrosity. Our Average high the past 25 years this week is 65 degrees which appears to be our low temperature this week Sent from my SM-S731U using Tapatalk
-
April 13 1949: A late-season snowstorm dumps over 9 inches in parts of the Twin Cities metro area. For Monday, April 13, 2026 1877 - The second coastal storm in just three days hit Virginia and the Carolinas. The first storm flattened the sand dunes at Hatteras, and widened the Oregon inlet three quarters of a mile. The second storm produced hurricane force winds along the coast of North Carolina causing more beach erosion and land transformation. (David Ludlum) 1955 - The town of Axis, AL, was deluged with 20.33 inches of rain in 24 hours establishing a state record. (The Weather Channel) 1986 - A major spring storm quickly intensified bringing blizzard conditions to much of the Northern Plains Region. Up to 18 inches of snow was reported in North Dakota, and in South Dakota, winds gusting to 90 mph whipped the snow into drifts fifteen feet high. Livestock losses were in the millions of dollars, and for some areas it was the worst blizzard ever. (Storm Data) 1987 - Thunderstorms in northern Texas produced wind gusts to 98 mph at the Killeen Airport causing a million dollars property damage. Two airplanes were totally destroyed by the high winds, and ten others were damaged. (The National Weather Summary) (Storm Data) 1988 - Low pressure off the Atlantic coast produced high winds across North Carolina, with gusts to 78 mph reported at Waves. The high winds combined with high tides to cause coastal flooding and erosion. About 275 feet of land was eroded from the northern tip of Pea Island. (The National Weather Summary) (Storm Data) 1989 - Thunderstorms in central Florida produced golf ball size hail and a tornado near Lakeland FL. Fair and mild weather prevailed across most of the rest of the nation. (Storm Data) (The National Weather Summary) 1990 - Thunderstorms developing along a cold front produced severe weather in central Oklahoma and north central Texas. Thunderstorms in Oklahoma produced up to six inches of golf ball size hail along I-40 near El Reno, and produced wind gusts to 75 mph at Okarche. Thunderstorms over north central Texas produced softball size hail northwest of Rotan, and high winds which injured two persons southeast of Itasca. (The National Weather Summary) (Storm Data) 2004 - The latest measurable snowfall on record hits Jackson, TN, causing six traffic fatalities. 2006 - The University of Iowa campus is hit by an F2 tornado. The storm severely damaged many buildings in the area, including a sorority and a local church. No fatalities were reported in the storm that caused more than $12 million in damage.
-
yup definitely going to need sun for sure, probably especially to our southwest because there doesn't seem to be much in the way of momentum to really blow this warm front through. Haven't looked at any guidance since Friday but I do recall on Friday thinking there was a chance we could be mucked in a bit longer on Monday. Could be a day where like Danbury, CT is able to just get into sun/warmer airmass and pull out a 73 while most everyone else is barely into the lower 60's. But idk...there might be an opportunity to start ridding of this lower cloud deck late morning
-
The difference is that we had record warmth in 2023 starting in January. I mean, we had to regress to the mean at some point. We had more blocking in late April, and that pattern lasted through May and June, and gave us our coldest May/June in many years. I don't expect that this year. It's likely May will be a lot closer to normal, but we aren't getting -2/-3 monthly temperature departures like May and June 2023.
-
I take it they got there in time to put it out?
-
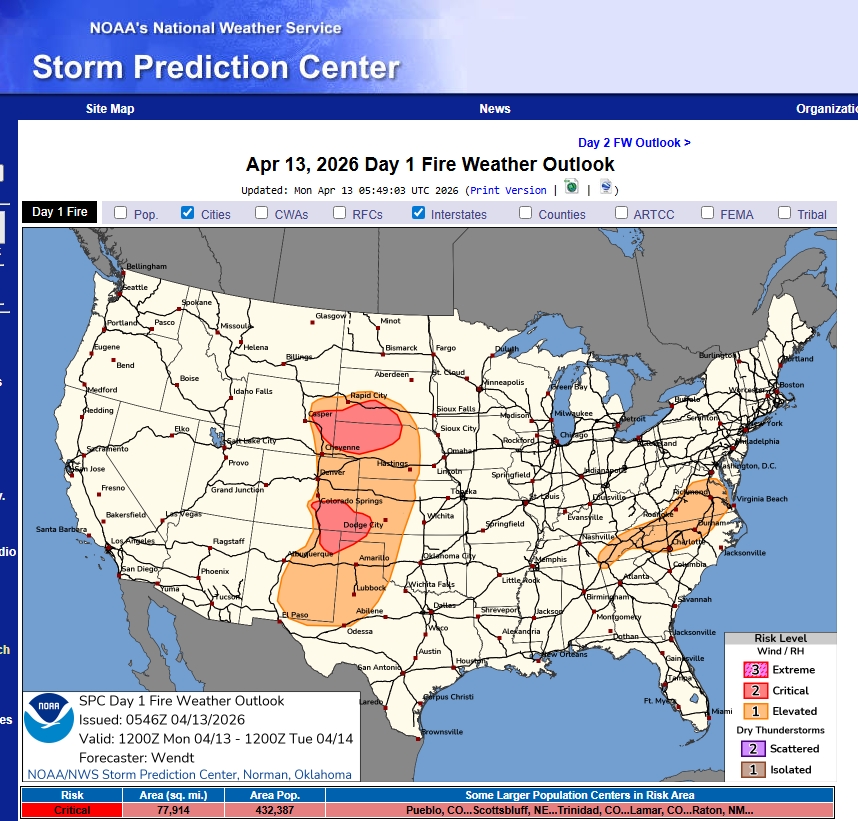
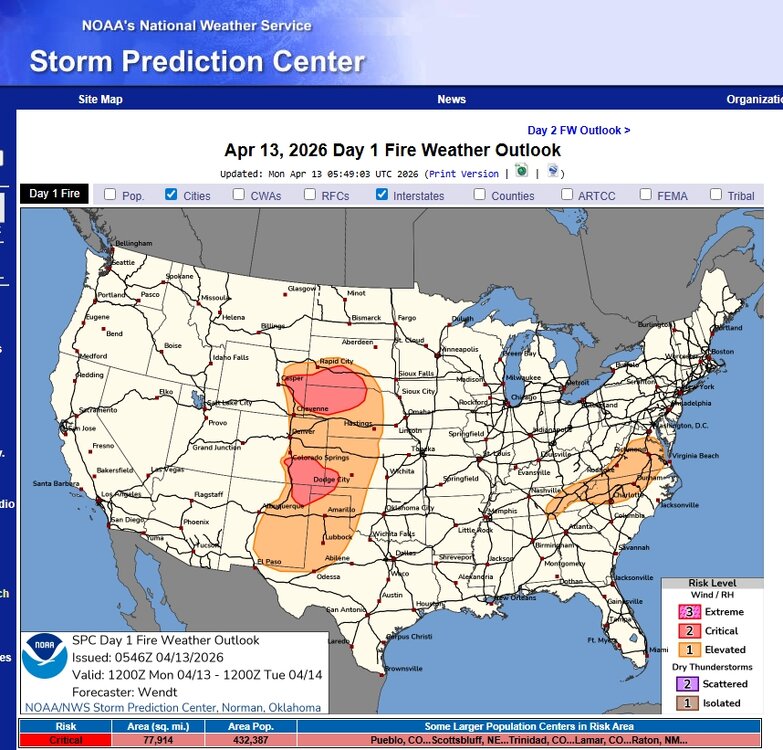
May see this on/off over parts of southeast thru weekend. Can use this also for some good info. NWS Greenville-Spartanburg Fire Weather Page
-
Need the sun... WPC's analyzing a warm boundary danging NW/SE over mid PA/W NY. That's 600 mi away. It may mix out and reposition NE. Sometimes that happens where you get warm front jump. Could... It's one of those situations where there's a WSW flow at all levels so limited mechanical resistance. If not and it moves the distance tho, we have a ways to go before we get into any kind of air mass latency assist. That means we're wholly dependent on the sun to recover from this 47 to 50 F blegh. Also, folks should count on Thursday being an eastern region wide bust because Mets try to fight (unsuccessfully) the inevitability of 150 mb deep shallow slab of BD incontinence. Heh. The upshot is that there are some models not as cold porn as the GFS' lvl details and if one of those worked out, you get pleasantly surprised.
-
I was a bit underwhelmed awakening to cloudy and 45.
-

2026-2027 El Nino
bluewave replied to Stormchaserchuck1's topic in Weather Forecasting and Discussion
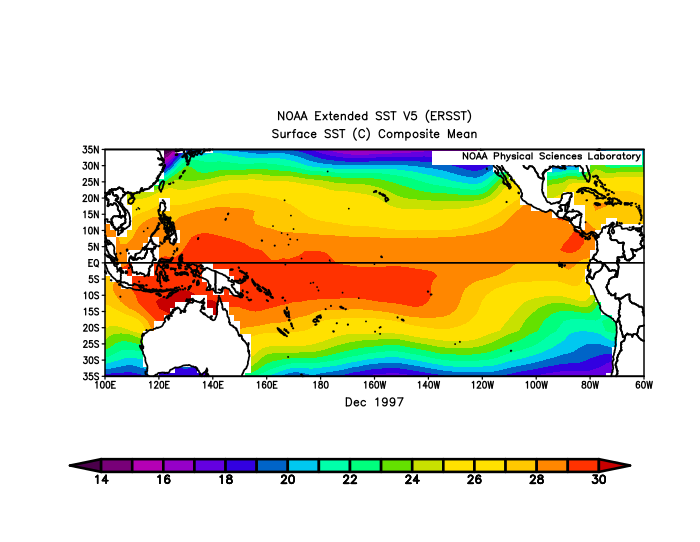
The Nino regions have been steadily warming over the years. So it takes a lower ONI departure in a modern climate to record the same actual SSTs. The atmospheric forcing responds to the actual SSTs especially when getting close to the threshold temperatures. This is why we had such a strong El Niño response with regard to the 500mb and ridge over Canada and the Northern States with record warmth back in 2023-2024 with a lower ONI than 1997-1998. The totality of the SST warmth from Nino 1+2 to Nino 4 extending west of the Dateline was among the highest ever recorded for the actual SSTs during an El Niño. ONI and RONI values for just 3.4 won’t always reflect this. The lower RONI values may have been a result the lack of a significant El Niño trough in the East and South and weaker Aleutian low than normal. So we didn’t need ONI or RONI values as strong as 1997-1998 or 2015-2016 to create similar effects. So if this event can max out at around 2.0° ONI or higher in Nino 3.4, then it possible it can have an effect closer to 2.3° to +2.5° in the old days especially with the Nino ridge and warmth to the north. The actual SSTs may be more important than the specific departures in measuring the actual magnitude necessary to initiate a strong El Niño atmospheric response. Nino 3.4 got to 28.57° during the early winter back in 2023. https://www.cpc.ncep.noaa.gov/data/indices/oni.ascii.txt NDJ 2023 28.57 2.06 Notice how much mare expansive the +30C warm pool was in the Central Pacific in December 2023 than 1998 which lead to the record global temperature jump and warmth that winter. ONI and RONI values won’t always capture this.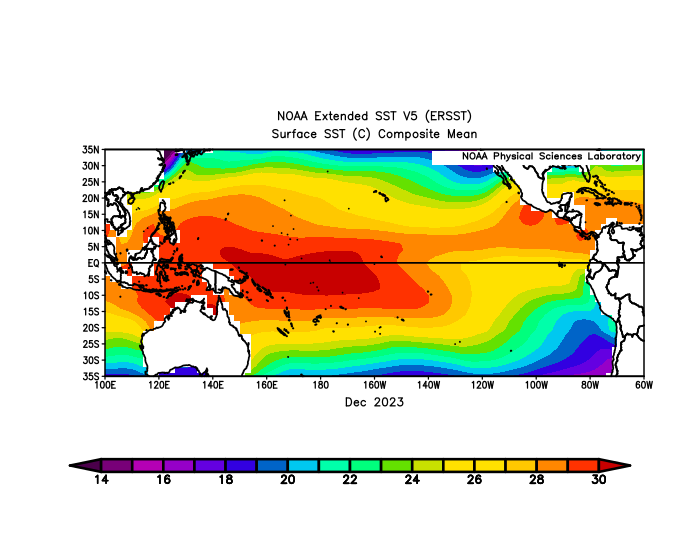
-
And 2013-2014 was near record setting or record setting for many in the Midwest and doesn't even make their top 10. it is a completely differently place up there.
-
was just thinking the same thing In fact, the heat just kicked on But watch in about 3 hours or so we'll see rapid breaks and temperatures will soar.
-
If we don't start seeing some sky-lights opening in this pan - dimensional shit show on morning satellite I may be inclined to take the under on machine guidance. MET/MAV are still 68-73, and it is early ... so we'll see. Incidentally ... both are 78 to 84 tomorrow and Wed along the BDL-FIT-ASH-MHT axis. actually, MET's 73 in NH on Wed.
-
QBO (30 mb) still has not updated for March! I don’t recall it ever taking nearly this long for any month, which has me a bit concerned: https://psl.noaa.gov/data/correlation/qbo.data
-

2026-2027 El Nino
michsnowfreak replied to Stormchaserchuck1's topic in Weather Forecasting and Discussion
Again, to be clear, im only doubting super at this point. It would be unheard of so close. Definitely a nino is coming. Super would not be fun, but we always get winter in the great lakes. Thats a great thing about living here. You're rescued in the worst case scenarios. Our climate is less feast/famine. One thing that im liking is the persistent of the eastern trough in recent years. -

Central PA Spring 2026 Discussion/Obs Thread
mahantango#1 replied to Voyager's topic in Upstate New York/Pennsylvania
I don't see any reason imo why you'd need it any warmer then that. It's April and it's not even remotely cold outside. I have my thermostat set at 63. On days like these I have to open up the windows when it gets above 63 so I can warm the house up. -
Central PA Spring 2026 Discussion/Obs Thread
pawatch replied to Voyager's topic in Upstate New York/Pennsylvania
54 degrees and it looks like a few rain showers today. JNS if the house is 61 you shouldn’t need the air for a few days. I got a split installed in my bedroom. Definitely was a good move.