All Activity
- Past hour
-
 I ran the numbers for 1995 and 1993 where summer mean temperature was weighted at 50% and where the remaining 50% weight was equally divided among the other three variables. In that case, 1993 tops 1995. 2010 remains at the top.
 -
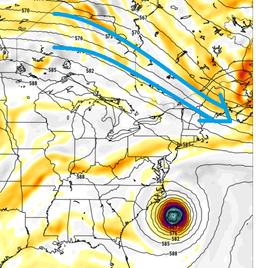
with this flow structure aloft? it would take more than God's will actually. This has been a stalwart consistent limitation for days and days and model run after model run, all but 100% ... all along, yet for some reason, some of you cannot seem to even see or sense the intuitive reason why it is impossible to bring a TC up to New England with polar jet drilling straight at the region. It's like believing fake news that it's possible for an ice cream cone to survive a fire hose I guess. We live in an era where scientific advice, let alone learning, are allowably suspended. It's not your fault.
-
Lol: The Trump administration’s claim that it is saving billions of dollars through DOGE-related cuts to federal contracts is drastically exaggerated, according to a new POLITICO analysis of public data and federal spending records. Through July, DOGE said it has saved taxpayers $52.8 billion by canceling contracts, but of the $32.7 billion in actual claimed contract savings that POLITICO could verify, DOGE’s savings over that period were closer to $1.4 billion. Despite the administration’s claims, not a single one of those 1.4 billion dollars will lower the federal deficit unless Congress steps in. Instead, the money has been returned to agencies mandated by law to spend it. DOGE’s savings calculations are based on faulty math. The group uses the maximum spending possible under each contract as its baseline — meaning all money an agency could spend in future fiscal years. That amount can far exceed what the government has actually committed to pay out. Counting this “ceiling value” gives a false picture of savings for taxpayers. “That's the equivalent of basically taking out a credit card with a $20,000 credit limit, canceling it and then saying, ‘I've just saved $20,000,’” said Jessica Tillipman, associate dean for government procurement law studies at George Washington University Law School. “Anything that’s been said publicly about [DOGE’s] savings is meaningless.”
-
That storm in northern Carroll Co is just not moving.
-
A pic of my COC

-
The humidity to rain ratio has been approaching infinity here lately.
-
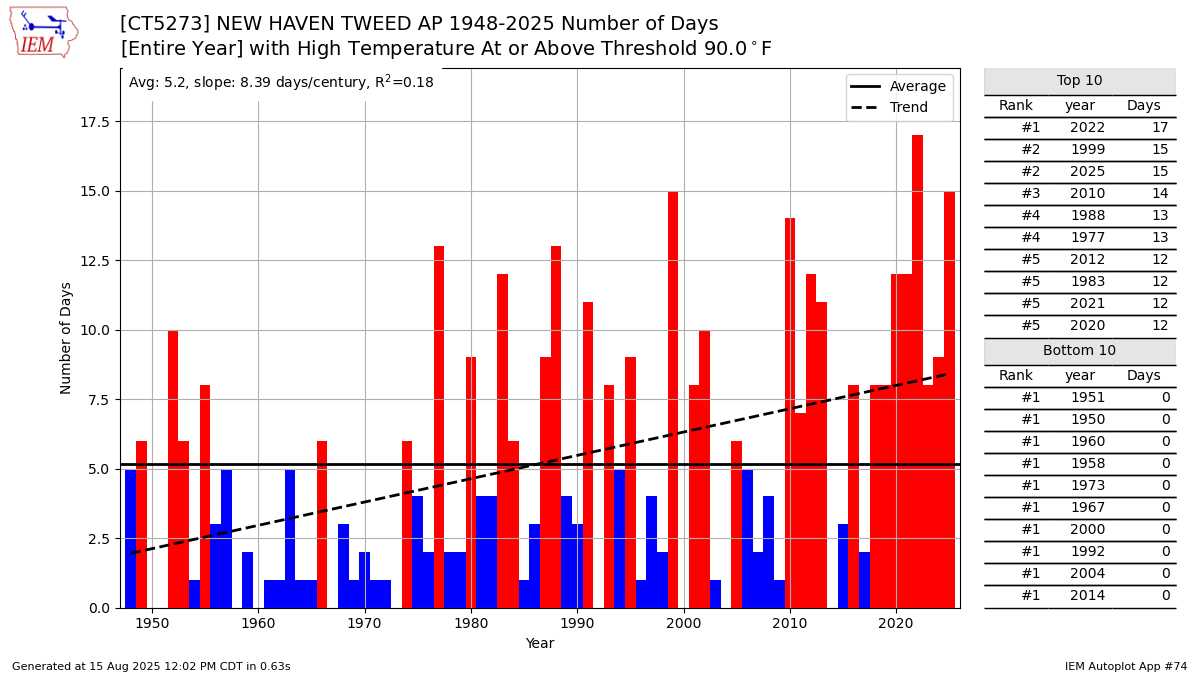
 Here on the CT Shoreline there has been a much steeper increase in 90° days than JFK. We are currently in 2nd place on the all-time 90° day list at 15 days so far reaching 90° or higher. This heat combined with the 5th driest summer so far has turned most of grassy areas brown. Was glad to get a brief shower yesterday. Time Series Summary for NEW HAVEN TWEED AP, CT Driest June 1st to August 14th Periods Click column heading to sort ascending, click again to sort descending. 1 2000-08-14 2.64 62 2 1957-08-14 2.77 0 3 1966-08-14 3.42 0 4 2017-08-14 3.50 3 5 2022-08-14 4.12 0 6 2025-08-14 4.18 0 7 1949-08-14 4.27 0 8 2016-08-14 4.82 0 9 1970-08-14 5.05 0 10 1965-08-14 5.09 0
-
 89/69/94 push push
 -
Can confirm. I’ve made that drive more times than I can remember and invariably the car is plastered in bugs. another hot day. Dp 70.
-
Looks like you're in the same boat as us, but Newfoundland is still close.
-
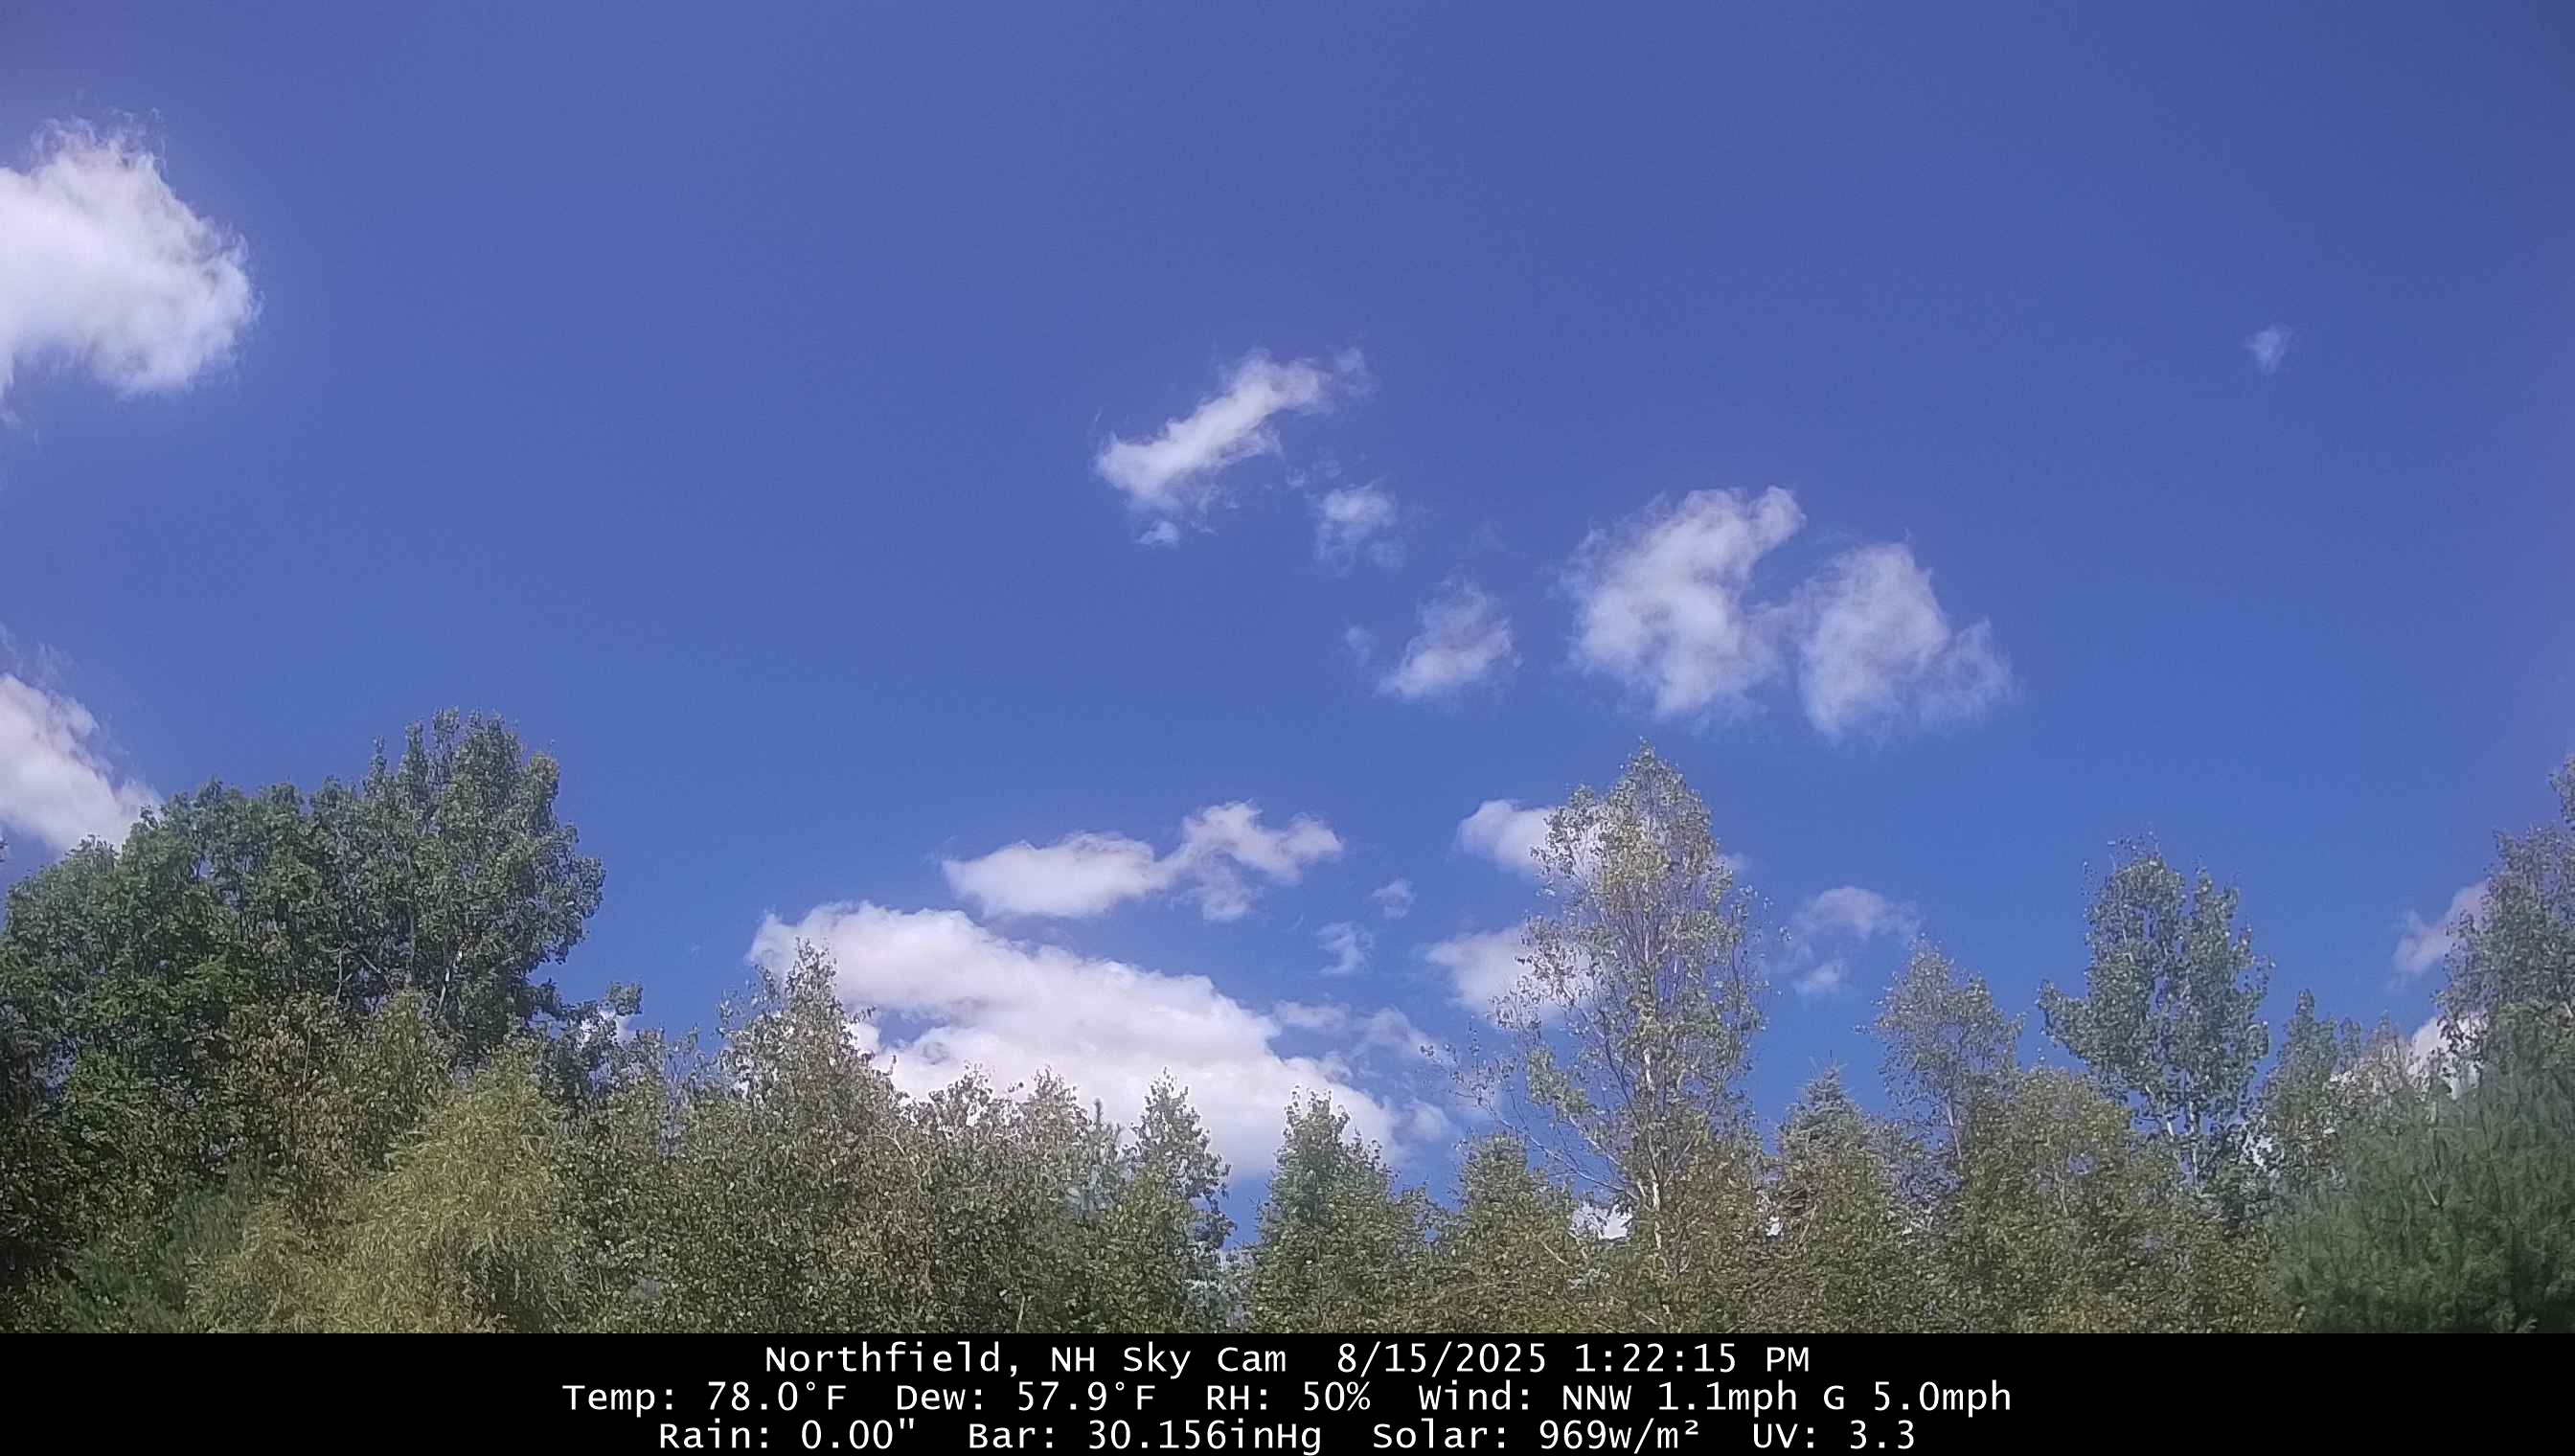
COC'd and loaded today, 76/57°F
-
Finally found a way to make a loop of SAL
-

2025 Atlantic Hurricane Season
WxWatcher007 replied to BarryStantonGBP's topic in Tropical Headquarters
There is a pretty good signal on the GEFS and EPS that the following wave will have a chance to develop in the central Atlantic, and a more modest signal that the wave train is probably going to be active for the next week or so--aided by the MJO and passage of the CCKW. Dry air and stability will remain hurdles waves need to overcome, but as we see each year, often times the lead wave (failed 96L or whatever it was) opens the door for the next one. It's unclear how much SAL will get back into the pathway, but look at how Erin cleared the way. -
 ah I see where the variance comes in... Don I think you should also weigh number of 95 degree days, number of 100 degree days and length of maximum heatwave. 1995 only had the one 102 degree day while 1993 had an absolutely incredible 100-101-102 three day stretch in the middle of a 10 day super heatwave lol.
 -
I'm always fond of TC's that make hairpin turns. We'll see if Erin does as advertised. I'm hoping it can get close enough to give us some rain. Desperately dry up here.
-
Here's the breakdown: 1993: Mean Temperature Z-Score: 1.653 Max Temperature Z-Score: 1.638 Min Temperature Z-Score: 0.813 Number of 90°F+ Days Z-Score: 3.025 Summer Score: 1.782 1995: Mean Temperature Z-Score: 1.451 Max Temperature Z-Score: 1.638 Min Temperature Z-Score: 2.366 Number of 90°F+ Days Z-Score: 1.908 Summer Score: 1.841 All variables are equally weighted. Personally, I wouldn't give equal weight to each variable e.g.., I'd place greater weight on the summer mean temperature.
-

Hurricane Erin - 75 mph - 996 mb - WNW @ 18
audioguy3107 replied to BarryStantonGBP's topic in Tropical Headquarters
There is a lot of keyboard yelling. -

Hurricane Erin - 75 mph - 996 mb - WNW @ 18
wthrmn654 replied to BarryStantonGBP's topic in Tropical Headquarters
I'm sorry but does anyone know what staton is saying 90%of the time? -
Unlike the 0Z, the 12Z UKMET is back (similar to yesterday’s 12Z that I’m quoting) with a followup AEW to Erin becoming a TD at 162 and nearly to a TS at 168 just N of the Virgin Islands moving WNW. This looks like the same AEW that the 12Z GFS has but is ~500 miles further WNW than the GFS at 168, which is then only near 16N, 58W. This is the AEW causing the commotion in the SE US on the 6Z GEFS during 8/26-30: NEW TROPICAL CYCLONE FORECAST TO DEVELOP AFTER 162 HOURS FORECAST POSITION AT T+162 : 18.9N 62.8W LEAD CENTRAL MAXIMUM WIND VERIFYING TIME TIME POSITION PRESSURE (MB) SPEED (KNOTS) -------------- ---- -------- ------------- ------------- 1200UTC 22.08.2025 168 19.4N 64.7W 1005 33
-
Except Fiona! What a great chase that was.
-
Chronic ones at that. I’m sure it will be 80/60 on Halloween though.
-
With that HP there?
-

Occasional Thoughts on Climate Change
Typhoon Tip replied to donsutherland1's topic in Climate Change
I also add to it... It's meteorological/anecdotal so the exact worth, be that as it may, but I've been observing over the last two decades what appears to be a positive/harmonic environmental/geological feed back mechanism that begins to physically exert ( non-linearity) a retrograding force wrt to the summer ridge positioning. When episodic continental, mid-latitude ridging balloons, it's not given a chance to get to non-Markovian ("quantom memory" favoring future states) aspects, because no sooner...within just shorter days it's already attempting to slip back W-SW under the jet and PHX steals the heat show. So what is the environmental/geological factor: As the western hemispheric winds begin to absorb the backward exertion of the flow, due to western N/A cordillera topography, the C-force turns the air motion right while it is being forced to ascend over said topography. This generates a standing wave ridge like construct, which then couples/constructively interferes with the continental summer heat. Once set up, the thermal wind component than combines with C-force ... bending right, which further genesis' the anticyclonic field at large scales; the whole system tries to all but isolate itself because these factors fantastically compliment one another. Harmonic feedback. This is a synergistic for both heat result, but also en masse physically enhances drying. Because of all this, some years we end up with these "weakness" in the longer-termed geopotential layout E of 100W across the mid latitude continent. This ends up with murky humid daily downpour thunder over eastern America, with big heat in the west... Once or twice, a pattern break sufficiently strong enough may temporarily overcome these background aspects, and threaten to lower Pac N/W heights... -D(PNA) then dislodging the kinetically charged air from the SW ... but, the background tends to overwhelm and yank it back - so to speak. This year we've seen more -EPO/-PNA tandem than the last 5 years. We've also seen more >95 F days at climo sites spanning the OV/NE regions, too. But these murk years are not necessarily cooler years for the OV/NE regions. Nocturnal temperatures are often held up well above normal, such that the total dailies still average comparably large. But we're not talking us... haha Yeah, so there's some additional feedback that tries to sustain aridification that may not be specifically related to cold water along/off the West Coast, too. -
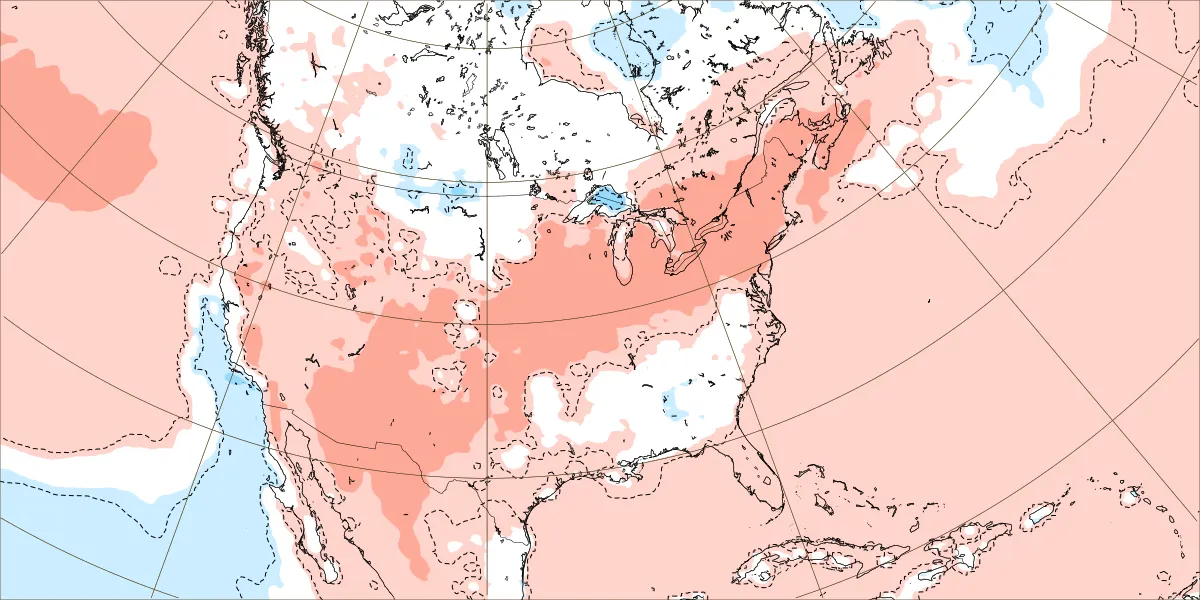
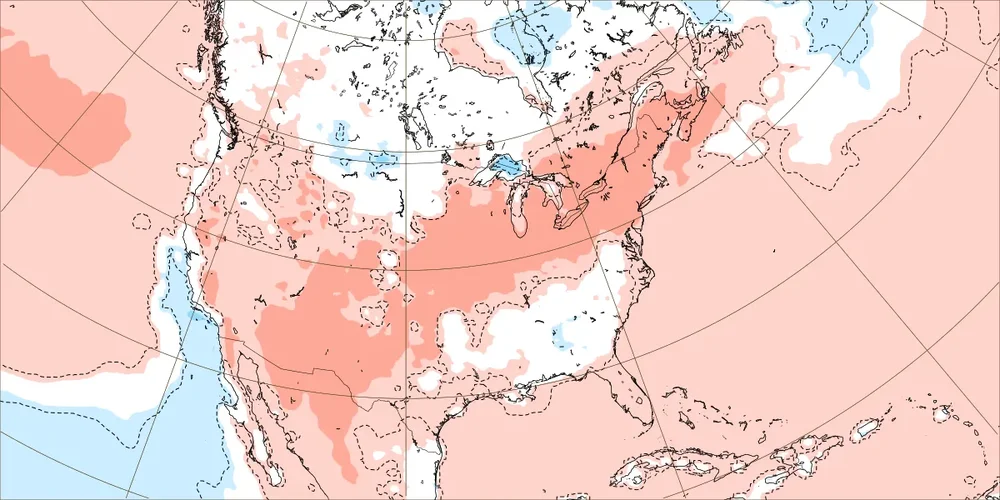
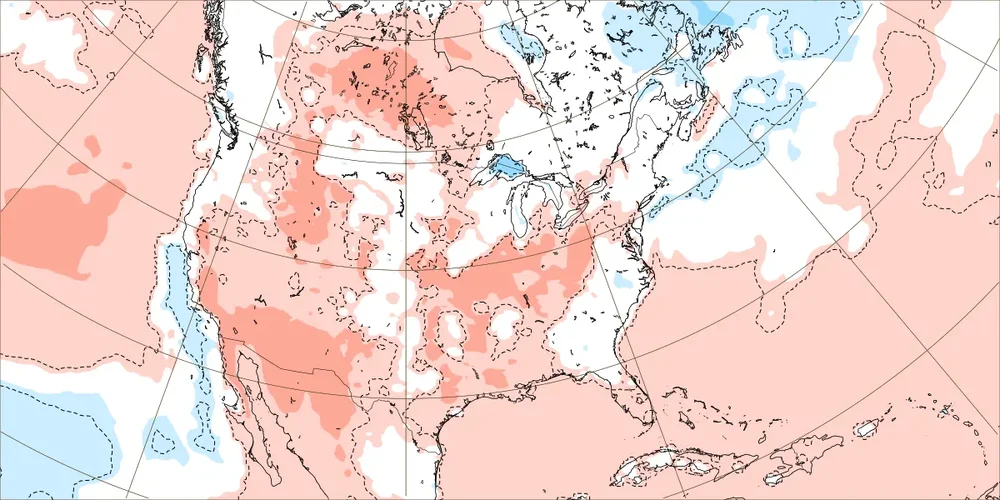
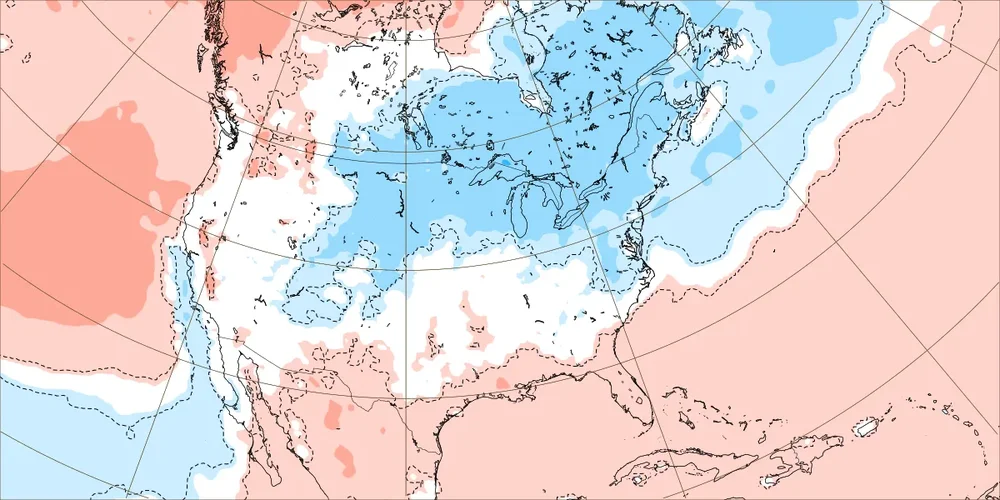
Interesting change of events on the weeklies for the last week of August starting on the 25th. Top map is from the 8/3 run, middle map is from last Friday, the 8th, and the bottom map is from yesterday. Could be fun if this kind of trend continues thru winter on the weeklies...or suck (for some) if it goes the other way.
-
is the rise also slower for SNE (like places in CT near the shoreline) Chris? I was amazed that Bridgeport had a higher temperature than JFK the other day, I thought they were more vulnerable to the sea breeze there. When do you think 100 degree temperatures at JFK might start to happen more often, like they did in the 1940s and 1950s up to 1966 Chris?