All Activity
- Past hour
-
Around here 10 per minute is a lot. My only experience with anything close to the above came July 15 years ago at DEC. The storm was 6-8 miles to our south and the flashes were essentially uncountable - at least 100 per minute. Thanks to frequency and distance, the thunder was a constant drum roll. Had a brief (10 minutes with most of the 0.16" in the first 2) but noisy TS arrive at 5 last afternoon. That makes 6 days with thunder this month, one more than all of last year. (Annual average is 15.)
-
Wow day 1: Wednesday ... NAM's new grid numbers from 12z for BOS, 18z 54000574750 -0493 10 26 09 80 32 24 18 60000655534 -0493 112612 80302518 32 C is 980 mb at Logan's sigma, which given a sfc pressure is closer to 1015 or so, the actual sfc 2-m is probably closer to 37 C ( (72 - 7.2) + 32 = 96.x not bad considering this conceptually/validly results higher than the machine MET for couple of cycles now. Haven't seen the 12z MET but we'll see. In the past the MOS has been too cool when that's observed. 850 mb T ~ 21 or 22C here ( 24+18) = 41/2 assuming equal mixing but I suspect the slope above 24 C but it's probably expanding through the mid point so it's likely closer to 22 or so at 850. This appears to match the objective guidance illustration ... If so, +22C adiabat supports ~ 36 C 1000 mb T, so as another means to infer the surface ...that doesn't include the 2 C slope to the right during high proficiency heat - which this NAM run's definitely going to be on that day, given those RH field are all 50% or less. Anyway, the NAM's 32 at 980 mb could actually be a tick cool (wrong) in this quasi synergistic potential/holistic synopsis. Bottom line is top heavy with temp on this new run. The 26 conceptually means '260 degrees' ..which pertains to the wind direction - in this case at 2pm. It's blowing straight out of Boston urban anus right at Logan, and right around fart velocity of that 9 kts. So if actually getting that particular completely idiot to civility location to be a temperature that represents what it's like walking down Cambridge Ave to the Fens, that's about as good an opportunity as you'll find.
-

Fireworks Heat Contest W 7/1 - S 7/4 for Five MA Airports
MillvilleWx replied to nw baltimore wx's topic in Mid Atlantic
DCA: 97, 100, 99, 98 BWI: 99, 102, 100, 99 IAD: 97, 101, 99, 98 SBY: 98, 102, 99, 98 RIC: 99, 102, 101, 98 Total Rain: 0.31 -

2026-2027 Super El Nino
snowman19 replied to Stormchaserchuck1's topic in Weather Forecasting and Discussion
So far the CFS (relative) is the only model showing the extremely rapid drop. That said, once DT and JB see that, they will be all over it like white on rice. EVERY El Nino weakens dramatically as we go through Winter. And this one is forecast to remain strong through Feb or March, no different than the last 2 super El Nino's (1997-1998, 2015-2016). Plus it’s the atmospheric response to the Nino 3.4 anomaly that matters. Just using 1997-98 and 2015-16 as the most recent super El Niño examples…both peaked the last week of November, both rapidly weakened throughout the winter (with the most rapid weakening occurring from Jan-Mar). 2015-16 was a start to finish +QBO winter, like this one is expected to be, 1997-98 started as a +QBO in 1997, then transitioned to a -QBO. DT and JB both argued that the rapid weakening in 2016 was going to result in some miracle winter comeback in the east. I remember January of 2016 vividly. They were screaming to the heavens that the El Niño was rapidly falling apart, the easterlies and trade winds were coming back with a vengeance and that the east was going to turn into an arctic cold tundra with KU’s crippling the I-95 corridor in February and March. We all know how that worked out….they utterly embarrassed themselves. I had to do some research for the 1997-98 winter (DT wasn’t around back then), but I was able to find it. JB was still at Accuweather at the time and he argued the same thing he did in 2016. He was warning people in the east in January ‘98 not to “write off winter yet” and was hyping that there was going to be some miracle winter comeback in February and March because of the rapid weakening of the El Niño and the transition to a -QBO, which he said was going to result in high latitude blocking and a turn to arctic cold and big snowstorms up the east coast. Another epic fail -
Spot on. I worked as a laborer for a construction company in the summer while going to college. Trucks did not have air con. Once you get drenched in sweat there's not much more stink you can pile on. Baled hay too. Helped my brother in Ohio last week move, stack and restack nearly 200 bales. It's one thing when you are young and skinny and can dissipate heat well. It's another when you're in your mid-60's, fat, and out of shape (haha). I feel for the people who HAVE to be out in the heat because it's their work/profession. Those who choose to be in the heat out of their own preference have the luxury to quit when they want. This week is going to put a load on the electrical grid to keep up.
-
81/75 at 10 am is soupy af.
-
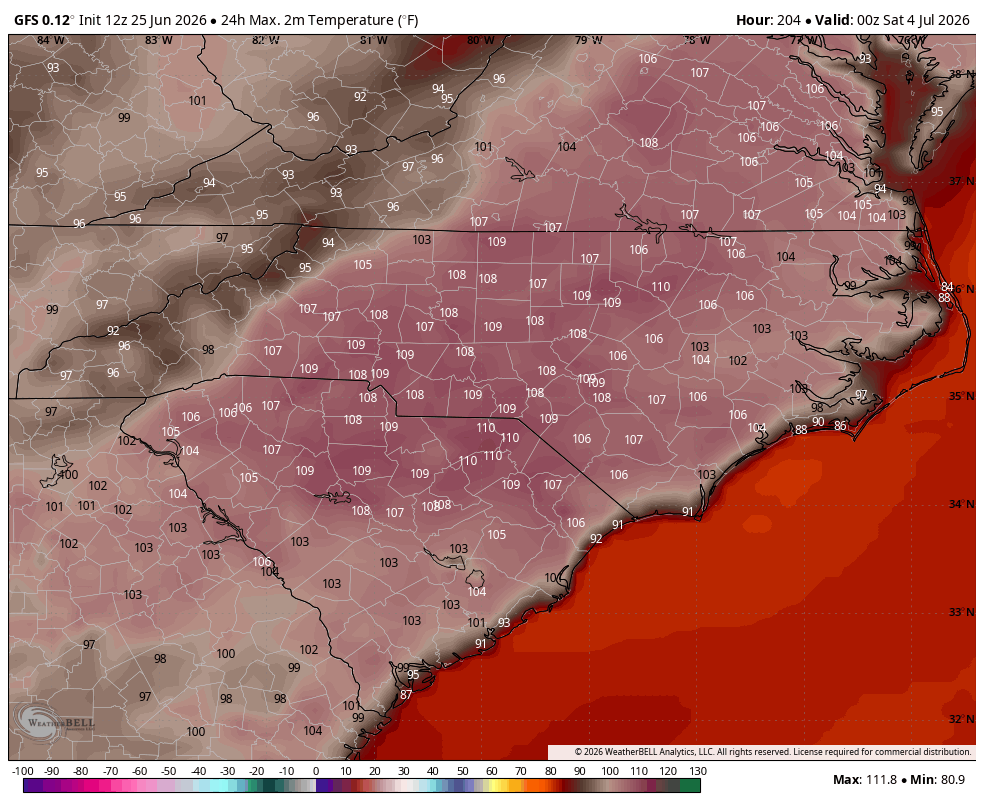
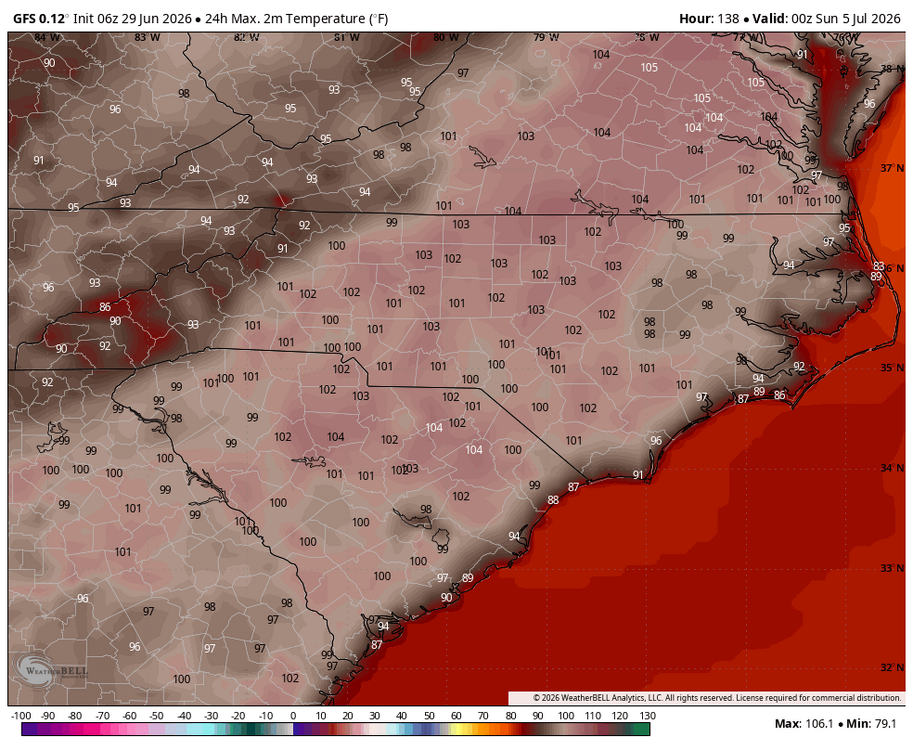
Bump to show that once again the GFS looks like it is going to end up quite a bit too hot: Here is an apples to apples comparison with 24 hour highs on the GFS runs of 12Z 6/25 vs 6Z 6/29: still miserable and dangerous for sure but most of Carolinas are 5-9F less hot! This is a common bias of the GFS in summer in the SE US on mainly sunny days. 12Z 6/25 GFS 24 hour max ending 0Z 7/5: 6Z 6/29 GFS 24 hour max ending 0Z 7/5:

-
-
We'll probably still get them - "Sunny and 88°, again"
-
-
Absolutely ridiculous. So extra heat is being added from something that isn't established yet and is only in the developing states?
-
No surprise-those earlier numbers were crazy.
-
Correct, I should have been a bit more clear with this aspect
-
oh, I see. well, that's not like diurnal convection tho. that's what I was getting at. I guess an organized linear complex riding down is bit of a different beta synoptic drive so maybe that.
-
Gee I hope our heat dome isn't super charged.
-
was looking at vorticity rolling through/shear/instability...but mostly focusing on the shortwave rolling through as the driver for anything. If that shortwave is nothing or relatively weak then yeah we won't see much of anything
-
Ha. there are none. That's the point. Height are rising. what else are you looking at? SPC?
-
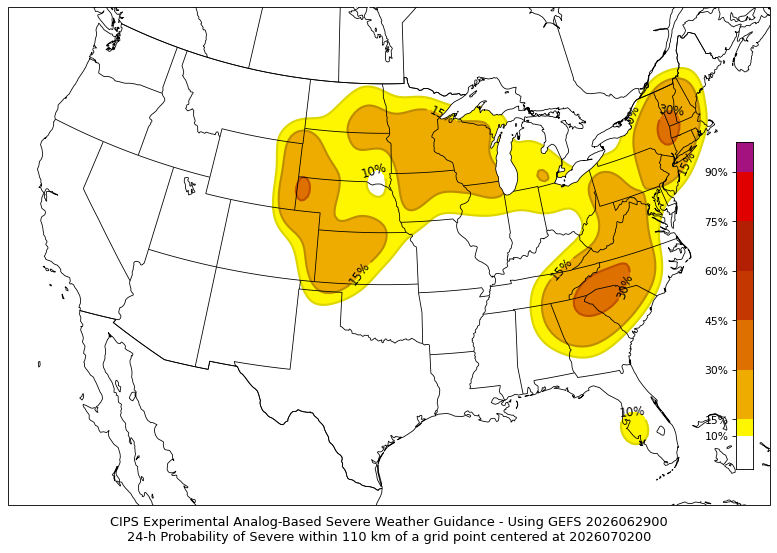
Actually I kind of like where that has the 30% area for D3. Looks like the instability gradient (talking about gradient between moderate and extreme instability) may be eastern NY into western New England. Something to watch because any development, particularly any cluster or complex, is going to ride that
-
Looks like the hottest days will occur as the ridge shifts into a position that will place our region in a westerly/downsloping flow. That should mean lowering dewpoints in the afternoon, which of course allows for more efficient heating. That's probably the rationale for rural areas (like my location) having forecast highs over 100. Typically the higher dewpoints inhibit that. Still don't buy 104 here.
-
Be honest, you triple checked one of the words in this post before you hit Submit, didn't you?
-
Not bad for a D3
-
Shwrs/stms have been developing regularly around the Lake this morning. Nice to see some decent rain.
-
If we hit 100, I will watch Superman IV. Twice.
-
June 29 1969: Worthington picks up over 6 inches of rain in 24 hours. 1930: Extreme heat develops in Minnesota. Canby got up to a sizzling 110 degrees. For Monday, June 29, 2026 1931 - The temperature at Monticello FL hit 109 degrees to establish an all-time record for the state. (The Weather Channel) 1954 - Hurricane Alice dumped as much as 27 inches of rain on the Lower Rio Grande Valley of Texas. The Rio Grande River at Laredo reached a level 12.6 feet above its previous highest mark, and the roadway of the U.S. 90 bridge was thirty feet below the high water. (David Ludlum) 1987 - Thunderstorms produced severe weather in the Ohio Valley and the Great Lakes Region, with reports of large hail and damaging winds most numerous in Ohio, Indiana and Michigan. Thunderstorms spawned four tornadoes in Michigan. A tornado near Clare MI was accompanied by softball size hail. In Colorado, an untimely winter-like storm blanketed Mount Evans with six inches of snow. (The National Weather Summary) (Storm Data) 1988 - Alpena, MI, reported a record low of 39 degrees while Jackson, MS, equalled their record for the month of June with an afternoon high of 105 degrees. Thunderstorms in the central U.S. soaked Springfield MO with 3.62 inches of rain, a record for the date. (The National Weather Summary) 1989 - Thunderstorms produced severe weather in the Southern and Central High Plains Region. Thunderstorms in Colorado produced softball size hail at Kit Carson, while pea to marble size hail caused ten million dollars damage to crops in Philips County, CO. (The National Weather Summary) (Storm Data) Observances: 29 Mon National Camera Day 29 Mon Hug Holiday 29 Mon Please Take My Children To Work Day 29 Mon International Mud Day 29 Mon Feast Day of Saints Peter and Paul 29 Mon International Day of the Tropics 29 Mon National Bacon Burnt End Day 29 Mon National Dieselbilly Day 29 Mon National Guy Day 29 Mon National Waffle Iron Day 29 Mon Outdoor Equipment Maintenance Day 29 Mon San Francisco's Birthday 29 Mon The Feast of Saints Peter and Paul 29 Mon Internal Autonomy Day 29 Mon International Fisherman Day 29 Mon St Peter's Day 29 Mon National Almond Buttercrunch Day
-

2026-2027 Super El Nino
GaWx replied to Stormchaserchuck1's topic in Weather Forecasting and Discussion
This is again indicative of a not nearly as E based El Niño as 1997-8 with the slope from E to W not nearly as steep.