All Activity
- Past hour
-

2025-2026 ENSO
donsutherland1 replied to 40/70 Benchmark's topic in Weather Forecasting and Discussion
Unfortunately, the paper doesn't mention the statistical threshold that was used to determine a statistically significant relationship. I suspect that it's far less than a 90% or 95% threshold. Based on the outcomes you posted, which is very mixed, I don't think ACE is a useful predictor. Anecdotally, it may seem to hold some value, but not on a consistent or rigorous basis. -

September 2025 OBS-Discussion centered NYC subforum
bluewave replied to wdrag's topic in New York City Metro
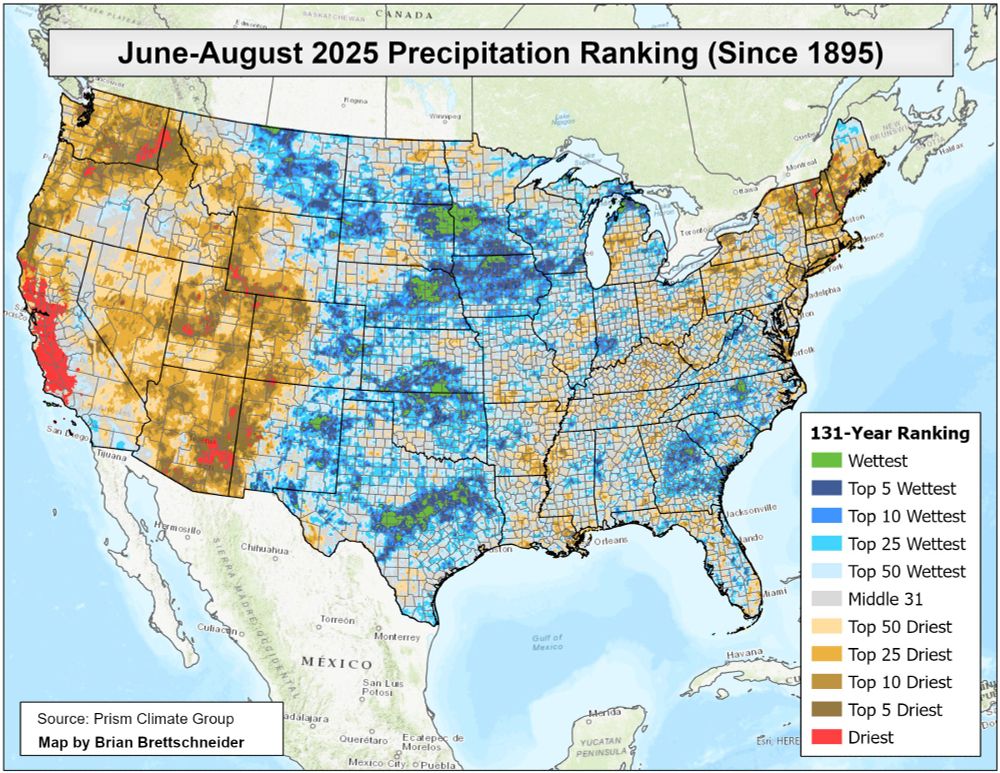
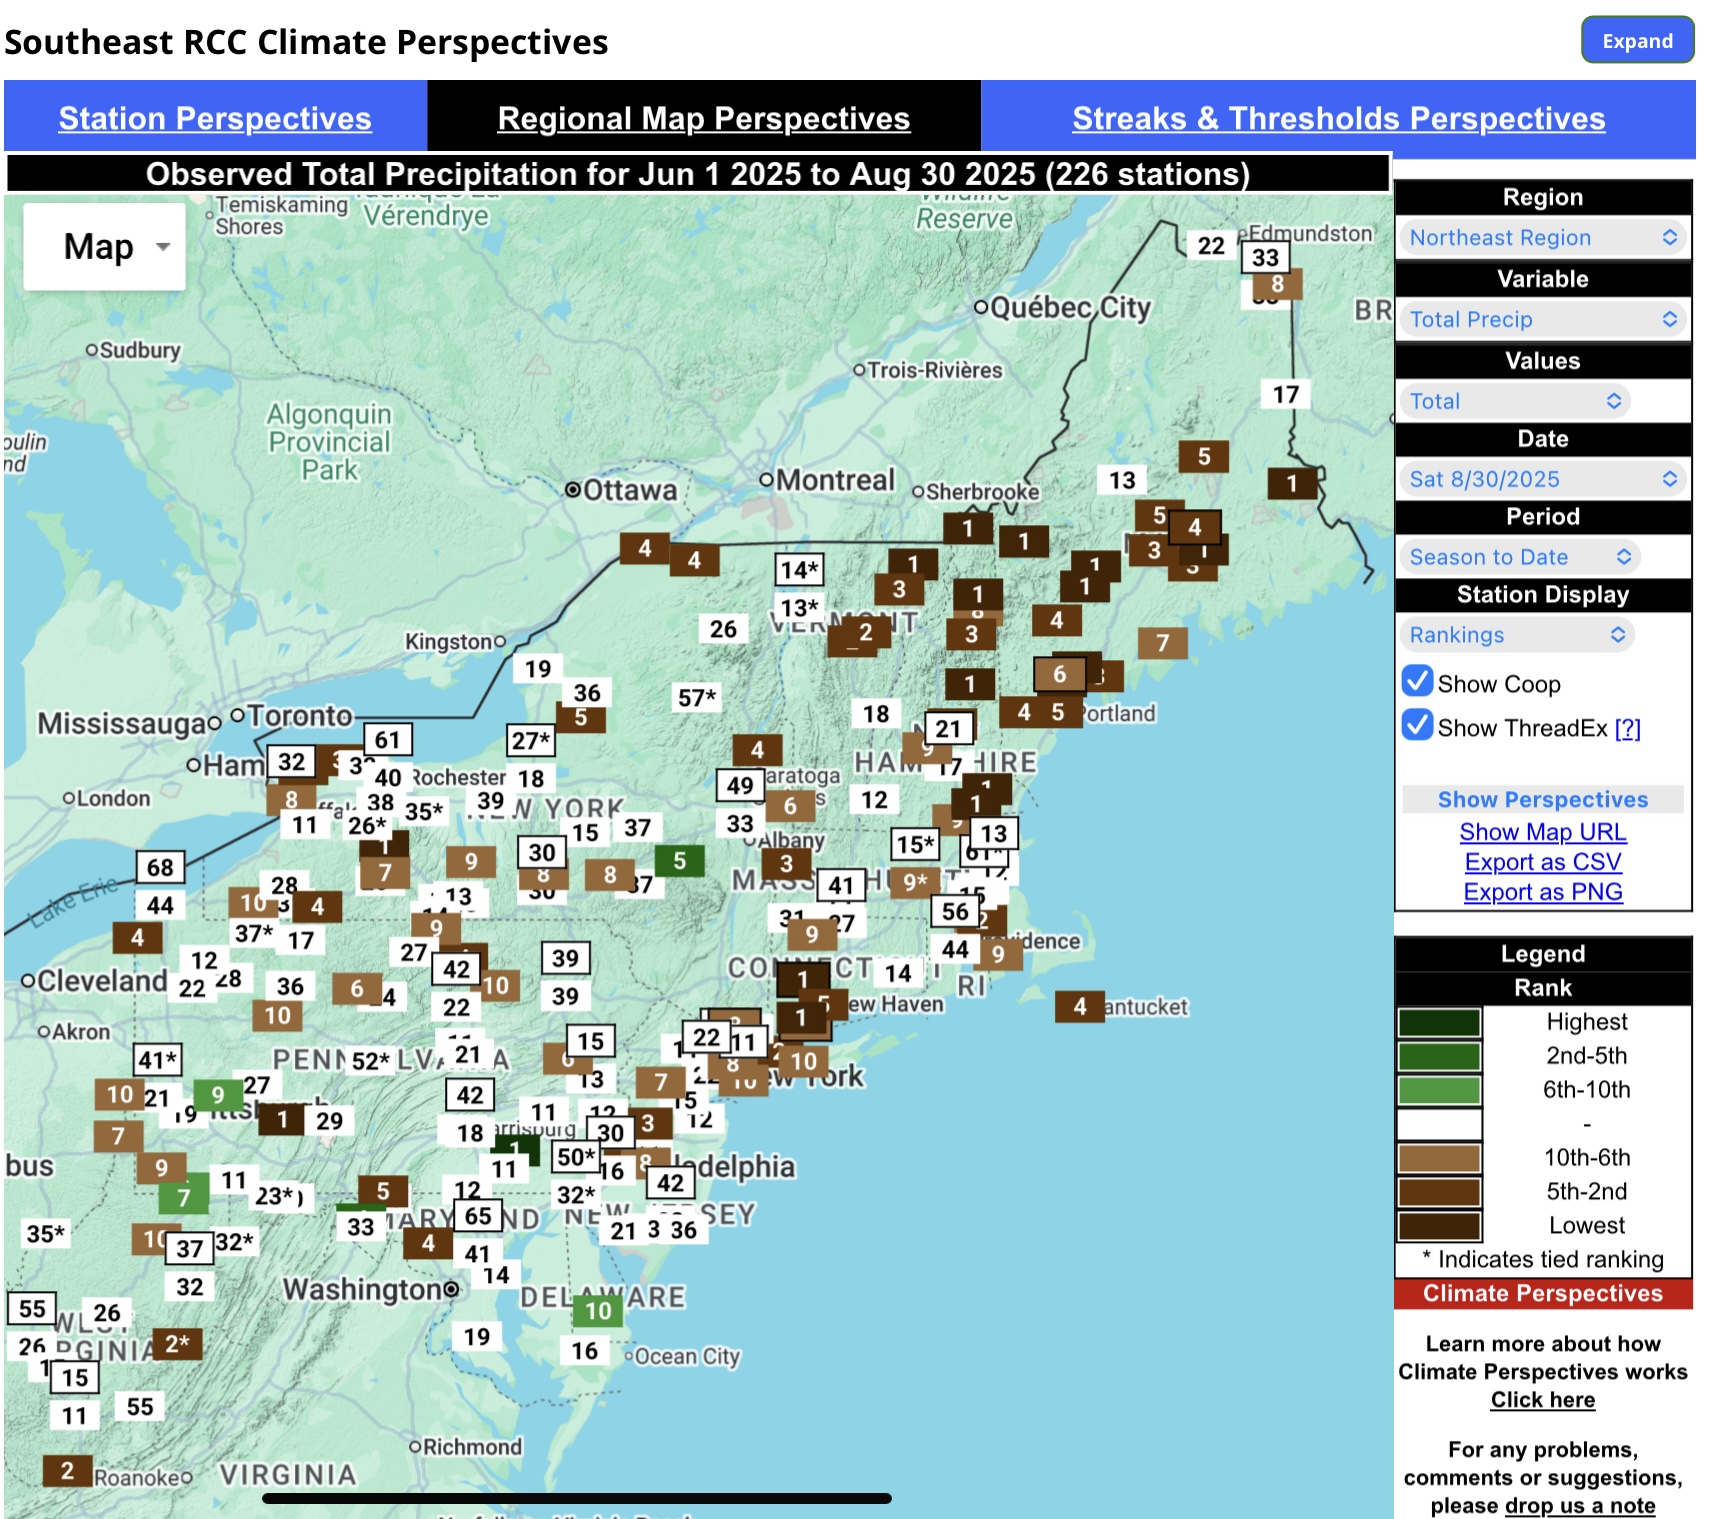
Yeah, numerous top 10 driest summer reports in the Northeast.

-
 As I said, watch there be 100-degree heat at this time next year. It hasn't happened since 1953, and we are way overdue for this. Fall set in early last year as well. It can't possibly happen 3 years in a row. It's been here for a while. The pattern changed around August 1. Aside from the heatwave from about the 12th-17th, it's been fall-like for the most part. Summer is likely not coming back until next year, unless we get that odd temperature spike (like Oct. 2, 2019).
 -

September 2025 OBS-Discussion centered NYC subforum
SACRUS replied to wdrag's topic in New York City Metro
Records: Highs: EWR: 98 (2010) NYC: 97 (1953) LGA: 96 (2010) JFK: 92 (2012) Lows: EWR: 50 (1934) NYC: 51 (1869) LGA: 55 (1967) JFK: 54 (1985) Historical: 1859: One of the largest geomagnetic storms on record occurred on this day in 1859. 1862: The Battle of Ox Hill (or Chantilly) is also known as the only major Civil War battle to have been fought during a storm. “A severe thunderstorm erupted, resulting in limited visibility and an increased dependence on the bayonet, as the rain soaked the ammunition of the infantry and made it useless.” From Taylor, Paul. He Hath Loosed the Fateful Lightning: The Battle of Ox Hill (Chantilly), September 1, 1862. 1869: Cleveland Abbe issued the first Weather Bulletin for the city of Cincinnati, Ohio. It contained a few observations telegraphed from distant observers and the “probabilities” for the next day. The bulletin was written by hand. 1894 - A forest fire driven by high winds burned down the town of Hinkley, MN, killing 418 persons. (David Ludlum) 1894: The Great Hinckley Fire, which burned an area of at least 200,000 acres or perhaps more than 250,000 acres including the town of Hinckley, Minnesota occurred on this day. The official death count was 418 though the actual number of fatalities was likely higher. 1897 - Hailstone drifts six feet deep were reported in Washington County, IA. (The Weather Channel) 1914 - The town of Bloomington, MI, was deluged with 9.78 inches of rain in 24 hours to establish a state record. (31st-1st) (The Weather Channel) 1928: Leslie Gray from the Weather Bureau in San Franciso was the first weather forecaster to be deployed to a wildfire. 1935: The 1935 Labor Day Hurricane began intensifying from a tropical storm early in the day to a Category 2 by the end of this day. Over the next 24 hours the cyclone would go through "bombogenesis" intensifying to a Category 5 storm with maximum sustained winds estimated at 160 mph with gusts exceeding 200 mph. This was the first Category 5 storm to hit the U.S. The records aren't good enough to say whether any earlier storms that hit the USA would be Category 5 by today's standards. (Ref. Jack Williams, USA Today.com) 1939: Lightning hit and killed 837 sheep bedded down for the night on top of Pine Canyon in Northwestern Utah. Both the sheep and the earth were wet from the passing thunderstorm, causing the lightning's electrical discharge to move completely through the herd. The sheepherder was in a tent, was knocked temporary unconscious but escaped death. (Ref. National Weather Service in Utah Lightning Information) 1950: Palm Springs, CA set their all-time September high temperature record with 121°. Other daily record highs included: Yuma, AZ: 123°, Phoenix, AZ: 116°, Las Vegas, NV: 113°, Sacramento, CA: 108°, Tucson, AZ: 107°, Stockton, CA: 105°, Bishop, CA: 104°, Winnemucca, NV: 101°, Winslow, AZ: 99°, Reno, NV: 99°, Elko, NV: 97° and Ely, NV: 93°. (Ref. Wilson Wx. History) 1952: A cold front brought damaging winds to Fort Worth, Texas, including the Carswell Air Force Base where thirty-five B-36 planes received damage. The anemometer indicated 90 mph winds before being smashed by debris. 1953: A heat wave that began in late August continued into early September continued across parts of the Midwest. Platteville, WI & South Bend, IN recorded their hottest September temperatures with 100° and 99° respectively. Fort Wayne, IN & Muskegon, MI tied their all-time September high temperature record with 100° & 95°. Other daily record highs included: Goshen, IN: 101°, Grand Rapids, MI: 97°, Lansing, MI: 96°. (Ref. Wilson Wx. History) 1955 - The temperature at Los Angeles, CA, soared to an all-time high of 110 degrees during an eight day string of 100 degree weather. (David Ludlum) 1961: An F4 tornado traveled through parts of Butler and Bremer Counties in Iowa. Unfortunately, there is limited information in the Storm Data entry about this event. Per Thomas Grazulis in Significant Tornadoes, the tornado began NW of Dumont and ended NE of Horton. Several farms along the path were "leveled". It was reported at one farm that fruit jars were "sucked out of the basement" after the house was swept away. There were 7 injuries reported with this event and zero fatalities. 1974: Lt. Judy Neuffer became the first female to fly a Hurricane Hunter aircraft through the eye of a hurricane. 1979 - A home in Centerville TN was hit by lightning and totally destroyed. It marked the third time that the house had been hit by lightning since being built in 1970. (The Weather Channel) 1983: Record heat gripped parts of the northern Rockies. Several locations recorded record highs for September including: Miles City, MT: 106°, Billings, MT: 103° and Sheridan, WY: 103°. At Billings, it was the 8th consecutive day with high temperatures above 90°. (Ref. Wilson Wx. History) 1985: Erratic Hurricane Elena baffled forecasters and Gulf Coast residents on the Sunday before Labor Day. The Hurricane had threatened the central Gulf Coast on Friday, only to turn east and spend Saturday menacing the Tampa Bay area with high winds, tides and heavy rains. By lunchtime Sunday, Elena was on the move again, but this time back to the west. The storm reached its minimum pressure of 951 millibars or 28.08 inches of mercury while the storm was 75 miles south of Apalachicola, FL. Elena's maximum reported coastal winds were over Dauphin Island, AL, where sustained winds of 105 mph with gusts to 135 mph were reported. Other maximum gusts reported ranged from 120 mph at Gulfport, MS, to 92 mph at Pensacola, FL. Maximum tides of 10 feet above normal were recorded at Apalachicola, FL, with reports of 6 to 8 feet above normal on Dauphin Island, AL. Approximately 1 million people were evacuated from low lying coastal areas during Elena’s approach. This large evacuation contributed to the fact that there were no deaths in the area of landfall. The four deaths which occurred resulted from falling trees and automobile accidents. One resident died of a heart attack. Total damage ranged from $1 to $1.5 billion dollars.(David Ludlum) (Ref. AccWeather Weather History) 1987 - Cool Canadian air invaded the Midwest. Six cities reported record low temperatures for the date, including Indianapolis IN with a reading of 44 degrees. Hot weather continued in the northwestern U.S. Five cities reported record high temperatures for the date, including Hanover WA, where the mercury soared to 106 degrees. (The National Weather Summary) 1988 - Thunderstorms produced heavy rain in the Upper Mississippi Valley. Ely, MN, was drenched with three inches of rain in two hours, and pelted with one inch hail. The heavy rain flooded streets and basements, and the high water pressure which resulted blew the covers off manholes. (The National Weather Summary)(Storm Data) 1989 - Thunderstorms developing ahead of a cold front produced severe weather in Oklahoma during the late afternoon and evening hours. Thunderstorms produced hail two inches in diameter west of Arapahoe, and wind gusts to 70 mph at Luther and south of Harrah. Early morning thunderstorms over Indiana drenched Kokomo with five to eight inches of rain, and spawned a tornado which injured three persons at Bruce Lake. (The National Weather Summary) (Storm Data) 1999: Erratic Dennis was downgraded to a Tropical Storm as he drifted aimlessly just off Cape Hatteras, NC. Dennis would move southward, then northwestward before making landfall on the 4th with winds of 70 mph. Dennis' heavy rains would set the stage for massive flooding when Hurricane Floyd arrived a few weeks later. (Ref. Wilson Wx. History) 2002: Across southern California, a heat wave sent temperatures soaring to 118° at Dulzura, 113° at Temecula, and 112° at Riverside and Menifee. Temperature gradients were remarkable near the coast. It was 77° at Newport Beach and 107° in Santa Ana, only ten miles difference, 72° in Oceanside Harbor and 87° in Oceanside Airport, only two miles difference, 81° in Sea World to 91° in San Diego - Lindbergh Field, only three miles difference. (Ref. Wilson Wx. History) 2003: By midnight, Indianapolis, IN recorded its wettest day on record with 7.20 inches. (Ref. Wilson Wx. History) 2008: Hurricane Gustav was the second most destructive hurricane of the 2008 Atlantic hurricane season. The storm was the seventh tropical cyclone, third hurricane, and second major hurricane of the season. Gustav caused serious damage and casualties in Haiti, the Dominican Republic, Jamaica, the Cayman Islands, Cuba and the United States. Gustav caused at least $6.6 billion (2008 USD) in damages. Gustav triggered the largest evacuation in United States history up to 2008. Once into the Gulf, Gustav gradually weakened because of increased wind shear and dry air. It weakened to a Category 2 hurricane late on August 31, and remained at that intensity until landfall on the morning of September 1 near Cocodrie, Louisiana. In total, an estimated 153 deaths had been attributed to Gustav in the U.S. and Caribbean. 2017: The temperature at Downtown San Francsico reached 106° setting their all-time record high. The previous record was 103° on June 14th, 2000. -
I would use many words to describe @sauss06, "idiot" is not one of them
-
The GFS seems to think we get a pretty good soaking Thursday and Friday. Looks like an inch for everyone west of the bay and about half of that eaat of the bay. It doesn't look that dry over the next 10 days.
-
You miss the point . You don’t want a torch pattern going into autumn which is exactly what looks like is happening . This last week was probably the coolest weather until sometime later in October . Once the troughs and cool stop next week. It’s gone
-

September 2025 OBS-Discussion centered NYC subforum
qg_omega replied to wdrag's topic in New York City Metro
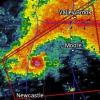
Lots of clouds from offshore storm -
September 2025 OBS-Discussion centered NYC subforum
SACRUS replied to wdrag's topic in New York City Metro
78 / 52 onshore flow another great day should touch 80 / 81. Overall dry continues till Thu then showers / storms possible, more humid SW flow. Overall warmer between the 4 - 11th. -
Now I’ll look at the opposite end: NAO>+1 DJF 1980-1 through 2015-6 1988-9, 1993-4, 1994-5, 1999-00, 2011-2, 2014-5, and 2015-6 1. 1988: -1 H hit (NN): no signal -ACE ~12 (far BN): doesn’t work (major fail) 1993: -1 H hit (NN): no signal -ACE ~33 (BN): doesn’t work 1994: -0 H hits (BN): doesn’t work -ACE ~12 (far BN): doesn’t work (major fail) 1999: -1 H hit (NN): no signal -ACE ~66 (slightly AN): works 2011: -1 H hit (NN): no signal -ACE ~71 (AN): works 2014: -1 H hit (NN): no signal -ACE 21.2 (BN): doesn’t work 2015: -0 H hits (BN): doesn’t work -ACE 26.4 (BN): doesn’t work —————————— Summary for the seven +1+ NAO winters 1980-1 through 2015-6 -# of US H hits through 9/10: no signal 5 times, didn’t work twice, and worked zero times -ACE through 9/10: worked twice and didn’t work five times including two major fails Summary: the seven +1+ NAO cases overall failed to support their theory and actually, if anything, supported the opposite! @donsutherland1@40/70 Benchmark Edit: If I include only the 3 neutral ENSO summers (JAS) (1993, 1994, 2014), that doesn’t help and even makes it worse because none worked for ACE (including one major fail). The one with a signal for # of US H hits didn’t work.
-
I see. I guess el ninos are typically more boom or bust, with one or two huge storms making the whole season. Just need to time that active subtropical jet with one good cold shot.
-
 DCA _ NYC _ BOS ___ ORD _ ATL _ IAH ___ DEN _ PHX _ SEA -.3 0 +.2 +.3 -.5 -.5 +1.2 +1.4 +1.3 Sorry late by a few hours again
 -
There aren’t enough antibiotics in the world to get me to touch that water ha
-
El Ninos don’t follow the pattern as closely. Some El Niños with weak snowfall starts like 23-24 follow up with below average snowfall. But some years like 15-16 with a T of snow in December did very well for the whole season.
-
Take it FWIW, but If (IF) this is correct, pray for a -EPO winter again
-
I can see that for ninas. If you dont get a good December even in a nina you're cooked. But what about ninos?
- Today
-
My guess is that it’s related to La Niña winters typically being frontloaded by nature for cold and snow. A weak start to the snowfall continues for the whole season. With a snowy start continuing for the whole season. So if the stations near NYC stay under 4” in December, then it’s a below average snowfall signal for the whole season. Go above 4” in December and it has usually been a snowy season. This relationship has worked for 14 out of the last 15 La Ninas since 95-96 including the recent 24-25 La Niña winter season.
-
O U C H
-
Perfect weather in every way possible... except dry. Finished with 0.33 in August..
-
Did you take a selfie doing it?
-

2025 Atlantic Hurricane Season
BarryStantonGBP replied to BarryStantonGBP's topic in Tropical Headquarters
-
E PA/NJ/DE Autumn 2025 Obs/Discussion
BBasile replied to PhiEaglesfan712's topic in Philadelphia Region
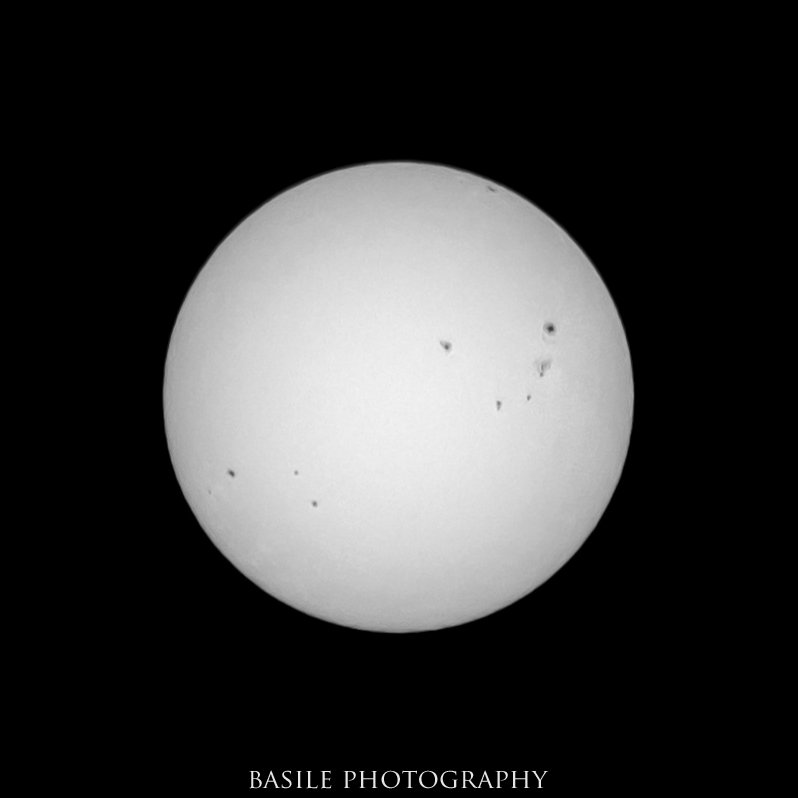
The sun is a bit active today. Space weather has been more exciting than Earth weather.
-
To be fair, why do we care any time of year? This is a weather forum haha.
-

E PA/NJ/DE Autumn 2025 Obs/Discussion
Newman replied to PhiEaglesfan712's topic in Philadelphia Region
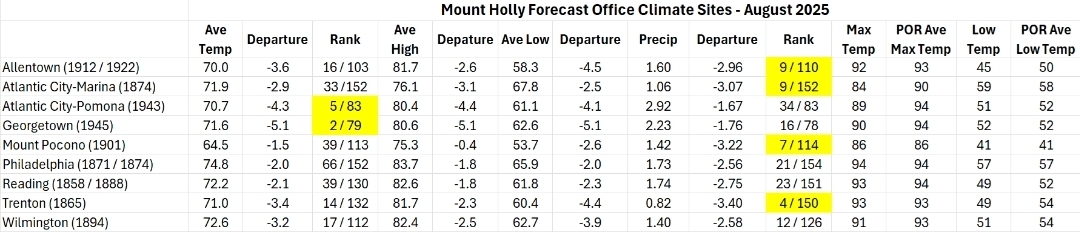
A couple climate statistics for Allentown as we wrapped up August: The average temperature was 70.0F, the coolest August since 2008. Likewise the average minimum was 58.3F, the lowest since 2008. The lowest minimum recorded was 45F, which is the lowest August min since 2000 (which tied with a min of 45). The next year that recorded a lower minimum in August is 1986! 1.6" of precip fell, which is the driest August since 2008.