All Activity
- Past hour
-
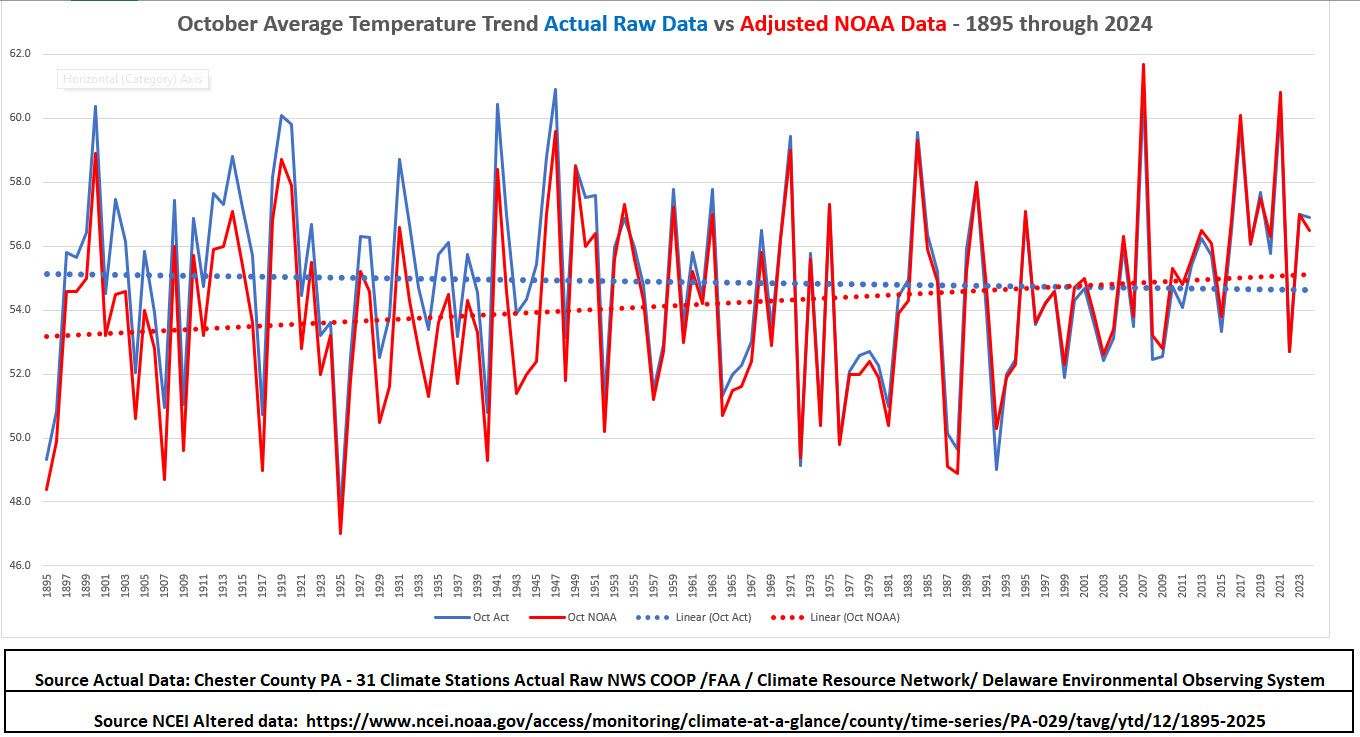
With below normal temperatures continuing this week here in Chester County PA to close out October we will finish the month with below normal temperatures. This is the 5th month of the 10 months here in 2025 to feature below normal readings. Overall this will be a Top 50 cool October across 133 years of records. As you can see below this will continue our relative overall actual raw data cooling trend for Octobers since the 1890's.

-
The last several center fixes by recon show a slowdown and northward turn. The turn is happening.
-
(002).thumb.png.6e3d9d46bca5fe41aab7a74871dd8af8.png)
Central PA Fall Discussions and Obs
ChescoWx replied to ChescoWx's topic in Upstate New York/Pennsylvania
With below normal temperatures continuing this week to close out October we will finish the month with below normal temperatures. This is the 5th month of the 10 months here in 2025 to feature below normal readings. Overall this will be a Top 50 cool October across 133 years of records. As you can see below this will continue our relative overall actual raw data cooling trend for Octobers since the 1890's.
-
E PA/NJ/DE Autumn 2025 Obs/Discussion
ChescoWx replied to PhiEaglesfan712's topic in Philadelphia Region
With below normal temperatures continuing this week to close out October we will finish the month with below normal temperatures. This is the 5th month of the 10 months here in 2025 to feature below normal readings. Overall this will be a Top 50 cool October across 133 years of records. As you can see below this will continue our relative overall actual raw data cooling trend for Octobers since the 1890's.
-

Spooky Season (October Disco Thread)
Lava Rock replied to Prismshine Productions's topic in New England
Wintery on top of saddleback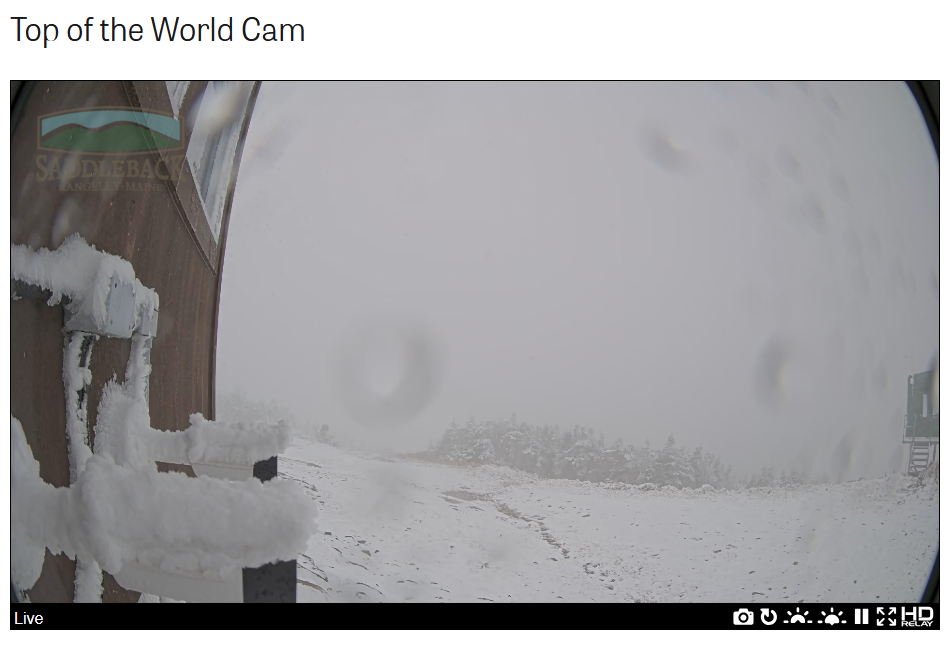
-
This NE eyewall dropsonde is about as high end as you get in the Atlantic basin. Product: Air Force Temp Drop (Dropsonde) Message (UZNT13 KNHC)Transmitted: 27th day of the month at 16:13ZAgency: United States Air ForceAircraft: Lockheed WC-130J Hercules with reg. number AF98-5308Storm Name: MelissaStorm Number: 13 (flight in the North Atlantic basin)Mission Number: 20Observation Number: 27Part A... Date: Near the closest hour of 16Z on the 27th day of the month Highest Mandatory Level For Which Wind Was Reported: 850mb Coordinates: 16.4N 78.1W Location: 141 statute miles (226 km) to the SW (217°) from Kingston, Jamaica. Marsden Square: 044 ( About ) Surface and Standard Isobaric Surfaces Level Geo. Height Air Temp. Dew Point Wind Direction Wind Speed 1000mb This level does not exist in this area of the storm above the surface level. 927mb (27.38 inHg) Surface (Sea Level) 25.0°C (77.0°F) 25.0°C (77°F) 340° (from the NNW) 163 knots (188 mph) 925mb 17m (56 ft) 24.4°C (75.9°F) 24.4°C (76°F) 345° (from the NNW) 178 knots (205 mph) 850mb 756m (2,480 ft) 20.6°C (69.1°F) 20.5°C (69°F) 45° (from the NE) 181 knots (208 mph) 700mb 2,427m (7,963 ft) Other data not available. Information About Radiosonde: - Launch Time: 15:44Z - About Sonde: A descending radiosonde tracked automatically by satellite navigation with no solar or infrared correction. Remarks Section... Dropsonde Location: Dropped in eyewall 45° (NE) from the eye center. Highest altitude where wind was reported: - Location: 16.42N 78.14W - Time: 15:44:32Z Lowest altitude where wind was reported: - Location: 16.34N 78.29W - Time: 15:49:01Z Mean Boundary Level Wind (mean wind in the lowest 500 geopotential meters of the sounding): - Wind Direction: 5° (from the N) - Wind Speed: 174 knots (200 mph) Deep Layer Mean Wind (average wind over the depth of the sounding): - Wind Direction: 65° (from the ENE) - Wind Speed: 125 knots (144 mph) - Depth of Sounding: From 707mb to 927mb Average Wind Over Lowest Available 150 geopotential meters (gpm) of the sounding: - Lowest 150m: 152 gpm - 2 gpm (499 geo. feet - 7 geo. feet) - Wind Direction: 350° (from the N) - Wind Speed: 185 knots (213 mph) Sounding Software Version: AEV 40001 Part B: Data for Significant Levels... Significant Temperature And Relative Humidity Levels Level Air Temperature Dew Point 927mb (Surface) 25.0°C (77.0°F) 25.0°C (77°F) 924mb 24.2°C (75.6°F) 24.2°C (76°F) 910mb 23.2°C (73.8°F) 23.2°C (74°F) 850mb 20.6°C (69.1°F) 20.5°C (69°F) 729mb 15.6°C (60.1°F) 15.6°C (60°F) 720mb 16.6°C (61.9°F) 13.3°C (56°F) 702mb 15.0°C (59.0°F) 12.8°C (55°F) Significant Wind Levels Level Wind Direction Wind Speed 927mb (Surface) 340° (from the NNW) 163 knots (188 mph) 926mb 340° (from the NNW) 164 knots (189 mph) 925mb 345° (from the NNW) 179 knots (206 mph) 922mb 345° (from the NNW) 194 knots (223 mph) 920mb 345° (from the NNW) 197 knots (227 mph) 917mb 345° (from the NNW) 193 knots (222 mph) 914mb 350° (from the N) 176 knots (203 mph) 912mb 0° (from the N) 185 knots (213 mph) 905mb 5° (from the N) 194 knots (223 mph) 890mb 15° (from the NNE) 159 knots (183 mph) 881mb 25° (from the NNE) 182 knots (209 mph) 873mb 25° (from the NNE) 164 knots (189 mph) 868mb 30° (from the NNE) 170 knots (196 mph) 864mb 30° (from the NNE) 166 knots (191 mph) 860mb 35° (from the NE) 170 knots (196 mph) 858mb 40° (from the NE) 183 knots (211 mph) 854mb 45° (from the NE) 177 knots (204 mph) 850mb 45° (from the NE) 181 knots (208 mph) 811mb 85° (from the E) 155 knots (178 mph) 707mb 125° (from the SE) 167 knots (192 mph)
-
Yeah, I think Melissa is still deepening. Just a violent hurricane. 11am NHC discussion said the NOAA aircraft had to bail out earlier because of the extreme turbulence.
-

Spooky Season (October Disco Thread)
ineedsnow replied to Prismshine Productions's topic in New England
Pretty big shift on the 12z models so far.. we pray for a miracle? -
This is as impressive a dropsonde as you'll ever see. Caveats about instantaneous gusts yada yada. Product: Air Force Temp Drop (Dropsonde) Message (UZNT13 KNHC)Transmitted: 27th day of the month at 16:13ZAgency: United States Air ForceAircraft: Lockheed WC-130J Hercules with reg. number AF98-5308Storm Name: MelissaStorm Number: 13 (flight in the North Atlantic basin)Mission Number: 20Observation Number: 27Part A... Date: Near the closest hour of 16Z on the 27th day of the month Highest Mandatory Level For Which Wind Was Reported: 850mb Coordinates: 16.4N 78.1W Location: 141 statute miles (226 km) to the SW (217°) from Kingston, Jamaica. Marsden Square: 044 ( About ) Surface and Standard Isobaric Surfaces Level Geo. Height Air Temp. Dew Point Wind Direction Wind Speed 1000mb This level does not exist in this area of the storm above the surface level. 927mb (27.38 inHg) Surface (Sea Level) 25.0°C (77.0°F) 25.0°C (77°F) 340° (from the NNW) 163 knots (188 mph) 925mb 17m (56 ft) 24.4°C (75.9°F) 24.4°C (76°F) 345° (from the NNW) 178 knots (205 mph) 850mb 756m (2,480 ft) 20.6°C (69.1°F) 20.5°C (69°F) 45° (from the NE) 181 knots (208 mph) 700mb 2,427m (7,963 ft) Other data not available. Information About Radiosonde: - Launch Time: 15:44Z - About Sonde: A descending radiosonde tracked automatically by satellite navigation with no solar or infrared correction. Remarks Section... Dropsonde Location: Dropped in eyewall 45° (NE) from the eye center. Highest altitude where wind was reported: - Location: 16.42N 78.14W - Time: 15:44:32Z Lowest altitude where wind was reported: - Location: 16.34N 78.29W - Time: 15:49:01Z Mean Boundary Level Wind (mean wind in the lowest 500 geopotential meters of the sounding): - Wind Direction: 5° (from the N) - Wind Speed: 174 knots (200 mph) Deep Layer Mean Wind (average wind over the depth of the sounding): - Wind Direction: 65° (from the ENE) - Wind Speed: 125 knots (144 mph) - Depth of Sounding: From 707mb to 927mb Average Wind Over Lowest Available 150 geopotential meters (gpm) of the sounding: - Lowest 150m: 152 gpm - 2 gpm (499 geo. feet - 7 geo. feet) - Wind Direction: 350° (from the N) - Wind Speed: 185 knots (213 mph) Sounding Software Version: AEV 40001 Part B: Data for Significant Levels... Significant Temperature And Relative Humidity Levels Level Air Temperature Dew Point 927mb (Surface) 25.0°C (77.0°F) 25.0°C (77°F) 924mb 24.2°C (75.6°F) 24.2°C (76°F) 910mb 23.2°C (73.8°F) 23.2°C (74°F) 850mb 20.6°C (69.1°F) 20.5°C (69°F) 729mb 15.6°C (60.1°F) 15.6°C (60°F) 720mb 16.6°C (61.9°F) 13.3°C (56°F) 702mb 15.0°C (59.0°F) 12.8°C (55°F) Significant Wind Levels Level Wind Direction Wind Speed 927mb (Surface) 340° (from the NNW) 163 knots (188 mph) 926mb 340° (from the NNW) 164 knots (189 mph) 925mb 345° (from the NNW) 179 knots (206 mph) 922mb 345° (from the NNW) 194 knots (223 mph) 920mb 345° (from the NNW) 197 knots (227 mph) 917mb 345° (from the NNW) 193 knots (222 mph) 914mb 350° (from the N) 176 knots (203 mph) 912mb 0° (from the N) 185 knots (213 mph) 905mb 5° (from the N) 194 knots (223 mph) 890mb 15° (from the NNE) 159 knots (183 mph) 881mb 25° (from the NNE) 182 knots (209 mph) 873mb 25° (from the NNE) 164 knots (189 mph) 868mb 30° (from the NNE) 170 knots (196 mph) 864mb 30° (from the NNE) 166 knots (191 mph) 860mb 35° (from the NE) 170 knots (196 mph) 858mb 40° (from the NE) 183 knots (211 mph) 854mb 45° (from the NE) 177 knots (204 mph) 850mb 45° (from the NE) 181 knots (208 mph) 811mb 85° (from the E) 155 knots (178 mph) 707mb 125° (from the SE) 167 knots (192 mph)
-

Spooky Season (October Disco Thread)
Snowcrazed71 replied to Prismshine Productions's topic in New England
Yeah well Kev said it's going to be a warm month with not much cold LOL -

Spooky Season (October Disco Thread)
dryslot replied to Prismshine Productions's topic in New England
Papaya. -
2025-2026 Fall/Winter Mountain Thread
Daniel Boone replied to Buckethead's topic in Southeastern States
Enjoy the day off man . -
What is that? Looks interesting.
-
-
Alright, it's time to grade the peak season forecast. As you know, the period between August 20 and October 20 is graded. Melissa, our third category 5 hurricane of the season, was officially designated 11 hours after my forecast ended, but them's the breaks. Here's how the numbers shake out. Peak Season Forecast (Aug 20-Oct 20) Named Storms: 10 (7) Hurricanes: 6 (3) Major Hurricanes: 3 (2) Fernand, Gabrielle (MH), Humberto (MH), Imelda (H), Jerry, Karen, Lorenzo Missing Melissa so closely obviously hurts The numbers were fine overall. The biggest overestimation ended up being the number of hurricanes. This season is truly the definition of quality over quantity, with 60% of the limited hurricane activity consisting of C5s. This is only the second season on record with more than 2 C5s. In 2005 we had four. The overall forecast that we would have a similar peak season lull to 2024, and then have a highly active back half of the peak season was spot on. Even the more specific forecast of activity halting until after September 20 was nailed. That is a huge win, because many were losing confidence that there would even be meaningful activity given the stability issues in the basin. This alone puts me in good shape with the forecast grade, but let's examine each of the factors I analyzed in August. 1. ENSO--I was right that cool ENSO would dominate the season, and that ended up being the case. That wasn't too hard a call given that we were in a Nina watch. The ENSO did end up facilitating lower wind shear in the basin, but the picture is a little more tricky as you'll see below. 2. WAM--I expected an active WAM, but less so than last year where we had so many robust waves that it may have triggered more SAL and stability in the basin. The active WAM is evidenced by the strong waves that continued into October, and gave me some much needed help with my NS forecast at the end of the forecast period. Importantly, it also looks like after the wave that eventually became Melissa that wave train ended, right in alignment with my forecast. 3. Wind shear--this is the first spot where I really ding myself. I was right that shear would be on the lower side off the east coast and Caribbean, and that was true. Off the east coast, note the higher than normal shear in part of September and then the drop in late September into October. Decent. The Caribbean, however, was a powder keg waiting to explode. We see that now with Melissa being the only tangible wave to get to the Caribbean. I was dead wrong when I thought that anti-cyclonic wave breaking wouldn't be an issue in the basin this season. It was, and led to all of the TUTTs that absolutely gutted the basin of activity during the first 2/3 of September. Once that subsided, the basin lit up. 4. SST/OHC--the second biggest call of the season was accurately predicting that the defining feature of the season would be activity in the SW Atlantic. The Atlantic SST distribution became favorable for activity right before peak season, and it produced. If anything, we underperformed given the complete lack of activity in the Caribbean and Gulf, which I didn't anticipate to this extent. Erin's wake recovered, as I expected, and we saw high end activity in the SW Atlantic during the period. 5. MJO & CCKW--As expected, things became a lot more favorable once the MJO flipped to favorable the second half of the peak. The dates do not line up perfectly with my peak season forecast but as Phil Klotzbach notes 2025 is tied with 1941 and 2024 for the most Atlantic major hurricane formations (3 including Melissa) between Sept 22 and Oct 25. More on point, since 1970, only 7 seasons have had 5+ NS between Sept 17 and October 9, 2024 and 2025 are two of them. 6. Stability, dry air, and SAL--I really was a believer that the stability issues that we've had this decade in the tropical Atlantic would be an inhibitor early in the forecast period, and that was really right. That will be a key factor in the overall numbers being lower for some seasonal forecasts. This has been very hard to overcome in August and September in the eastern Atlantic. That said, this statement was proven to be right: The activity would follow the wave train moistening the environment and waves getting to the western Atlantic. Surprisingly, we didn't get Gulf for Caribbean activity. Even the CAG signal that was present on the models at the start of October didn't work out. Odd, but the SW Atlantic was still a hub of activity. Overall I called for a significant lull akin to 2024, followed by another high end and backloaded peak season. Two major hurricanes, one a C5, certainly fits the bill for effectively a four week peak. It seems as if the season will rapidly shut down after Melissa (again, outside the forecast period), but that seems to be another good call. There may be an uptick in the NS numbers with that possible subtropical event off the Mid-Atlantic a few weeks ago, but we grade as the numbers are as of October 20. I thought the Gulf would be quieter, but not completely dead. I called for a hurricane strike on the east coast and that missed, but only because we had a rare fujiwara interaction between Imelda off the southeast coast and Humberto, which unexpectedly rapidly intensified into a C5. We did not continue our streak of continental US MH landfalls. Fine by me. Grade: B+ Seasonal Grades 2019 Grade: B+ 2020 Grade: A- 2021 Grade: C 2022 Grade: B 2023 Grade: A 2024 Grade: B 2025 Grade: B+
-
Looks stationary to me.
-
Nice dry slot on the 12z gfs. Looks about right.
-
Was it forecast to turn already
-
Spooky Season (October Disco Thread)
dryslot replied to Prismshine Productions's topic in New England
Next year. -
Yes, should have said westward progress. It seems to have started wobbling south and a bit north rather than westward. But, definitely hard to tell.
-

Spooky Season (October Disco Thread)
dendrite replied to Prismshine Productions's topic in New England
Where are the pawpaws?
-

Central PA Fall Discussions and Obs
Itstrainingtime replied to ChescoWx's topic in Upstate New York/Pennsylvania
Good god is Melissa a beast right now. -
Its been moving at 3mph all morning. If it slowed any more it would be standing still.
-
It doesn’t appear to be turning yet. What you saw was a wobble back to the North to counteract the wobble South and maintain the mean motion West. It’s moving at 3mph. The steering flow is weak. The ridge to the North will gradually weaken thanks to the trough that’s building into the Southeast US. As it weakens, Melissa will feel the weakness and gradually turn North.
-
Spooky Season (October Disco Thread)
dendrite replied to Prismshine Productions's topic in New England
Mostly sunny all morning here, but the NE flow cumulus are trying to back in.