All Activity
- Past hour
-
That would be a HEC in February. Timing is cutting it close with MDW. We definitely do not want that slowing down.
-
All that virtual snow.....
-
Clouds look to come back as soon as Wed next week with a raw Thu/Fri
-
This wasn’t the case for many first order sites such as NYC. So recent snowfall measurements are inflated relative to the way snowfall was measured prior to the 1990s around NYC and to before 1950 in other locations. So boost pre-1950 snowfall totals by 15-20% and the majority of first order sites in the U.S. will show a steady decline since the late 1800s. Several stations already show a long term snowfall decline. So imagine how much steeper a decline we would have if the snowfall was measured as frequently as it is today. Plus places like NYC would use melted down gauge snow equivalents and not actual measurements like in the blizzard of 1888 using a simple 10:1 ratio which is very inaccurate when the 1800s were so cold with much higher ratios. https://news.ucar.edu/14009/snowfall-measurement-flaky-history As a hydrometeorological instructor in UCAR’s COMET program and a weather observer for the National Weather Service, I am keenly interested in weather trends. In this case, climate change is an important factor to explore, since we know that the heaviest precipitation events have intensified in many parts of the world (see related story: Torrents and droughts and twisters - oh my!). But when we turn to snowstorms in the Northeast, or elsewhere in the U.S., there is an additional factor at work when comparing modern numbers with historical ones. Quite simply, our measuring techniques have changed, and we are not necessarily comparing apples to apples. In fact, the apparent trend toward bigger snowfalls is at least partially the result of new—and more accurate—ways of measuring snowfall totals. Climate studies carefully select a subset of stations with consistent snow records, or avoid the snowfall variable altogether. Official measurement of snowfall these days uses a flat, usually white, surface called a snowboard (which pre-dates the popular winter sport equipment of the same name). The snowboard depth measurement is done ideally every 6 hours, but not more frequently, and the snow is cleared after each measurement. At the end of the snowfall, all of the measurements are added up for the storm total. NOAA’s cooperative climate observers and thousands of volunteers with the Community Collaborative Rain, Hail and Snow (CoCoRaHS), a nationwide observer network, are trained in this method. This practice first became standard at airports starting in the 1950s, but later at other official climate reporting sites, such as Manhattan’s Central Park, where 6-hourly measurements did not become routine until the 1990s. Earlier in our weather history, the standard practice was to record snowfall amounts less frequently, such as every 12 or 24 hours, or even to take just one measurement of depth on the ground at the end of the storm. You might think that one or two measurements per day should add up to pretty much the same as measurements taken every 6 hours during the storm. It’s a logical assumption, but you would be mistaken. Snow on the ground gets compacted as additional snow falls. Therefore, multiple measurements during a storm typically result in a higher total than if snowfall is derived from just one or two measurements per day. That can make quite a significant difference. It turns out that it’s not uncommon for the snow on the ground at the end of a storm to be 15 to 20 percent less than the total that would be derived from multiple snowboard measurements. As the cooperative climate observer for Boulder, Colorado, I examined the 15 biggest snowfalls of the last two decades, all measured at the NOAA campus in Boulder. The sum of the snowboard measurements averaged 17 percent greater than the maximum depth on the ground at the end of the storm. For a 20-inch snowfall, that would be a boost of 3.4 inches—enough to dethrone many close rivals on the top-10 snowstorm list that were not necessarily lesser storms! Another common practice at the cooperative observing stations prior to 1950 did not involve measuring snow at all, but instead took the liquid derived from the snow and applied a 10:1 ratio (every inch of liquid equals ten inches of snow). This is no longer the official practice and has become increasingly less common since 1950. But it too introduces a potential low bias in historic snowfalls because in most parts of the country (and in the recent blizzard in the Northeast) one inch of liquid produces more than 10 inches of snow. This means that many of the storms from the 1980s or earlier would probably appear in the record as bigger storms if the observers had used the currently accepted methodology. Now, for those of you northeasterners with aching backs from shoveling, I am not saying that your recent storm wasn’t big in places like Boston, Portland, or Long Island. But I am saying that some of the past greats—the February Blizzard of 1978, the Knickerbocker storm of January 1922, and the great Blizzard of March 1888—are probably underestimated. So keep in mind when viewing those lists of snowy greats: the older ones are not directly comparable with those in recent decades. It’s not as bad as comparing apples to oranges, but it may be like comparing apples to crabapples. Going forward, we can look for increasingly accurate snow totals. Researchers at NCAR and other organizations are studying new approaches for measuring snow more accurately (see related story: Snowfall, inch by inch). But we can’t apply those techniques to the past. For now, all we can say is that snowfall measurements taken more than about 20 or 30 years ago may be unsuitable for detecting trends – and perhaps snowfall records from the past should not be melting away quite as quickly as it appears. Update • January 29, 2015 | Thanks to thoughtful feedback by several colleagues, this article has been updated. Paragraph 3 now includes a description of how climate studies handle the data inconsistencies. Paragraph 9 was added to describe the pre-1950s practice, no longer in wide use, of recording liquid water content only, and not snow depth. Matt Kelsch is a hydrometeorologist in UCAR's COMET Program. He specializes in weather and climate events involving water, such as floods, droughts, rain, hail, or snow. Kelsch develops and delivers educational materials designed for both domestic and international groups including National Weather Service forecasters, the military, the World Meteorological Organization, university students and faculty, government agencies, and private industry.
-
Mostly on the gfs long range
-
Pretty clear elongated outflow boundary associated with the primary area of convection moving S/SE, as the convection itself is expanding southward.
-
I think I saw wiz in the long sleeves and pugil stick
-
My niece is graduating from college and the ceremony is Thursday at Dunkin Park in Hartford...looks like crap
-
Lol I'm ACATT but definitely not pale white.. some of us do get out even though we hate it.. I even do a 3 mile power walk / jog every day..
-
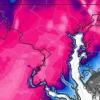
Where was this all winter:
.thumb.gif.895e6794830c09572762d4617a95636a.gif)
-
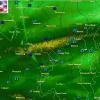
Storms moving through C/N PA
-
Records: Highs: EWR: 92 (1951) NYC: 90 (1951) LGA: 90 (1951) JFK: 83 (1993) Lows: EWR: 40 (2016) NYC: 42 (1878) LGA: 41 (1983) JFK: 43 (1983) Historical: 1874 - The Mill Creek disaster occurred west of Northhampton MA. Dam slippage resulted in a flash flood which claimed 143 lives, and caused a million dollars property damage. (David Ludlum) 1924 - The temperature at Blitzen OR soared to 108 degrees to set a state record for the month of May. The record was later tied at Pelton Dam on the 31st of May in 1986. (The Weather Channel) 1952 - High winds in the Wasatch Canyon of Utah struck Ogden and Brigham City. Winds at Hill Air Force Base gusted to 92 mph. (The Weather Channel) 1987 - It was a summer-like day as thunderstorms abounded across the nation. Thunderstorms in Texas drenched Guadelupe County with more than three inches of rain resulting in flash flooding. (The National Weather Summary) (Storm Data) 1988 - Afternoon and evening thunderstorms developing ahead of a cold front produced severe weather from Florida to New York State. Unseasonably warm weather prevailed in the north central U.S. Havre, MT, reported a record high of 95 degrees. (The National Weather Summary) 1989 - Thunderstorms developing ahead of a cold front produced severe weather in the south central U.S. Thunderstorms spawned twenty tornadoes, and there were 180 reports of large hail and damaging winds. A tornado at Cleburne, TX, caused 30 million dollars damage. A violent (F-4) tornado touched down near Brackettville, TX, and a strong (F-3) tornado killed one person and injured 28 others at Jarrell, TX. Thunderstorms also produced softball size hail at Shamrock, TX. (The National Weather Summary) (Storm Data) 1990 - Thunderstorms produced severe weather from eastern Oklahoma and northeastern Texas to the Upper Ohio Valley. Thunderstorms spawned seventeen tornadoes, including a twister which killed one person and injured another north of Corning, AR. There were 128 reports of large hail or damaging winds. Strong thunderstorm winds killed one person and injured six others at Folsomville, IN, and injured another five persons in southeastern Hardin County KY. In Arkansas, baseball size hail was reported near Fouke and near El Dorado. (The National Weather Summary) (Storm Data) 1995: On this date through the 17th, 6.55 inches of rain fell at St. Louis, MO. This is the fifth greatest 24-hour total amount of precipitation for that location. 5.73 inches of rain fell at Columbia, MO making it the sixth greatest 24-hour total amount of precipitation for that location.
-
That line looks quite healthy, but it appears, per future radar, that it stays primarily north of I-80.
-
65 / 64 low level clouds and fog. Some pokes of sun and low 70s could trigger some storms this pm and evening. Saturday the warmest of the next 10, and with enough sun and break between the front 90 degree could be approached in the warmer spots otherwise low - mid 80sn stoems by the late afternoon/evening - pending timing of the front. Sunday - Tuesday nicest - dry stretch with near normal. By Wed clouds and showers are back in the picture and with a stiff E/ENE flow Thursday looks quite ugly and cool. Brunt of the rain between Wed - Fri then could be right on Memorial Day. Trough stingy in the east right through the end of the month. Heat building in the rockies looks to start eastward push early next month.
-
If you squint, looks like a boundary moving through HoCo right now on radar
- 550 replies
-
- 2
-

-
- severe
- thunderstorms
- (and 2 more)
-
It looks like storms are starting to fire all through Central PA into Northern MD. Maybe late but not denied?
-
Regarding the “failed” morning MCS, guidance overnight showed that the far southern flank might ignite after 8 or 9 am this morning in northern MD. A few showers are now indeed breaking out, so there is clearly at least some forcing. Model solutions vary between just isolated weak showers and actual robust storms, so I’m unsure how the next few hours will play out, but we clearly do have some sort of forcing mechanism.
- 550 replies
-
- 6
-
-

-
- severe
- thunderstorms
- (and 2 more)
-
We should all have a summer gtg at the beach. Get all the pale white ACATT albinos out there living it up like a Len video.
-
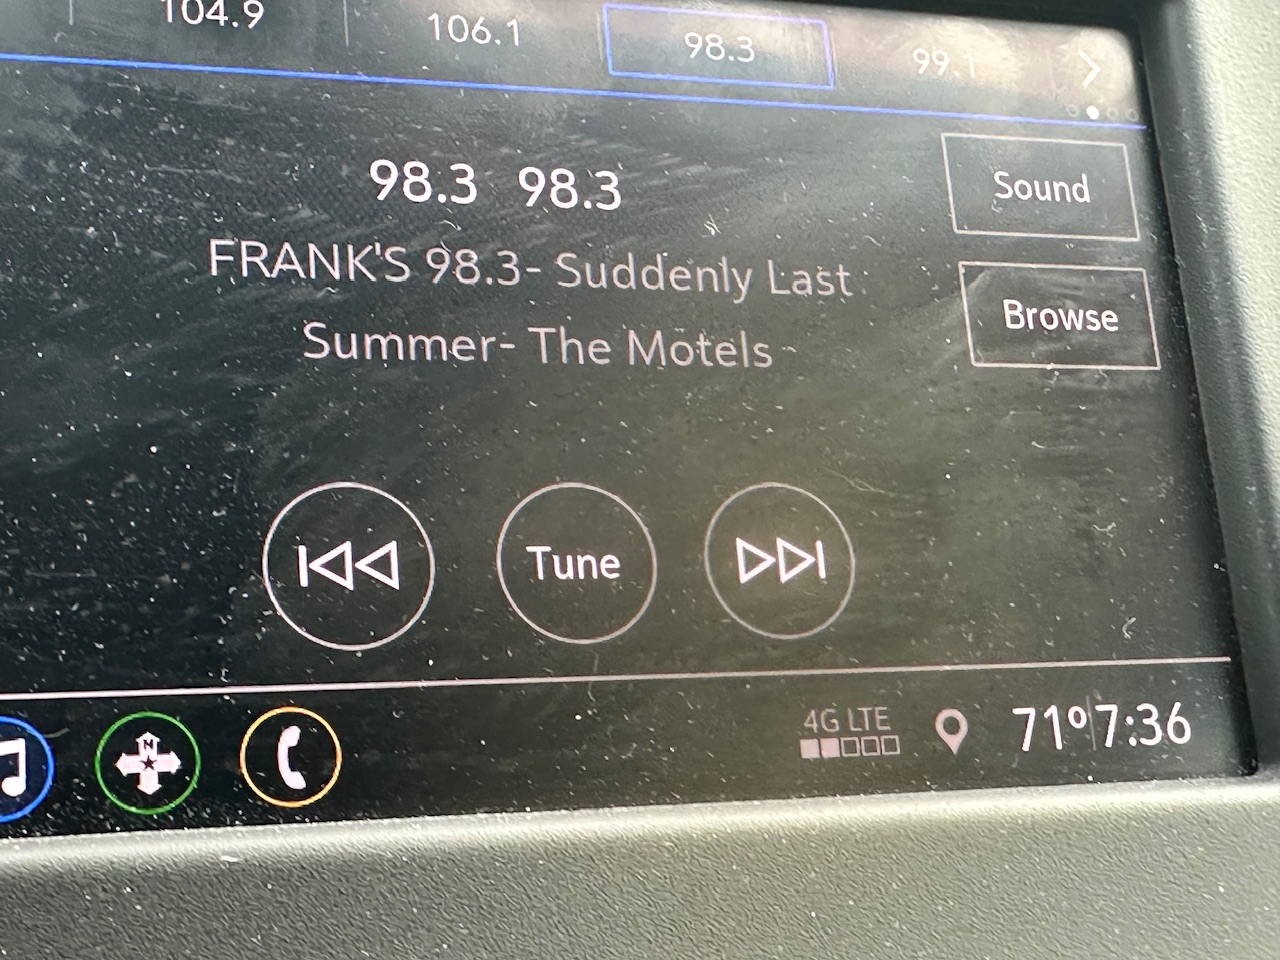
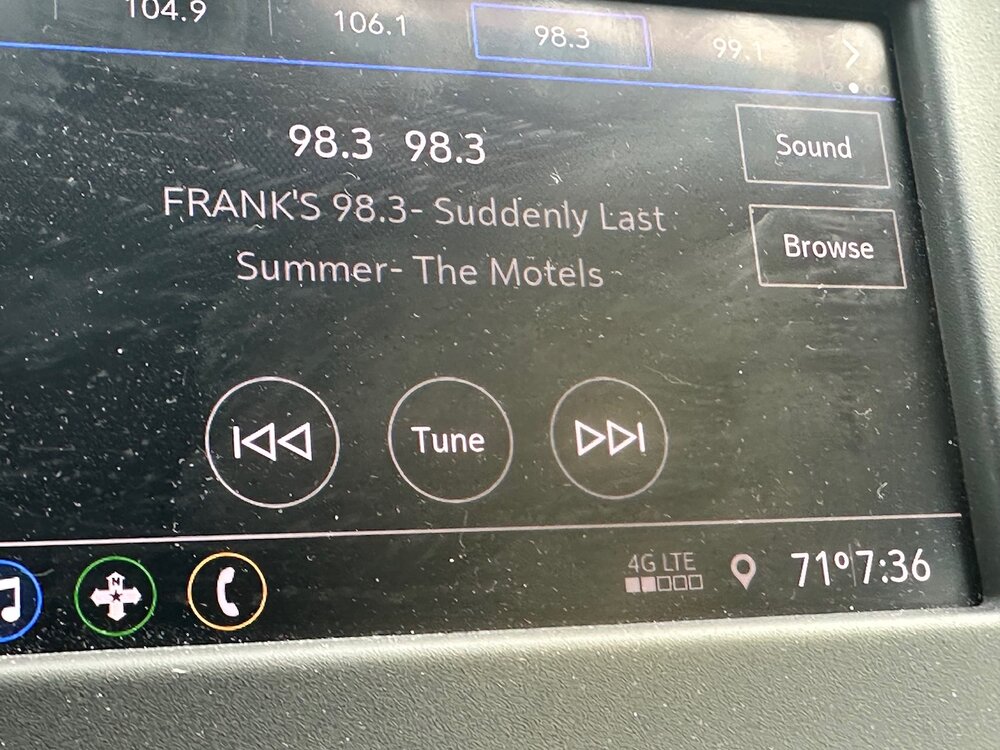
71° on the car thermo Suddenly last summer!
-
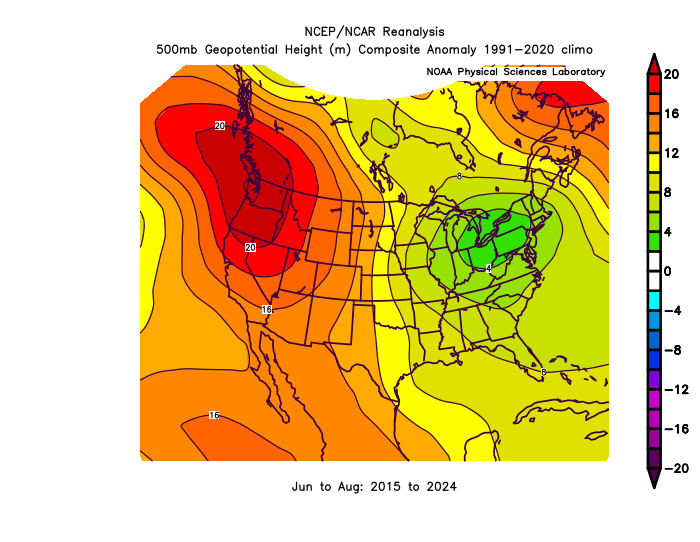
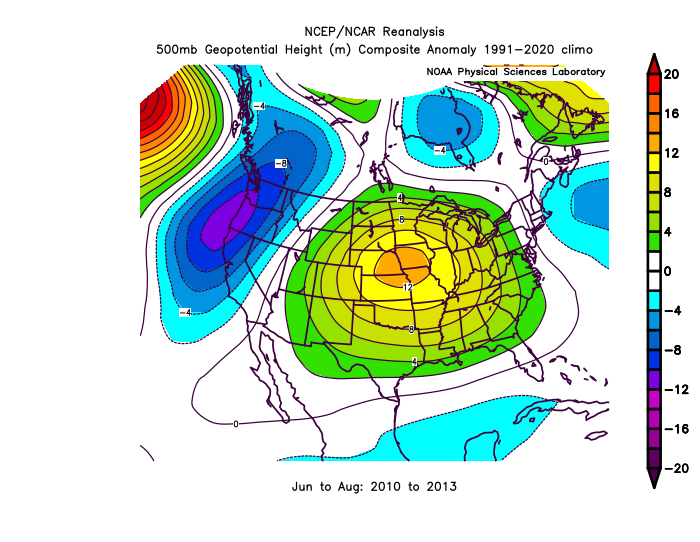
Some of the models show the severe drought shifting eastward into the Plains from the 2030s into the 2050s. But it would require the ridge east of New England shifting for us to get westerly winds from the Plains. I suppose a compromise could be possible with both ridges linking up and alternating westerly and southerly flow. But this hasn’t been the case in the last decade with more of a trough over the Great Lakes and Ohio Valley and inshore flow. Notice how these days the common summer pattern has been a ridge east of New England and over the West. But from 2010 to 2013 when we had all the 100° heat and westerly flow there was a ridge in the Plains.
-
Now this is heaven

-
Maybe if this rampaging Pacific Jet is a permanent thing now the West would be wet and Plains would start to dry out. But who knows.
-
Let’s dew this! https://x.com/jmelmed23/status/1923321374807925121?s=46&t=dhcbvkjmRcyBVQtDxJ3lRg
-
Wayne, NJ to the west of Newark actually had a higher average maximum temperature than Newark did with more 90° days. So the heat wasn’t just localized to Newark. But Newark did lead with the 95° days though a few COOPs nearby were close. A local COOP had a higher max at 106° while Newark only made it to 105° that summer. Data for June 1, 1993 through August 31, 1993 Click column heading to sort ascending, click again to sort descending. WAYNE COOP 90.1 Newark Area ThreadEx 88.9 NEWARK LIBERTY INTL AP WBAN 88.9 MOORESTOWN 4 E COOP 88.1 WOODSTOWN PITTSGROV 4E COOP 88.0 LITTLE FALLS COOP 88.0 INDIAN MILLS 2 W COOP 87.1 LAMBERTVILLE COOP 87.1 PEMBERTON COOP 87.0 BELLEPLAIN STA FOREST COOP 86.9 CRANFORD COOP 86.9 PENNSAUKEN 1N COOP 86.7 LODI COOP 86.7 1993 #90° days in NJ Data for January 1, 1993 through December 31, 1993 Click column heading to sort ascending, click again to sort descending. WAYNE COOP 68 Newark Area ThreadEx 49 NEWARK LIBERTY INTL AP WBAN 49 WOODSTOWN PITTSGROV 4E COOP 45 MOORESTOWN 4 E COOP 44 LAMBERTVILLE COOP 41 TOMS RIVER COOP 40 95° days in NJ Data for January 1, 1993 through December 31, 1993 Click column heading to sort ascending, click again to sort descending. Newark Area ThreadEx 25 NEWARK LIBERTY INTL AP WBAN 25 WAYNE COOP 22 TOMS RIVER COOP 18 WOODSTOWN PITTSGROV 4E COOP 16 Maxumum NJ temoersrure in 1993 Data for January 1, 1993 through December 31, 1993 Click column heading to sort ascending, click again to sort descending. PENNSAUKEN 1N COOP 106 NEWARK LIBERTY INTL AP WBAN 105 Newark Area ThreadEx 105 TUCKERTON 2 NE COOP 104 TOMS RIVER COOP 104 WAYNE COOP 104
-
Everyone has been so much happier these last few dewy days. Much more fun on the board. Good vibes


.gif.f834392d77f15d875549e96fd7b78c4e.gif)