All Activity
- Past hour
-
Gotta start somewhere
-
I've been telling you for literally a decade that ENSO has no direct correlation now, nor in the past to what happens in the East Coast for winter. So El Ninos are cold. Some aren't. Same for La Nina. Same for snowy/unsnowy. What is the point of these posts?
-
This is what Claude told me when I gave it this prompt - the newer versions of Claude are a lot better on pattern recognition than the older versions. What kind of winter do you expect in the USA following a September that looks like 2025? Looking at this 500mb geopotential height anomaly map for September 2025, I can identify several key features that would influence the upcoming winter: Key Pattern Features: Strong negative anomaly over Alaska/North Pacific (deep purple/blue) - indicating troughing Positive anomaly over western North America (yellow/green) - ridging pattern Negative anomaly over the North Atlantic - suggestive of trough there as well Strong positive anomalies in the high latitudes (around 60-90N over northern Canada/Arctic) Expected Winter Implications for the USA: General Pattern: This setup suggests a ridge-dominated western US and trough-favored eastern US pattern could persist into winter The strong Alaskan trough with western CONUS ridge is consistent with a negative Pacific-North American (PNA) transitioning toward positive or a split flow pattern Regional Expectations: Western US: Likely warmer and drier than average, especially in the Southwest and Great Basin Reduced storm activity in California Possible drought concerns Central/Eastern US: Greater likelihood of colder outbreaks reaching the Plains and East Increased storminess along the East Coast More variable temperatures with periodic Arctic intrusions Pattern Analogs: This resembles aspects of weak La Niña or neutral ENSO winters with a tendency toward cold East/warm West splits. The strong high-latitude blocking hints at potential for polar vortex disruptions, which could mean occasional severe cold snaps in the eastern 2/3 of the country.
-
On the surface the La Nina has really struggled to get going lately.. we probably won't hit 5 straight months <-0.5 in the ONI. Of course, because of global warming there would now be 60% el nino's and 40% la nina's, so because the focus is on the Hadley/Mid-latitude Cell meeting point, the RONI is good at better gauging this Hadley Cell expansion/contraction.. The RONI is solidly Weak Nina. I found that for Winter PNA pattern the following is true: Weak Nina: +50dm -PNA Moderate Nina: +80dm -PNA Strong Nina: +100dm -PNA Weak Nino: +40dm +PNA Moderate Nino: +70dm +PNA Strong Nino: +120dm +PNA So there is difference in the PNA correlation depending on how strong the event gets.. and it looks like this will comfortably not go above Weak. Here's the SOI.. despite 14 straight +SOI months, the SOI hasn't had a +10 monthly reading since early 2023 Subsurface is also not impressive.. barely holding Weak Nina ground More chance for variation in the Winter N. Pacific pattern with Weaker negative ENSO
-
Well I find this kind of absurd. If there is a problem with the data why isn't it adjusted at the monthly level and then posted online? You know what's interesting, I just checked and there is no missing data at all from Central Park for those 30 Octobers, and it certainly hasn't changed location during that time, which were the two main reasons given for doing temperature adjustments. And did it have instrument issues that they needed a fix that resulted in a whopping 0.4 adjustment? I find it very silly.
-
You gotta get back in shape, might think about putting some WEIGHT on the racks.
-
I remember that one too. That was back when I was only 23. I walked everywhere. That day was NO exception! I was blasting tracks on my headphones and walking much faster than anyone else. I might have been slightly excited about the weather that day. I was still working for Eagle Construction. We tried to work a couple of hours, they finally quit. I walked all up and down Jeff Davis Hwy all day. I was in pure Heaven. Back in those days I could walk around for hours and hours and hours. I helped people dig out. Later when i got home that night. I got to dig our place out too. Then I started on our neighbors who were elderly. Man I have never been so damn elated in my life. I WHOOPED OUT a few real loud Woooooooo-----Hooooooooos over getting to dig so much snow! There were some excessively embarrassingly tall piles of the stuff when I got done, too.
-

Occasional Thoughts on Climate Change
WolfStock1 replied to donsutherland1's topic in Climate Change
?? No no - you just erected a complete strawman. I made no claim that sea level hasn't been rising at Delos over any period of time. If you think I did - please show me where. Otherwise - you need to retract that. -

Spooky Season (October Disco Thread)
CoastalWx replied to Prismshine Productions's topic in New England
Yeah we blow -
All of it in-fact.
-
64 for the high down to 49
-
Meh. Late October blocking? Let’s get that in January.
-
Such lows are occurring later. Central Park: 1961-1990: 10/19; 1991-2020: 10/22; 2000-2025: 10/24 JFK: 1961-1990: 10/17; 1991-2020: 10/21; 2000-2025: 10/22
-

Central PA Fall Discussions and Obs
canderson replied to ChescoWx's topic in Upstate New York/Pennsylvania
Same. Every week it comes to mind and I wish him and his loved ones well. -
Snow is just blowing around on The Summit at Mammoth Mountain. It's high winter there right now and will be for 7 months. https://www.mammothmountain.com/on-the-mountain/mammoth-webcam/the-summit
-
Occasional Thoughts on Climate Change
WolfStock1 replied to donsutherland1's topic in Climate Change
Yes - and? You didn't read what I wrote. I'm not doubting that the level is rising relative to the the land at Delos. However the point is that it's not that the water is rising fast there - it's that the land is sinking. That shows for instance a delta of about 80cm in the last 134 years. But that's far faster than the general rate of sea level rise over that same period which is roughly estimated to be 20cm. So the Delos case doesn't extend to the rest of the world. The population of Delos is about 25 people, in case you're wondering. Even in their extreme case of "sea level rise" (which is mostly land sinking) I seriously doubt they're standing and watching with horror as their homes are consumed by the sea at a rate of less than a centimeter a year. Likewise it's ludicrous to propose that the rise (or sinking, rather) of 5 meters over the course of 5000 years was a crisis. I'm not doubting whether your information is verifiable - I'm saying that it's not applicable. -

Central PA Fall Discussions and Obs
Itstrainingtime replied to ChescoWx's topic in Upstate New York/Pennsylvania
I remember his tone wasn't positive about his long range outlook. I've been thinking and concerned about him a lot ever since. -
Statistical adjustments are involved. The numbers aren't raw averages. https://www.noaa.gov/explainers/understanding-climate-normals
-
For a 30 year average 0.4 is a lot. Last fall because of frustration of not being able to find prior 30 year averages I calculated the 30 year averages all the way back to 1870 using all the monthly data available on the NWS site for Central Park.
-
2025-2026 New England Snow Recordkeeping Thread
bristolri_wx replied to bristolri_wx's topic in New England
@Ginx snewx and @tamarack have been setup with their submission forms. -

Spooky Season (October Disco Thread)
kdxken replied to Prismshine Productions's topic in New England
My Arabic is a little rusty but I am seeing some impressive gusts. -

Central PA Fall Discussions and Obs
Blizzard of 93 replied to ChescoWx's topic in Upstate New York/Pennsylvania
Great news! Has anyone heard from our old friend @paweather ? I remember last year he said he was diagnosed with a health problem. I don’t think he’s posted since, but hopefully he is recovering well. He loves the 540 line & he loved talking about rare October snow. -
well this is strange, I thought it was moving towards November. how about for the first low temperature below 40 for both locations, Don-- any changes there? Thanks!
-
Tampering probably JK, but that really is odd if you did the math and it is .4 warmer than what is listed. Maybe you found an error?
-
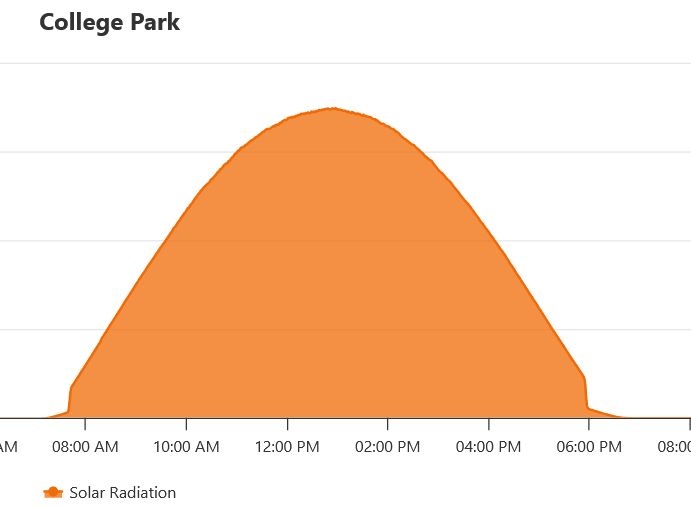
Outrageous amount of sun today.