All Activity
- Past hour
-
I would say this is endless summer. At least it is in Ohio, not sure about New York City. This is one thing you often overlook by focusing on the anomalous past warm years, there were a lot of historic years that were VERY cold. Looking at Cleveland, the first two weeks of October is running warmer than several historic Junes and even some of the coldest Augusts. Nobody would say June or August aren't summer months, just because they are colder than average. So if those months were colder than this October, and yet still considered to be summer, I would say you must accept that it is still summer. The mean high temperature for October so far is 72.7F. We can see there were 18 historic Junes with mean high temperatures for the month at or below that temperature, most recently in 1972. And, for August, we can find one cooler year (1927) and one just 0.1F warmer than this October to date (1915). Nobody would say August 1927 wasn't a summer month.
-
URGENT - WEATHER MESSAGE National Weather Service Baltimore MD/Washington DC 942 AM EDT Wed Oct 15 2025 MDZ003-501-502-509-510-VAZ025>031-503-504-WVZ050>053-055-501>506- 152145- /O.NEW.KLWX.FZ.A.0004.251017T0600Z-251017T1300Z/ Washington-Extreme Western Allegany-Central and Eastern Allegany- Western Garrett-Eastern Garrett-Augusta-Rockingham-Shenandoah- Frederick VA-Page-Warren-Clarke-Western Highland-Eastern Highland- Hampshire-Morgan-Berkeley-Jefferson-Hardy-Western Grant-Eastern Grant-Western Mineral-Eastern Mineral-Western Pendleton-Eastern Pendleton- 942 AM EDT Wed Oct 15 2025 ...FREEZE WATCH IN EFFECT FROM LATE THURSDAY NIGHT THROUGH FRIDAY MORNING... * WHAT...Sub-freezing temperatures as low as 28 to 32 degrees are possible. * WHERE...Portions of north central and western Maryland, northwest and western Virginia, and eastern and panhandle West Virginia. * WHEN...From late Thursday night through Friday morning. * IMPACTS...Frost and freeze conditions could kill crops, other sensitive vegetation and possibly damage unprotected outdoor plumbing. * ADDITIONAL DETAILS...The coolest temperatures are likely in the valleys. PRECAUTIONARY/PREPAREDNESS ACTIONS... Take steps now to protect tender plants from the cold.
-
A "normal" year would be 10th hottest ever (excluding 2025's partial data). Note, as well, despite this "fib" factor on the normals, every single year since 2020 has come in above even these artificially elevated norms. Prior to 2020, only four years were at or above 52.5F (1921, 1931, 1998, and 2012) and yet they want us to believe/accept that this is the new normal? What game are they playing?
-
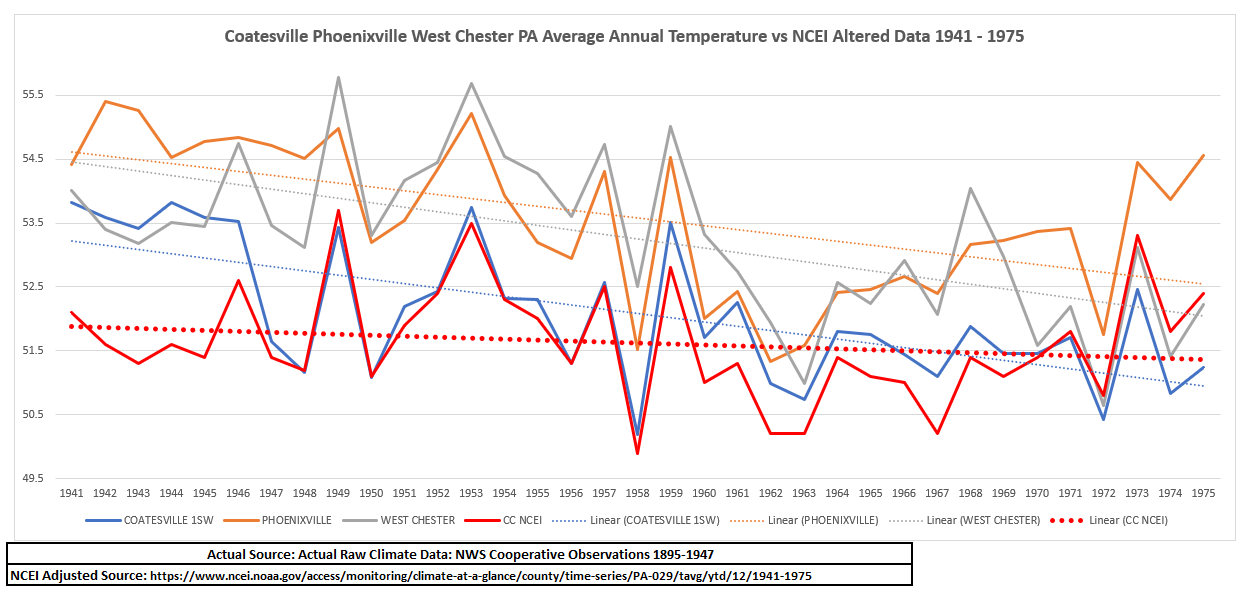
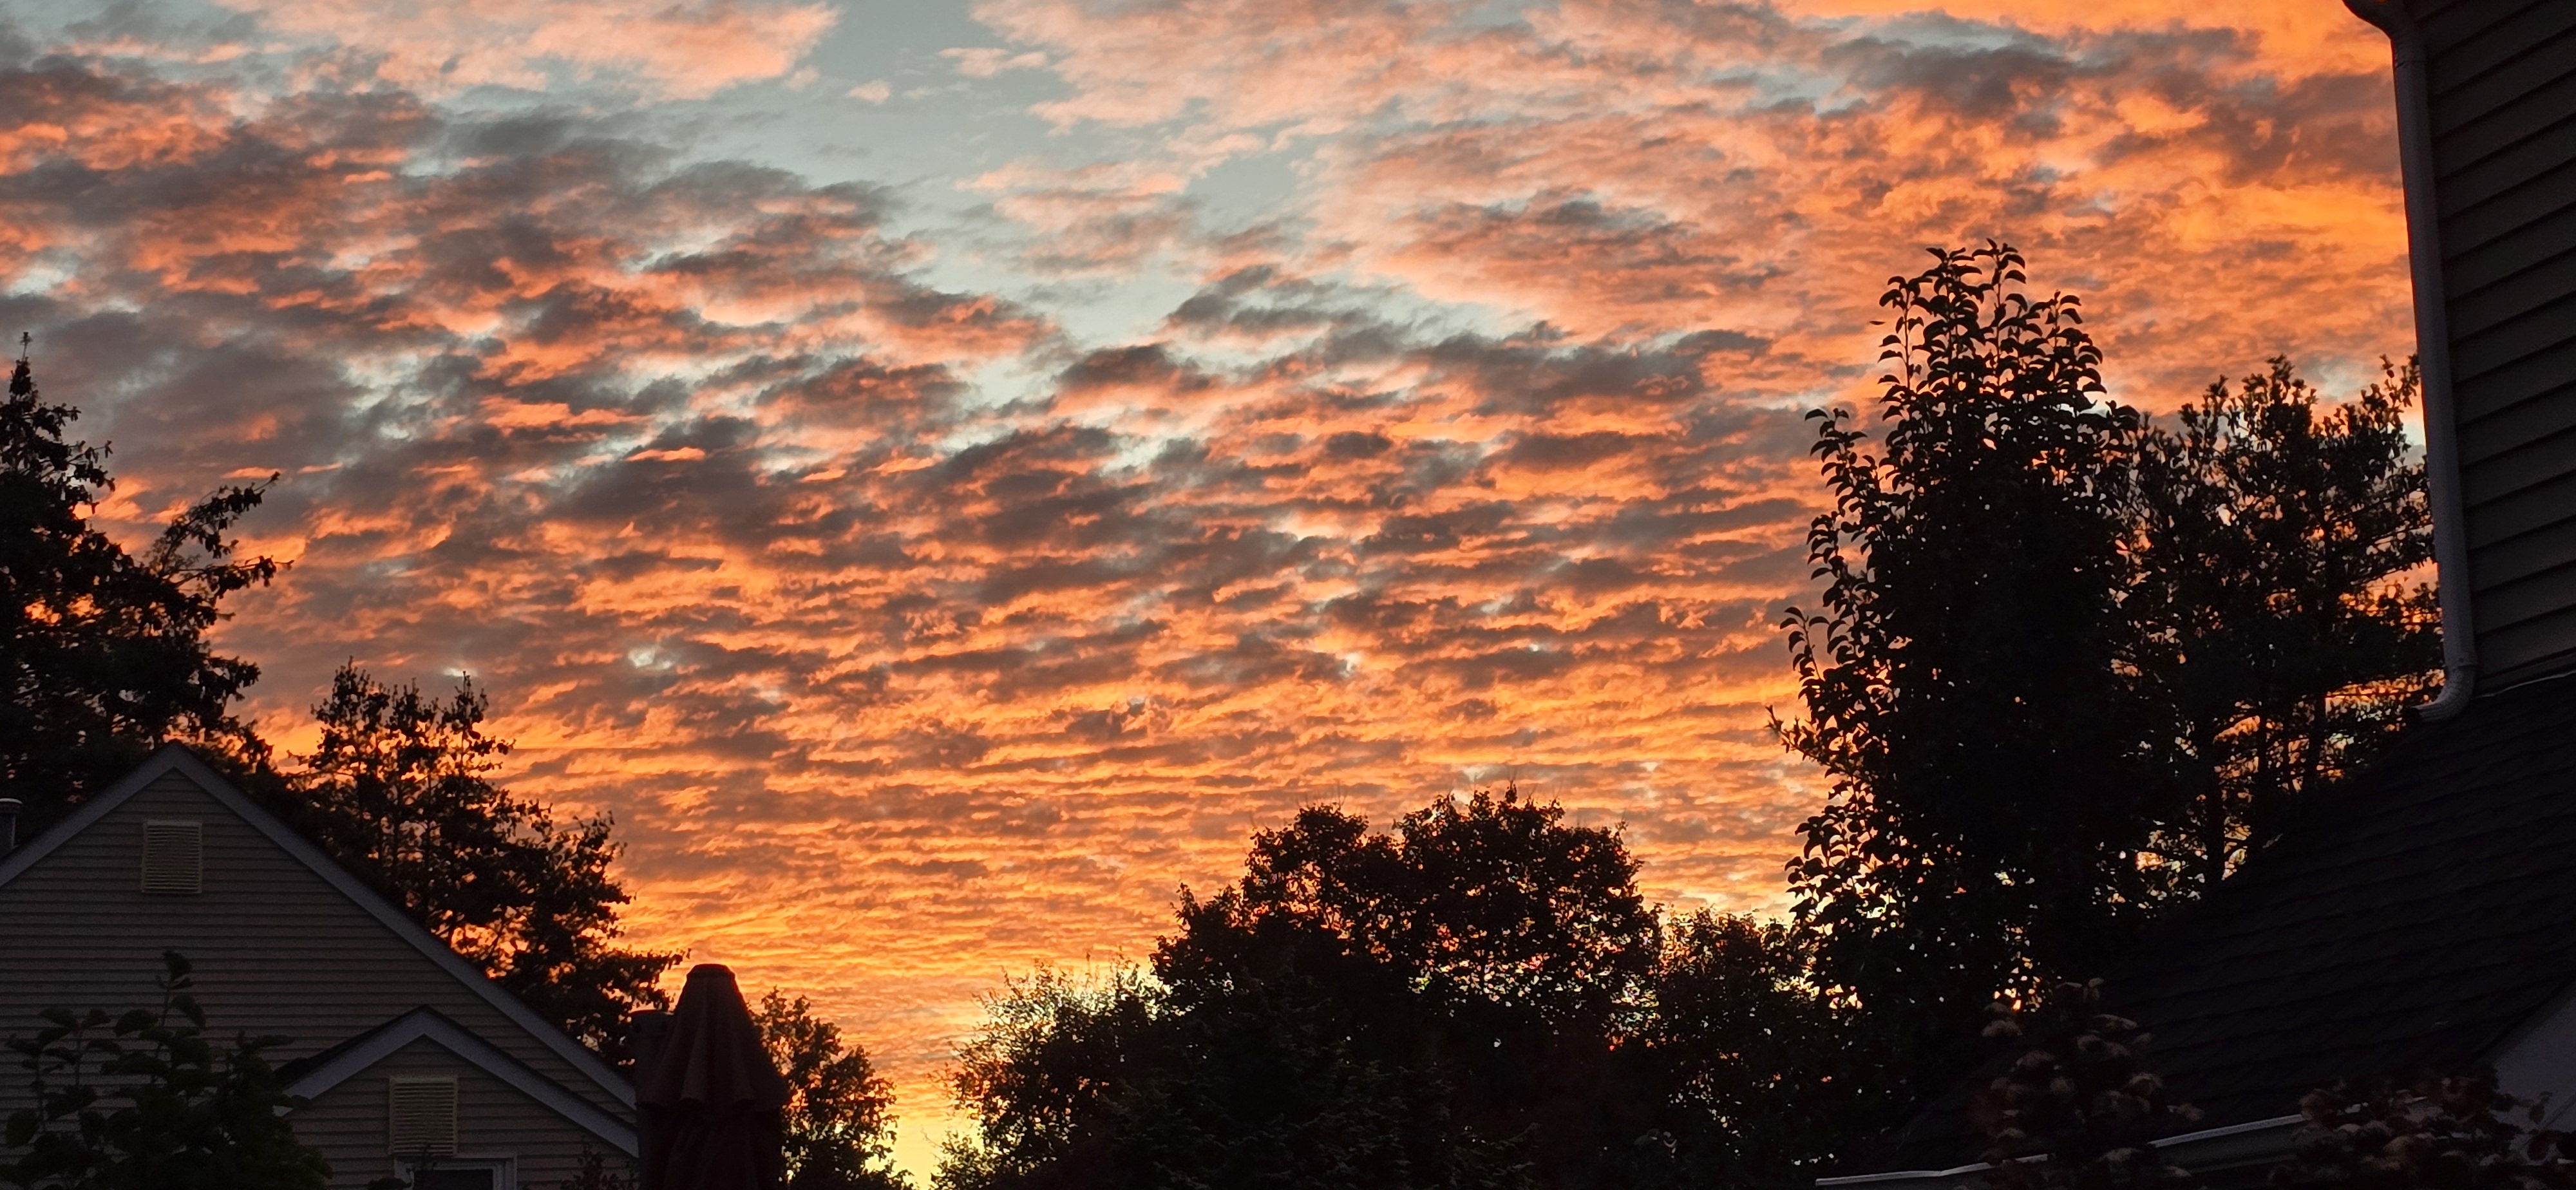
Notice the facts below how even that station that Charlie terms "consistent data" at Phoenixville was in reality missing around 20 years of data. from 1895 through 1914. Also take a look how those big 3 stations were all deeply discounted and adjusted downward. This includes both those stations that Charlie thinks are somehow heat island and those that are not....what again is the control arm used for these changes? How can the revised temperature not have any actual control station in the county that supports or aligns with the coolest station in the county? Instead NOAA adjusts to a figure so much lower with these post hoc altered adjustments to arrive at a revised temperature that is in fact not rooted at all to any factual temperatures of any stations at all in the entire county of Chester?
-
The normals aren't simple arithmetic averages. In fact, with the 1991-2020 normals, it looks like they were piloting some sort of new method of calculating them in Ohio, where the normals are significantly above the means. This is especially prevalent at Toledo, where the normal is an unbelievable 1.9F above the calculated mean. It appears to be a new methodology to factor in the warming trend, so more months are near or below average, instead of exclusively above average. Because of this change, even a "normal" year would be among the warmest ever recorded at Toledo. Just another way for them to hide the incline, I guess.
-
The above is a dystopian view not rooted in actual science, reality or facts....you point to faulty future state models to support your fears. Do you ever read what you post? The following words are why those that believe in some scary climate religion are now quickly losing followers. The fear mongering is pervasive in the above words and thoughts chosen by Don. He chooses words such as "crumbling coast" , "families watched helplessly", "erosion devoured", "tides insatiable pull", "ocean reclaimed", "destruction will spread", "societal sickness", "infection", "rejection of science", "sustainability breaks down", "deepening societal sickness", "narrowing window". Don where is this "tragedy of climate change"? All of those words and fear mongering you threw at us above only hurts the science you attempt to defend. This kind of narrative and post is exactly why folks are moving away from any belief that climate change is anything other than a typical cyclical occurrence. If we keep crying wolf like Al Gore about melting ice caps, increasing number of hurricanes, intensity and coastline obliteration followed by the verifiable facts failing to support these predictions this doubt about our future climate state will only deepen and spread....you can count on that!
-
Spooky Season (October Disco Thread)
GCWarrior replied to Prismshine Productions's topic in New England
Wait what are we tracking? Oh I see, tropical at hour 280 something with snow at the end potential. Be nice to get some snow in the high places before November 1st but please not here, still bike season, early snow is bad juju. Looks pretty nice the next few days until a little bit of rain Sunday night. -
No chatter on the impact of the block the rest of the month? While the Ideal Greenland Block shifts westward to Canada...its still a block and will be effective (I think) on sending eastward moving shortwaves Into negative tilt along and south of I80 for our area, the remainder of the month. That should mean additional meaningful rainfall and a couple good storms. I monitor ECAI my cyclic guide to what should happen as I find it particularly useful on yes/no. Not sure if anyone saw the CF-squall line gusts near 60 MPH vicinity Cape May Monday morning. Whether this occurs as attempted by the 05z EC OP 5-6 days in advance... it's a small possibility. No thread for us but bumpy flights eastern quarter of the country later Sunday-Monday morning and some decent 1-3" rains. I'll be curious as to the drought outlook changes eastern NJ/se NYS/CT when it posts tomorrow morning.
-
Need to watch for some severe storms on Sunday
-
Reminder: there’s a dedicated thread for this potential storm: https://www.americanwx.com/bb/topic/62328-e-mdr-aew-models-support-car-tcg-next-wk/
-
Gfs and euro both have a decent amount of rain on Monday
-
More on the 1987 record cold 1987 Unseasonably cold weather continued in the eastern U.S., with thirteen cities reporting record low temperatures for the date. The low of 34 degrees at Montgomery, AL was their coldest reading of record for so early in the season. Daily record lows included: Sterling (Dulles Airport), VA: 28°, Trenton, NJ: 30°, Allentown, PA: 30°-Tied, Columbia, SC: 32°-Tied, Harrisburg, PA: 32°-Tied, Macon, GA: 33°, Baltimore, MD: 33°-Tied, Parkersburg, WV: 34°, Chattanooga, TN: 34°, Islip, NY: 34 (later tied in 2006) °, Montgomery, AL: 34°, Bridgeport, CT: 36°, Augusta, GA: 36°-Tied and New York (Kennedy Airport), NY: 39°. Harrisburg, PA 32 °F (The National Weather Summary)
-
Records: Highs: EWR: 86 (1956) NYC: 84 (1956) LGA: 83 (2021) JFK: 82 (1975) Lows: EWR: 32 (1937) NYC: 32 (1876) LGA: 39 (2009) JFK: 37 (1999) Historical: 1608: Evangelista Torricelli, the Italian physicist and mathematician who invented the barometer was born on this date. In 1644, Evangelista Torricelli, built the first barometer with mercury. The aneroid barometer was made first in 1843, the French scientist Lucien Vidie invented the aneroid barometer. (Ref. AccWeather Weather History) 1876: Snow fell on the backside of a coastal storm from Virginia to New England. New York City, NY had its earliest 32° temperature and a half inch of snow. Fall River, MA reported 3.5 inches of snow. (Ref. AccWeather Weather History) 1880: This was the beginning of what was called the Mid West "Snow Winter of 1880-81". People were trapped in their homes and by the end of the winter it was reported snow was around 11 feet deep. 1880 - A violent early season blizzard raked Minnesota and the Dakotas. Winds gusted to 70 mph at Yankton SD, and snow drifts 10 to 15 feet high were reported in northwest Iowa and southeast South Dakota. Saint Paul MN reported a barometric pressure of 28.65 inches on the 16th. Railroads were blocked by drifts of snow which remained throughout the severe winter to follow. Gales did extensive damage to ship on the Great Lakes. (15th-16th) (David Ludlum) (The Weather Channel) 1947: People question attempts to weaken a hurricane by seeding it with dry ice after it made an unexpected turn off the coast making landfall near Savannah, GA with winds of 100 mph. One person was killed. Damage totaled $3 million dollars. (Ref. AccWeather Weather History) 1954 - Hurricane Hazel struck the Carolina coastline. The hurricane demolished every pier along a 170 mile stretch from Myrtle Beach SC to Cedar Island NC, and obliterated entire lines of beach homes. Hurricane Hazel also destroyed 1500 homes as it moved inland with seventeen foot tides. Winds between Myrtle Beach SC and Cape Fear NC gusted to 150 mph. Hurricane Hazel caused 163 million dollars damage, and claimed the lives of 98 persons. (David Ludlum) (The Weather Channel) 1954: By 11 pm on the 15th, Hurricane Hazel had reached and crossed the waters of Lake Ontario, still sporting sustained winds as high as 60 mph. Hazel took direct aim at the heart of Toronto as it roared past at 49 mph. Toronto saw heavy rainfall before Hurricane Hazel on the 14th. The previous storm, in combination with the hurricane, resulted in significant flooding. 1966 - Iowa experienced its worst late season tornado of record. In just one minute a twister tore through the town of Belmond leveling 75 percent of the businesses, and 100 homes, causing more than eleven million dollars damage. (The Weather Channel) 1984: The Monday Night Football game in Denver, Colorado, was played in a raging blizzard. 15 inches of snow fell with up to 34 inches reported in the nearby mountains. The Air Force Academy canceled classes for the first time in its' recorded history. 1987 - Unseasonably cold weather continued in the eastern U.S., with thirteen cities reporting record low temperatures for the date. The low of 34 degrees at Montgomery AL was their coldest reading of record for so early in the season. Lows of 32 degrees at Harrisburg PA and 34 degrees at Parkersburg WV marked their third straight morning of record cold. (The National Weather Summary) 1988 - The cold high pressure system responsible for the record low temperatures in the eastern U.S. began to move out to sea, giving way to a trend toward "Indian Summer". Thunderstorms developing ahead of a cold front produced golf ball size hail at Altamont KS and hail two inches in diameter at Yates City IL. (Storm Data) (The National Weather Summary) 1989 - Hurricane Jerry made landfall at Galveston, TX, at 6 30 PM (CDT). Winds at the Galveston Airport reached 75 mph, with gusts to 100 mph. Tides along the island were six to eight feet, and rainfall totals ranged up to slightly more than six inches north of Beaumont. Three persons were killed when their vehicle was blown off the Galveston seawall into the pounding surf. Total damage along the Upper Texas Coast was estimated at fifteen million dollars. Thunderstorms produced severe weather in Lower Michigan during the late morning. Two persons were injured when a tree fell on their camper at the Traverse City State park. While strong northerly winds ushered much colder air into the central U.S., unseasonably warm weather continued in the south central and eastern U.S. The afternoon high of 82 degrees at Bluefield WV was a record for October. (The National Weather Summary) (Storm Data) 2005: On this date through the 17th, the summit of Mt. Washington, NH reported 34 inches of snow. The 24-hour record for the most snowfall occurred when 25.5 inches fell in 24 hours. (Ref. Wilson Weather History) (Ref. WxDoctor)
- Today
-
58 / 52 partly cloudy and 96 hours of clouds finally gone with a brief return / warmup to the 70s for some (first since Oct 8th). Chilly next 48 hours before warming up this weekend and most sites getting back to low - mid 70s Sat for some Sunday for most. Front brings next round of storms/showers and rains Monday. Beyond there back and forth overall warmer than normal.
-

Occasional Thoughts on Climate Change
donsutherland1 replied to donsutherland1's topic in Climate Change
I think you sum things up quite well when you observe, "We ARE in a catastrophe, a slow moving one. Too slow to be seen in what we call 'real time', or human perception, but that slowness only beguiles us into a false sense of lessening urgency." The dismissive reply, “Sky is falling, sky is falling... no one believes our cyclical climate change is an issue anymore,” underscores the profound limits of human perception. Bound by the narrow window of our senses, humanity struggles to grasp processes that unfold across geological time. The fact that atmospheric CO₂ is rising at a rate an order of magnitude faster than during the Paleocene–Eocene Thermal Maximum defies societal comprehension. Likewise, the speed and scale of modern warming — occurring over mere decades — eclipses even the most abrupt natural transitions of the past. Science, meanwhile, becomes abstracted: detached from daily life and stripped of moral urgency, reduced to statistics that fail to move those in power. One can imagine a future, perhaps later this century or the next , unfolding not unlike this: Along the crumbling coast of a small seaside town, the waves crept higher each year. First they lapped at the boardwalk, then at the porches of modest homes, and finally, with one furious storm, they tore entire houses into the sea. Families watched helplessly as their memories — photographs, heirlooms, childhood bedrooms — vanished beneath the rising tide’s insatiable pull. Erosion devoured the land faster than insurance adjusters could arrive. Those who stayed were left standing on smaller and smaller fragments of earth, surviving on borrowed time. Eventually, the ocean reclaimed even those last fragile remnants. When the survivors turned to their government and neighbors for help, the answer was chillingly simple: “You should have protected your property. It’s your problem, not ours.” The same indifference that once ignored melting glaciers now ignored the people who had lost everything. The moral is stark: indifference to climate change protects no one. It merely ensures that the destruction will spread. Some of this future has already arrived. Insurers are withdrawing from entire regions. Empathy is receding just as the waters advance. Even on today’s smaller scales, societal compassion erodes as swiftly as the land itself. One sees the draining empathy in rising Nativism in various parts of the world, including but not limited to the United States, which is a symptom a broader and deepening societal sickness. In the U.S., that societal infection is being compounded by a growing rejection of science. Sustainability breaks down when the rate of change exceeds the rate at which society, ecosystems, and organisms can adapt to that change. When the gulf between nonlinear environmental upheaval and our linear, incremental responses becomes too vast, a system reaches its inflection point. It breaks or finds a new stable regime, that is not necessarily compatible with human welfare. The tragedy of climate change is not merely the loss of stability. It is the squandering of agency. Humanity still possesses the ability to act, though less effectively than if it had done so earlier. Humanity can still limit the damage e.g., perhaps to 3°C by 2100 rather than 1.5°C, assuming no big positive feedbacks. But bound by the limits of human nature, weak leadership, and an economic model that treats a finite planet as an infinite resource to be exploited, humanity continues to squander its narrowing window. Catastrophe is not sudden. It is cumulative. Arguably, humanity is already in the midst of the early days of rising catastrophe. -

Spooky Season (October Disco Thread)
CoastalWx replied to Prismshine Productions's topic in New England
I salute you -
Nice sunrise this morning

-

Central PA Fall Discussions and Obs
canderson replied to ChescoWx's topic in Upstate New York/Pennsylvania
The jet stream collapsing will be interesting for tropical storms. -

Central PA Fall Discussions and Obs
pasnownut replied to ChescoWx's topic in Upstate New York/Pennsylvania
Its always active in the atlantic, but if memory serves landfall canes were supposed to be above average. Thats my point. Upper air flow in eastern conus has been doing its thingy. -
Hi rcostell just an FYI a troll is someone who posts offensive, provocative or disruptive content that upset others under the cover of anonymity. I am not anonymous I appropriately reference all data. I have a weather website with clear links to all data. It is real and it is not fake. A poster cannot be a troll for simply posting actual real NWS data. Why would you or anyone be "offended" by the audacity of posting the raw climate data that you disagree with?? It is science being debated with facts - that is of course not trolling at all!
-

Spooky Season (October Disco Thread)
dendrite replied to Prismshine Productions's topic in New England
Thee. Not we. -
2025-2026 ENSO
donsutherland1 replied to 40/70 Benchmark's topic in Weather Forecasting and Discussion
Neutral-cool winters offer a mixed picture. There have been some good ones, one great one (the highly popular 2013-14), one horrible one, since 1980. 1980-81, 1981-82, 1989-1990, 2001-02, 2012-13, 2013-14, and 2016-17. By late fall, there could be stronger hints. The coefficient of determination for the WPO begins to ramp up in November. A predominantly negative WPO is a good sign for the winter; a predominantly positive one is not. Finally, based on subsequent research, the rapid buildup of snow cover in Siberia is not a good thing, if one is looking for a lot of Atlantic blocking. This research has suggested that a higher Siberian Snow Advance Index (SAI) is correlated with a positive AO. It also notes that the early inverse relationship found by Cohen et al., was an exception, not a rule. Excerpts: The running decadal correlations between the SAI_OCT and AO and SAI_NOV and AO are shown in Fig. 7d and e, respectively. In the former, there are significantly more positive than negative values (Table 3), suggesting that the period of strong positive (negative as defined here) correlations that occurred in the 1990s and 2000s, as described by Cohen and Jones (2011), was a rather exceptional event, as previously noted by Peings et al. (2013). Indeed, the frequency of decades with significant SCA_OCT–AO correlations of either sign are not significant. In addition to the recent period in the 2000s, Fig. 7d reveals a period of significant negative correlations centred in the 1840s, also present in the 21-year data (Fig. S4d). Finally, the ERA5 data reveal that the recent period of the statistically significant negative relationship between SAI_OCT and the AO has ended: the most recent decades have positive r values. -
Spooky Season (October Disco Thread)
UnitedWx replied to Prismshine Productions's topic in New England
It's fun to have at least something to watch... but I'm more interested in the pattern after this time frame. Gut says the first cold push is waiting in the wings. I really need to finish my re-insulation prOject at the house! -
Looks amazing for my foliage excursion up there tomorrow! All indications are it has been pretty solid so far.
-
0z Euro in the long range had Sandy Jr-esque 500mb look...


(002).thumb.png.6e3d9d46bca5fe41aab7a74871dd8af8.png)