All Activity
- Past hour
-
partly cloudy here 73
-
-

2026-2027 El Nino
40/70 Benchmark replied to Stormchaserchuck1's topic in Weather Forecasting and Discussion
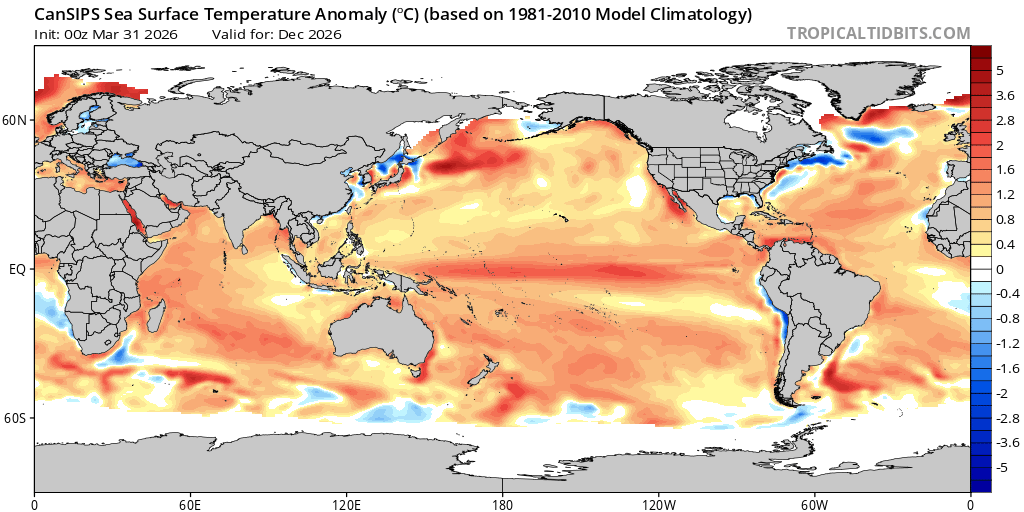
@bluewaveLooks to me like the Pac jet was up to it's old tricks again in March, as the blocking for met winter abated and the MJO, albeit largely favorable, remained weak. -
Yeah clouds rolled in quickly here...went from nice and bright to probably needing to turn a light on
-
kdix back up!
-
Too many effing clouds
-
Poppin
-
77 out. Nice breeze out there helping to keep my AC off with West to East cross ventilation. Getting the smells of the Frederick Co. farmland wafting in.
-
2026-2027 El Nino
40/70 Benchmark replied to Stormchaserchuck1's topic in Weather Forecasting and Discussion
Yea, I could buy some vestige of it remaining, but it's probably overdone. -
These shots are beautiful and show the trees in a different light. The oldest Ms. J is graduating from AU in May and her and her friends have their gowns. But they chose to not take graduation photos with the cherry trees in full bloom. It is a part of DC but it is not DC to them if that makes sense. One shot Ms. J wants is in her gown standing at the Tenleytown-AU metro sign as she will be mourning the loss of her UPass.
-
2026-2027 El Nino
LakePaste25 replied to Stormchaserchuck1's topic in Weather Forecasting and Discussion
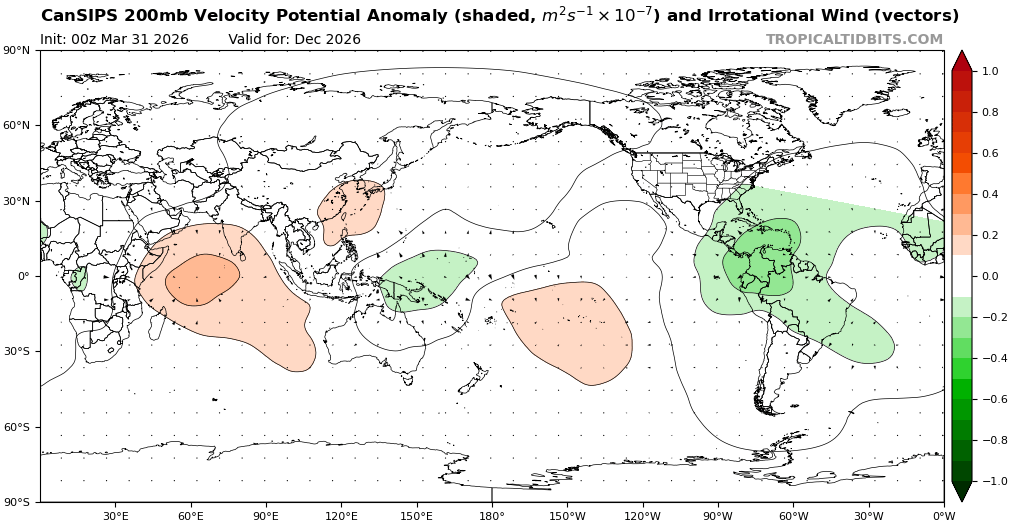
I see it has some split forcing showing up with some lingering convection in the west pacific. Also appears to be more basin-wide. I agree - i think a +TNH outcome like that is probably overkill even if there’s split forcing.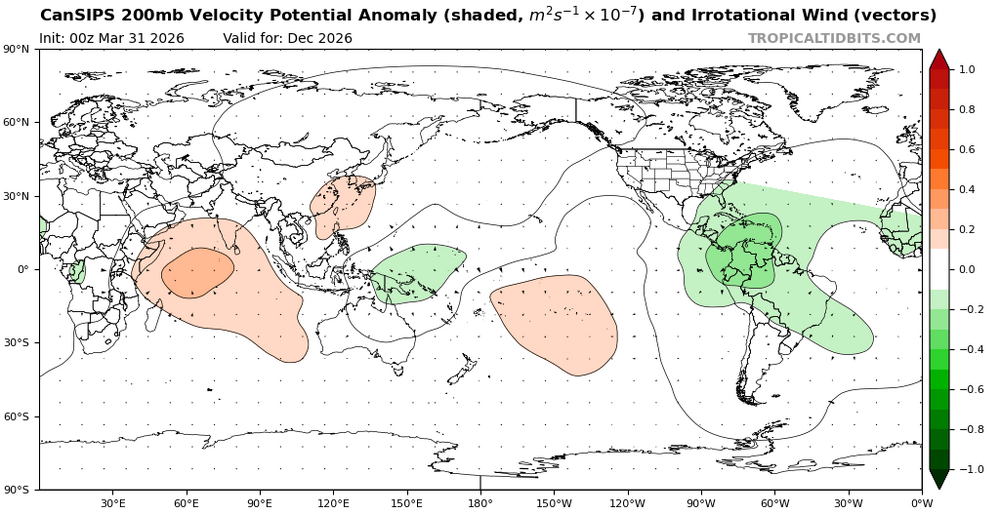

-
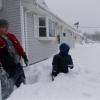
Amazing how fast stuff popped these last two days . Went from Chernobyl to Augusta National
-
Agreed ... Brian and I have had this discussion in the now distancing past but again, those heat explosions that took place in the Pac NW and London ...SE Asia, step country of the Urals, Moscow and Austrialia ...those were all synergistic events. That's when several factors, not just the synoptic footprint, feed back and the modeling technology just doesn't really do that? SO you end up with product that far surpasses expectation. The closes we've come to seeing that E of the Mississippi Valley and N of the Mason Dixie, in modern era whence these synergistic heat waves became a recurring global phenomenon, is the 2012 heat wave. However, that was restricted to far SW and was squeezed further S and eventually demolished by a massive Derecho/processing event. Simply put, we have not had one here. Despite 102 once in awhile, that's not it. We could possibly argue that the May heat up in Ontario the bled into NNE a couple years around the early 2020s but 90s mmm there was some resonate feedback going on there, but it was mostly just lacking the DP input into those that drove that. It was multi-sourced and "bursting" over modeling either. I've actually begun to suspect that it is harder for this area to achieve the synergy. We just have too many available negative inputs... squeezing our circumstance manifold down to lesser ways to get that to happen - it becomes lower odds.
-
34F and dreary.
-
Nope, mind posting?
-

2026-2027 El Nino
Stormchaserchuck1 replied to Stormchaserchuck1's topic in Weather Forecasting and Discussion
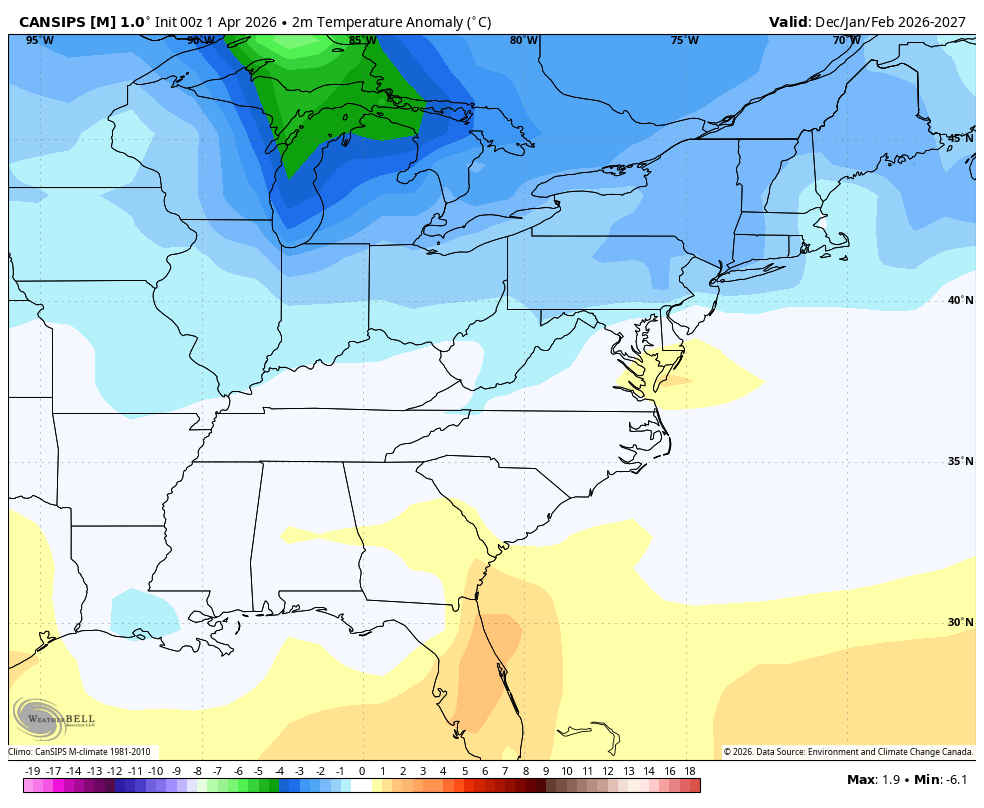
^CPC was putting out long range Winter outlooks that looked like that: warm in the SE, cooler in the NE. Then last month they updated with a full on El Nino composite for the Winter. -

Central PA Spring 2026 Discussion/Obs Thread
Jns2183 replied to Voyager's topic in Upstate New York/Pennsylvania
That 68 wind guest should be 28:for Harrisburg, haha Sent from my SM-S731U using Tapatalk -
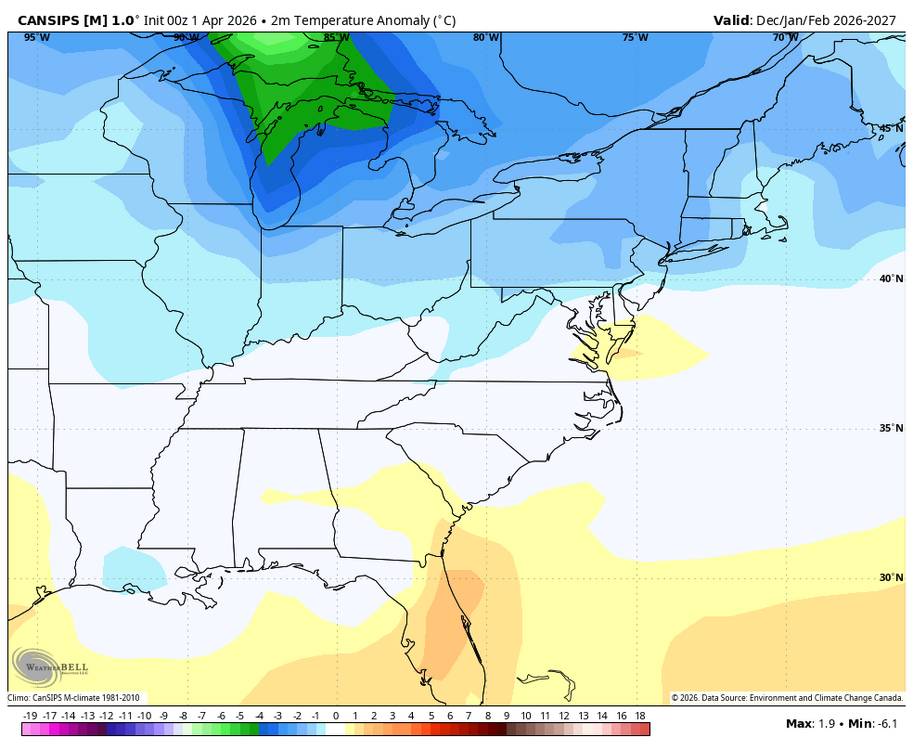
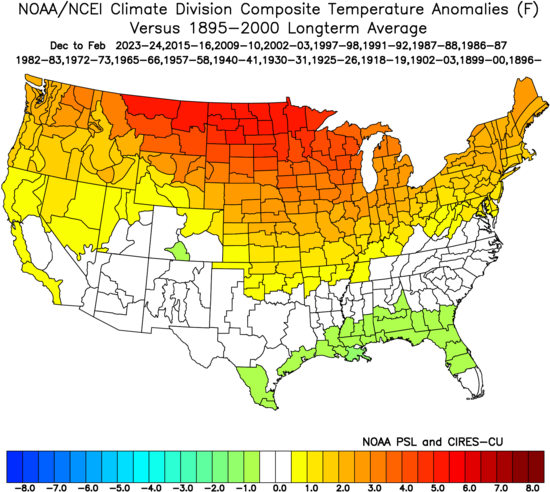
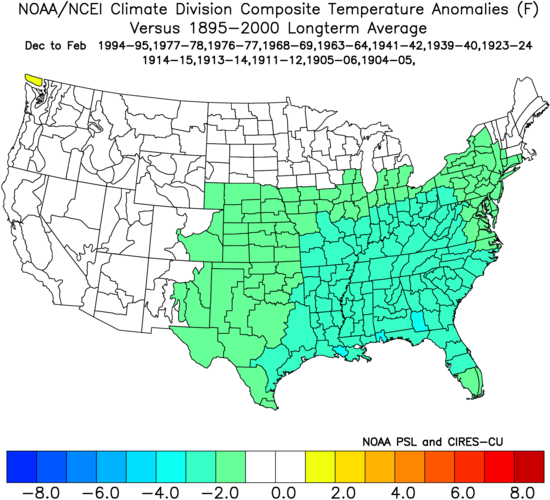
The new Cansips has winter anomalies significantly colder in the NE than the SE: For all of the Ninos peaking at +1.5+, not a single one going back at least to 1895-6 had a colder NE than SE anomaly wise! Not even one! These are the winters: 2023-4, 2015-6, 2009-10, 2002-3, 1997-8, 1991-2, 1987-8, 1986-7, 1982-3, 1972-3, 1965-6, 1957-8, 1940-1, 1930-1, 1925-6, 1918-9, 1902-3, 1899-00, and 1896-7. That’s 19 winters, a nice sample size suggesting the CANSIPS E US winter temp. anomalies and a strong El Niño prog aren’t at all jibing with history. Here is the aggregate of those 19 winters: Edit: Even going all of the way down to peaks of +1.0 yields the same result, no winter colder in NE than SE. That adds 13 more for a total sample size of 32! Here’s the average of the 13 moderates:
-
2026-2027 El Nino
40/70 Benchmark replied to Stormchaserchuck1's topic in Weather Forecasting and Discussion
Ask the White House... -
 Yes. That would be better. The instrument details mentioned by @chubbs could still play a role at some sites.
 -
BDL hit 80 yesterday. 70 here currently. Rapid green-up underway. Just saw some forsythia really starting to pop on my walk.
-
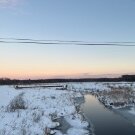
Nice, been there a couple times. It’s worth it for the experience. Kenwood is another spot, though I gotta think the homeowners get annoyed sometimes lol. One of my weird hobbies is trying to predict the time based on the moon phase and location in the sky. The moonset of what looks like a 10-11pm moon phase lines up with those predawn pics.
-
Central PA Spring 2026 Discussion/Obs Thread
Jns2183 replied to Voyager's topic in Upstate New York/Pennsylvania
MOS WHACK A MOLE I've learned way way too much about this over the last couple months so now you get to also. If you ever wonder why a new version of the GFS is in training forever it's MOS, it is always MOS MOS is basically not “an equation.” It’s a bloated empire of site-by-site statistical band-aids. At one station like MDT, a single MOS package can involve hundreds to over a thousand equations once you break out forecast hour, variable, and category thresholds. Then double it for warm vs. cool season. Now spread that across 2,000 sites and multiple guidance systems, and you’re dealing with millions of regression equations. So when model physics gets changed upstream, MDL doesn’t get a fun little tune-up. They get to play nationwide statistical whack-a-mole because half their bias-correction patchwork may now be off. That’s the whole game. MY next little project until I recover from winter storm data burnout is one I'm almost halfway through. A fun little deep dive into the various MOS for the the GFS, NAM, HRRR, NBM and a 10 year (8 year for NBM);statistical analysis of forcasting skill by them for KMDT using about 25 metrics from NWS and Research Papers for every variable that can be seen, computer, derived from data record of KMDT. And think. This skill is after a couple thousand linear regression equations to brow beat NAMs drunken benders Sent from my SM-S731U using Tapatalk -
2026-2027 El Nino
Stormchaserchuck1 replied to Stormchaserchuck1's topic in Weather Forecasting and Discussion
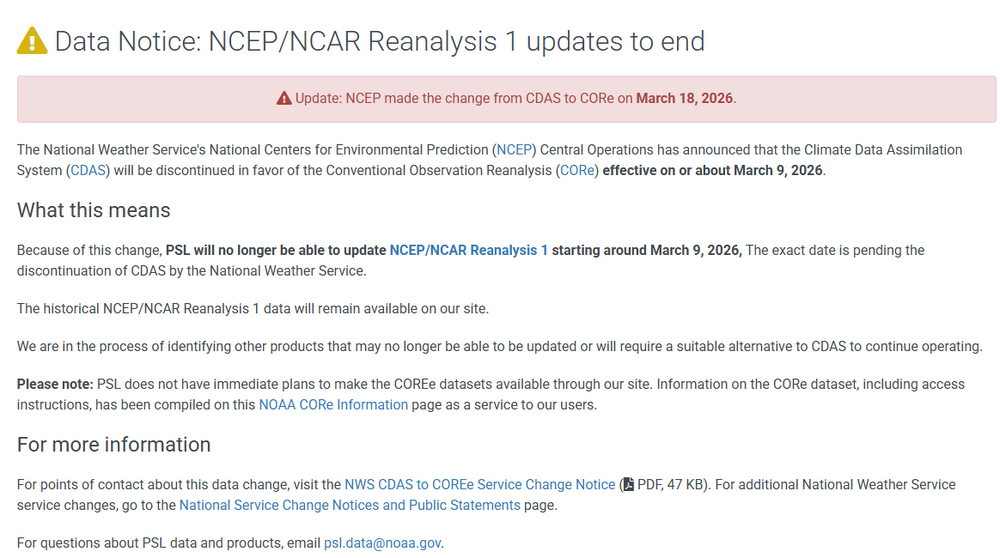
Oh no! That's the best site on the internet! Why the heck would they stop it? - Today
-

Central PA Spring 2026 Discussion/Obs Thread
Itstrainingtime replied to Voyager's topic in Upstate New York/Pennsylvania
March stats are in from Lanco: There were certainly more "ups" than "downs" on the wild March 2026 temp rollercoaster, and those "ups" were also much more significant than the "downs." As a result, it concluded as the 8th-warmest March on record.