All Activity
- Past hour
-

2025-2026 ENSO
40/70 Benchmark replied to 40/70 Benchmark's topic in Weather Forecasting and Discussion
https://easternmassweather.blogspot.com/2025/08/preview-of-polar-domain-for-winter-2025.html
-
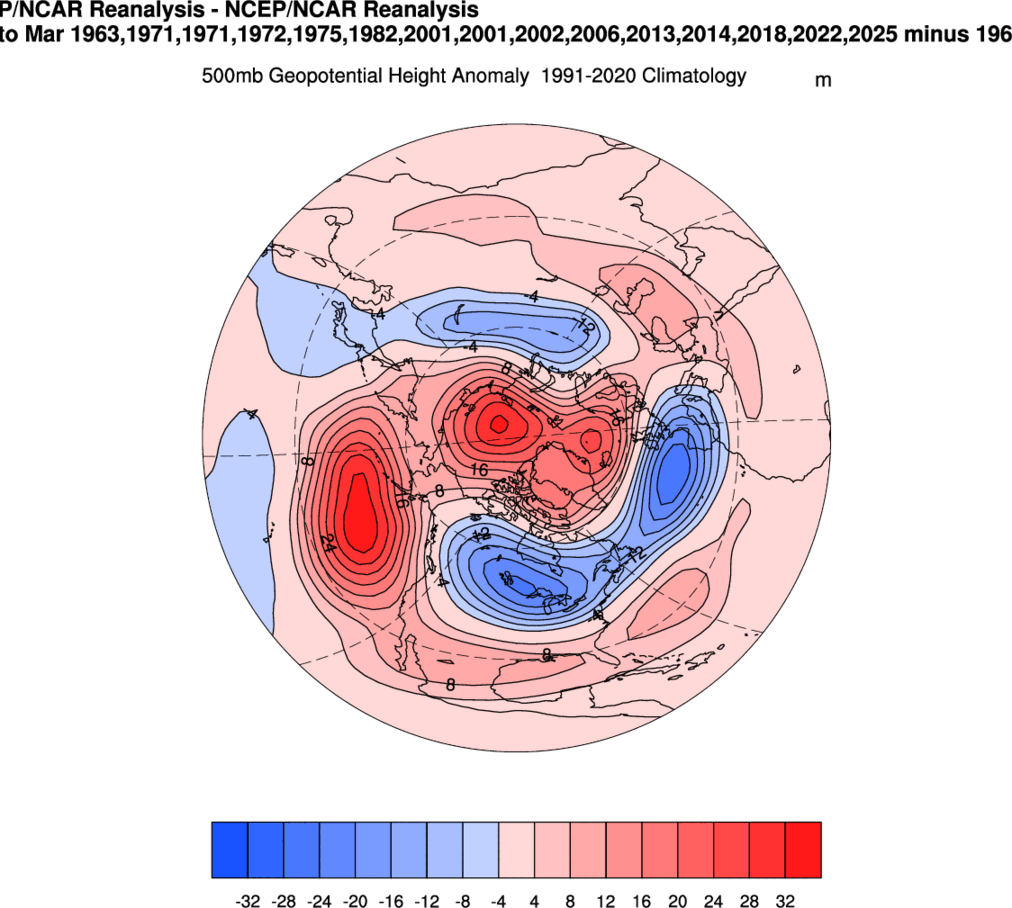
Preview of the Polar Domain for Winter 2025-2026 Preview of the Polar Domain for Winter 2025-2026 Solar & Stratospheric Influences on the Arctic Ramifications of the Peak of Solar Cycle 25 on the Higher Latitudes Perhaps the most inconspicuously integral driver of the earth's atmosphere, and thus the most logical starting point for any sound analysis there of is the sun. Indeed, our weather is driven by the inexorable and constant quest of the earth to achieve balance via the poleward redistribution of this immense amount of solar heat that is concentrated near the equator. Needless to say, the behavior of the sun of kind of a big deal, which makes the waxing and waning of sunspots known as the solar cycle a prudent place to start when examining the potential behavior of the higher latitudes for the coming winter. Although not an absolute certainty, NASA has determined that there is approximately a 90% chance that the peak of solar cycle 25 has already occurred, during October 2024. There admittedly remains more questions than definitive answers regarding the impact of the solar cycle on the behavior of the polar domain, which means that much like the frontier science of seasonal forecasting in general, it is still very much a work in progress. The central question that continues to elude modern research is the precise mechanism by which the solar cycle affects the polar fields, which also renders the exact lag time between altered levels of UV radiation and the sensitivity of the polar vortex there of nebulous. Identification of Solar Driver is Key Traditionally, research has correlated high levels of solar activity near or shortly beyond solar max, such as will be the case for winter 2025-2026, to a stronger polar vortex and thus milder winters for much of North America and Europe. There have been studies that have cited sensitivity to solar influence among many different polar elements, including polar temperatures and Geopotential heights in the stratosphere (Labitzek, 2005), as well as in the troposphere (Van Loon and Labitzek, 1988) and the NAO via Atlantic and European sea level pressure patterns (Korea, 2002). However, while there seems to a consensus around the concept of some type of solar modulation of the polar domain via altered stratospheric and tropospheric circulations, there exists a multitude of theories as to the solar driver of said relationship. Many theories cite factors such as UV radiation and total solar radiation (TSI), which closely mirror sunspot activity, as responsible for increasing ozone levels and temperature in the equatorial stratosphere. The "top-down" theory argues that enhanced ozone levels and warmer temperatures resulting from increased solar UV warm the tropical stratosphere and produce a stronger latitudinal gradient and a modulated Brewer-Dobson Cycle, which is transferred downward in the atmosphere and poleward at the surface to result in a cooler polar stratosphere (stronger polar vortex) (McCormack and Hood, 1996). Conversely, the more dubious and so-called "bottom-up" theory posits that the enhanced solar heating of the equatorial ocean surface during solar max results in the transfer of latent heat to the upper levels of the atmosphere through increased evaporation. This heat is then carried to a convergence zone by the trade winds, which triggers a positive feedback that ultimately impacts the North Pacific and Arctic. Both of the aforementioned theories would entail that the greatest propensity for +NAO due to this solar-stratosphere connection would coincide with solar max. However, more recent research cites stronger drivers that do not coincide with solar max, such as geomagnetic energy and solar winds, which peak about two to fours after solar max in terms of peak UV and TSI . (Maliniemi et al, 2014). Malimiemi et al theorize that geomagnetic energy makes its way into the polar region via the process of energetic particle precipitation, which then produces nitrogen oxides in the upper atmosphere that have a protracted period of time to descend downward and increase ozone during the polar winter in the absence of any sunlight. This consequently cools the stratosphere and strengthens the PV, which more closely corroborates with other recent research citing drivers that do not peak at solar max, as defined by UV and TSI. The implication of this is that the +NAO response peaks during the descending portion of the solar cycle between approximately 2-4 years after solar max (presumably October 2024) and in the vicinity of Geomagnetic peak, which is depicted in the forecast graphic above as roughly summer 2026. This implies that while winter 2025-2026 is certainly predisposed to averaging a +NAO in the seasonal mean, perhaps the subsequent seasons of 2026-2027 and 2027-2028 will feature an even stronger bias towards an more stout polar vortex. The inference here is that although winter 2025-2026 is highly likely to feature a +NAO in the seasonal mean, solar implications are certainly not prohibitive to spacmodic warming of the polar stratosphere during favored intervals. The work of Maliniemi et al also showed that this relationship is not at all dependent on overall sunspot activity due to intra-cycle variability. Malimiemi found that the declining phase of the sunspot cycle remarkably consistently produces the spacial pattern of surface temperature anomalies related to the positive NAO during the last 13 solar cycles" (Maliniemi et al, 2014). Mean winter NAO index values for the four cycle phases, averaged over cycles 11 to 23. The red line represents the overall mean value of wintertime NAO (0.05). Bars represent the 95% confidence intervals. Incidentally, the study also found that both the solar max and the ascending portion of the solar cycle are weakly correlated to a colder pattern redolent of the -NAO, although this weaker correlation is more dependent on intra-cycle variability of activity and potentially discrepancies in the calculation of the NAO domain. There is also a modest negative correlation between the NAO and the solar minimum. These relationships between solar behavior and the NAO are also illustrated in the graph below, with reds, denoting +NAO, very evident in the declining phase of the last several solar cycles. And blue, indicative of -NAO, prevalent in the ascending portion of the cycles. What is clear from the research is that there exists a lag of approximately 1-4 years for the maximum impacts of variation in solar irradiance to manifest by way of polar modulation. This lag has been attributed to discrepancies with respect to the solar driver. Early research cited peak UV in the vicinity of solar max as the main driver with a lag of approximately 1 year, with more recent research settling on a 2-4 year lag centered on the geomagnetic peak during the descending phase of the solar cycle. The Eastern Mass Weather critique of many of these theories is that they largely neglect the role of the Atlantic in the modulation of the NAO, which is undoubtedly involved in an solar sensitivity of given that the index is derived from Atlantic and European sea level pressure patterns. Lagged North Atlantic Climate Response to Solar Variability The atmosphere in its truest essence is the oft delayed feedback between the land, sea and air that serves to budget the immense degree of solar energy that is concentrated around the equator by redistributing it upward. First in altitude via the convergence and upward ascent of air due to convection, which is a term referring to concentrated areas of showers and thunderstorms. Then eventually poleward by both major storms such as hurricanes, which are essentially spinning gyres of convection, as well as ocean currents and oscillations. This epitomizes how the cycle of ocean and air processes act to budget heat around the globe, which was touched upon in an oblique manner when referencing the interplay between the sun and the poles at work in the "bottom-up" theory. The work of Sciafe et al, 2013 is revolutionary in that it ostensibly bridges the previously discussed works concerning polar sensitivity to the solar cycle with prior research (Czaja, 2002) positing a 6 month lag between the leading of the NAO by the 500mb pattern over the Atlantic. The work posits the Atlantic has a sensitivity to solar UV variability that triggers an immediate atmospheric signature that takes several years to accumulate in the subsurface of the ocean, during which time the atmospheric response progressively increases as part of a coupled feedback between the ocean and atmosphere. The response continuously projects onto the winter North Atlantic Oscillation and the familiar tripole pattern in North Atlantic sea surface temperature as referenced by Cjaza et al (2002), with a lag time of 2-4 years (Sciafe et al 2013). Thus is it is reasonable to conclude from the preponderance of evidence owed to a multitude of varied research efforts that changes in solar irradiance along the progression of the solar cycle trigger instant surface responses that progress through the subsurface and then ultimately resurface through a process of meridional overturning. This reemergence fosters a delayed feedback (6 months) between the sea and air that can be self-sustaining. Member stormchaserchuck1 at Americanwx.com weather forum has put this theory into practice. His index consists of a measurement of May 1 - Sept 30 SSTs in the North Atlantic. It's correlated to following November-March NAO/AO (+6 month lag). The index is a composite of 2 areas in the North Atlantic (blue box - red box). Because the northern area has more volatility, the total dataset, SSTs and NAO were normalized by multiplying the total historical absolute number of both, and dividing it by each other. When blue box is cold SSTs, a negative NAO is implied for Winter. When red box in warm SSTs, a negative NAO Winter. For comparison, and red box is 65% value of blue box anomaly (so -1 blue +0.65 red is same thing). Visa versa. The index this year from May 1 through early August (61% of the way through) is about +0.20, making it a 50% chance of having the DJFM NAO -0.34 to +.74 This slight hedge towards a positive NAO in the DM mean seasonal calculation is consistent with the nascent portion of the descending phase of solar cycle 25 within two years of solar max, which presumably occurred this past October (2024). Given that there is no overwhelmingly strong solar signal concerning the polar domain for winter 2025-2026 it will be crucial to explore the stratosphere concerning potential periods of vulnerability for the polar vortex. Diagnosing the State of the Polar Vortex for Winter 2025-2026 The system of cycles and oscillations that occurs throughout the tropical atmosphere extends high above the waters of the ENSO region. And all of it plays an integral role in modulating the atmosphere across the entire span of the globe. The Quasi Biennial Oscillation (QBO) is an atmospheric phenomenon marked by a circuit of zonal winds measured at 30mb and 50mb, which run in dual bands throughout the equatorial stratosphere. Each band oscillates from an east to west direction with height, while propagating downwards until its dissipation at the top of the tropical tropopause. Currently the QBO is descending after recently having entered its easterly phase at both the 50mb (May) and 30mb (July) levels. It is an absolute certainty that it will remain in the easterly phase at both levels throughout the impending winter given that it takes several months to bottom out before recovering towards a new westerly phase. Considering the expectation for a modest cool ENSO event for winter 2025-2026, here are the best match QBO analogs as per the July values. July 2024 50MB QBO: -2.06 & descending 2021: 2.82 & descending 2017: 5.08 & descending 2012: -8.10 & descending 2007: -8.75 & descending 2005: -8.13 & descending 2000: 3.25 & descending 1974: -3.42 & descending 1970: -8.05 & descending 1962: -3.08 & descending July 2024 30MB QBO: -19.19 & descending 2021: -13.17 & descending 2017: -10.48 & descending 2012: -27.82 & descending 2007: -24.92 & descending 2005: -24.20 & descending 2000: -13.13 & descending 1974: -19.58 & descending 1970: -18.62 & descending 1962: -15.49 & peaking A composite of these analogs provides an early conceptualization of the state of the higher latitudes for this winter season. Note the marked tendency for both poleward Aleutian ridging and NAO style blocking in the DM seasonal composite. Given that the QBO will be in its Easterly phase this season, the above composite is consistent with research that concluded that the polar vortex is more prone to disruption from Sudden Stratospheric Warmings (SSWs) earlier in the season per what is referred to as the Holton-Tan relationship. This is due to the fact that the default direction of the zonal winds in the polar region is from the west, thus an easterly QBO is more likely to lead to disruption, or even a reversal of these winds in the case of a technical SSW (Holton, Tan 1980). Additionally, it is also theorized that easterlies in the stratosphere more foster the development of a stronger Aleutian high, which is more conducive to the development of said SSWs. The full reversal of zonal winds that constitutes a technical SSW subsequently leads to either a splitting or displacement of the PV. The inference here is that although a positive NAO is favored in the DM seasonal mean per previously referenced research on years descending from solar max, the easterly QBO is likely to be the catalyst for significant period(s) of high latitude blocking given that solar geomagnetic peak, which provides the most resistance to PV disruptions, will not be reached until roughly next summer. Research by Gray et al, 2004 elaborates on the complex relationship between the solar cycle and the QBO phase. Integrating Solar & QBO Research for a Comprehensive Polar Forecast The aforementioned Holton-Tan relationship, which dictates that an easterly QBO is correlated with both a greater incidence of, and an earlier development of SSW, becomes more complicated when considering the solar cycle. In some cases, when the QBO and solar cycle are in conflict, they can either over ride one another or even cancel each other out (Gray et al 2004). Here is a list of combinations and the theorized relationships for clarity. Solar min/W QBO: This is entirely consistent with the Holton-Tan relationship in that the westerly QBO essentially "wins". The PV is likely to be stronger than average until the final warming in spring. Solar max/W QBO: In this case, the Holton-Tan relationship is applicable early on in the season, as major warmings are unlikely. However, the Holton-Tan relationship reverses mid winter and the latter portion of the season from February onward is susceptible to warmings and major PV disruption. Winter 2024-2025 was a textbook example of this. Solar Min/E QBO: There are no inconsistencies here, as the entire season is more prone to polar vortex disruptions and SSW as per the Holton-Tan relationship. Solar Max/E QBO (2025-2026): The Holton-Tan relationship applies early on given that PV disruptions are likely in December, before the relationship reverses and they are less likely later in the season. The final warming is of course the exception to this rule, while it is usually more relevant for spring, it can and does sometimes occur early enough to have an impact for the major population centers in terms of late season cold and/or snowfall. Below are a couple of annotations to aide in the simplification and visualization of these relationships. Interestingly enough, although statistically speaking early and late season disruptions are favored, there is a an outlier set of major PV disruptions noted in the solar max/E QBO quadrant of the chart above. This also becomes a theme when comparing the solar QBO analog composites. Here is a list of cool ENSO/ solar analogs for the winter 2025-2026 season. Here is a DM composite of these seasons. There are obvious similarities between the Solar composite (right) and the QBO composite (left) given that they both feature high latitude blocking and poleward Aleutian ridging. The primary difference is that the QBO analog composite is biased more towards early and late season NAO blocking, whereas the solar composite focuses the NAO blocking more in the early portion of the season. The discrepancy is primarily with respect to late season owed to the aforementioned outlier set of mid winter PV disruptions, which is evident in the list of SSW analogs compiled from the solar and QBO composites, respectively. January 17, 1971: PV Split December 4, 1981: PV Displacement February 11, 2001: PV Split January 2, 2002: PV Displacement February 22, 2008: PV Displacement January 7, 2013: PV Split February 14, 2018: PV Split March 20, 2025: PV Displacement The majority of the SSW events are split between the mid winter months of January and February with three events per month. There is also an outlier event in December, 1981 and March 2025. The primary analog events of January 17, 1971 and February 11, 2001 were both accompanied by PV splits and are the only two members to appear in both of the QBO and solar analog composites, which lends more credence to the mid winter outlier scenario that contains 6/8 the analogs. Thus the favored timeframe for a SSW and subsequent split of the polar vortex is during the January 14 to February 14 timeframe, which favors late season NAO blocking to commence roughly between February 8 through March 6. Now that an a reasonable consensus for the evolution of the polar domain during boreal winter 2025-2026 has been reached through a thorough examination of the relationship between the solar cycle and the QBO state, a more thorough consideration of ENSO is the final step before a preliminary winter composite can be made. How La Nina Intensity & Orientation can Impact the Polar Fields Below is a juxtaposition of all weak (left), moderate (center) and strong (right) La Nina events dating back to 1950 in which intensity has been assigned via a personalized assessment of ONI, MEI and Relative Ocean Nino Index. There are some subtle differences between the weak and moderate composites that grow more pronounced in the strong composite that can have important ramifications with respect to the seasonal polar fields. When viewing the 500mb composites above, it is evident that there is significant poleward Aleutian ridging in the weaker La Nina composite, as well as a greater susceptibility to higher latitude blocking in general. It's these greater heights at higher latitudes that aid in the delivery of colder air across North America. The strong composite is much more subdued with these higher latitude heights and instead more pronounced with southeastern ridging. These differences are illustrated well in the temperature composites below. The primary reason why the weaker La Nina composite is significantly cooler across the eastern US is because the distribution of the SST anomalies is biased to the east, which has a significant impact on the placement of the Hadley Cell, and thus the orientation and placement of the Aleutian ridge that either augments or inhibits the delivery of cold air south and eastward. Note the disparities in forcing that are evident in the velocity potential composites below. It is apparent that the eastern-based La Nina SST anomaly composite on the left is the weakest of the three composites. This is due to the fact that a weaker cool ENSO Walker Cycle inherently means weaker easterly trade winds, which are responsible for fostering both the development of La Nina, as well as the progression of cooler waters westward. Thus diminished trade winds entail a weaker cool ENSO event that is more relegated to the eastern zones. This means that generally speaking, not always, weaker events are more east-based and stronger events tend to fall more on the Modoki end of the spectrum since they are the most mature. The implication of this is that the same contrasts noted previously between weak events and strong events also exists between east-based La Nina events and Modoki episodes, which has a similar effect on the respective temperature composites. This is very similar to the intensity composites in that it is the tropical SST orientation that largely dictates the placement of the convection that is so crucial to the configuration of the Hadley Cell, which ultimately determines the weather pattern in the mid latitudes. It is evident in the composites below that descending air is aligned with the core of La Nina, and convection inducing ascent is focused over the Maritime continent that aligns with MJO regions 4-6, which is usually more unfavorable for high latitude blocking. Clearly strong and Modoki La Nina composites have a much larger degree of subsidence in the general vicinity of the dateline, which inhibits variation from these phases. This is why this particular forcing regime is fairly hostile to high latitude blocking and creates such a great variation in regional climate relative to its more eastern biased and weaker cool ENSO counterparts. The distinction coupled with a proper diagnosis is an integral part of the seasonal forecast since the difference between La Nina winters that have a -AO vs a +AO is significant. Here are -AO La Nina winters in the CONUS (leaving out cool neutral years) vs the +AO La Ninas. These key differences have implications with respect to not only informing the degree of high latitude blocking that may or may not materialize over the course of the ensuing winter season, but also the timing of any such occurrence. Additionally, these SST anomaly patterns result in large differences with respect to the extratropical oceanic circulation over the Pacific and Atlantic, which acts to feedback on and sustain the resultant pattern over the polar domain. Disparate Seasonal Evolutions & Oceanic Circulation Patterns of La Niña Types It is evident in the graphic below that Modoki and basin-wide events often feature the seasonal nadir for the NAO near the bookends of the season in December and March. In contrast, east-based events are more likely to feature mid season NAO blocking in the middle portion of the season, which is important to note considering that the developing cool ENSO event is expected to remain both weak and east to central-based, in addition to the fact that easterly QBO-SSW analogs seemed to flag the potential for a mid-season SSW. The behavior of the NAO is the reason why December is the coldest month of the CP la Nina composite, as the NAO is only moderately positive in the composite, while it is highly positive in January and February. The NAO averages slightly negative in November and March. Contrary to the CP la Nina years, the month of December is the most mild month of the EP composite because the NAO is neutral-negative, and is very negative the rest of the winter before ascending slightly in March, thus while the easterly QBO data set seemed to imply some PV dysregulation in December, that does not have to mean that it will be particularly cold. It would appear that the orientation of La Nina can play a vital role in not only the aggregate NAO value of the winter season, but also the overall progression, as was the case with respect to the interaction between the QBO state and the solar cycle. This sensitivity of the NAO progression to the El Niño Modoki Index (EMI) is due to the aforementioned modulation of the Hadley Cell via convective forcing patterns and the oceanic circulation patterns that feedsback into the Atlantic via subtropical jet bridges to sustain said forcing patterns. Zhang et al 2014 verify through several atmospheric simulations that CP la Nina favors an extratropical response redolent of a positive NAO configuration across north America and the north Atlantic. And EP la Nina favors negative NAO during the winter season due to a diametrically opposing atmospheric and oceanic circulation pattern. It is suggested that the subtropical jet bridges the connection between ENSO and the NAO. Essentially, the circulation pattern of the CP la Nina strengthens the Pacific subtropical jet, which augments the Atlantic jet and creates an anticyclonic circulation. This circulation configures SSTs in such a manner as to reinforce positive NAO through a wind-evaporation-SST feedback. The EP event has a diametrically opposed circulation pattern that weakens said subtropical Pacific jet, which in turn diminishes the Atlantic jet and fosters the development of an cyclonic circulation that sustains negative NAO via said wind-evaporation-SST feedback. Zhang even referred to basin-wide events as "hybrid" or "mixed" events, since they often display characteristics of both east-based and Modoki events. Due to the fact that this season is likely to feature an east to central-based event of weak intensity, odds favor a -AO with polar vortex disruption(s), however, the NAO is more nebulous and may very well average positive in the DM seasonal mean, which would be consistent with a freshly descending portion of the solar cycle within two years of solar max. The period from December into early January, as well mid February into mid March (1/14 to 2/14 favored SSW window) may be most prone to an episode(s) of -AO/NAO. However, variance in this data set is high, thus it is imperative to consider alternative outcomes. Obviously, weaker SST anomalies present within more marginal la Nina events have a reduced ability to couple with the atmosphere, thus other extra tropical factors play a more prominent role. This means that the correlation of the NAO to the structure of la NIna is reduced in weaker ENSO events. This is also why some weaker CP events, such as the 2008-2009 and 2000-2001 events, did not feature a very prominent positive NAO signal and were thus more prone to episodes of blocking. Likewise, the minor EP event of 2005-2006 was relatively mild, despite some blocking episodes. Note that the extremely positive NAO value reflected during the moderate Modoki season of 2011-2012, which in conjunction with a very consolidated polar vortex and cold phase of the Pacific undoubtedly played a role in the very mild character of that winter. This is why it is absolutely imperative to view each season within the polar composite as an individual ensemble member, and the composite as an ensemble mean. Each season represents a plausible solution within the range of mathematically plausible outcomes, and to view any seasonal composite as a deterministic tool is pure folly. Winter 2025-2025 Preliminary Polar Analog Composite Primary Polar Analogs: 1970-1971, 2000-2001 The DM mean AO value for the 13 seasons within the composite is -.30 and the mean NAO value is +.13, the latter of which matches stormchaserchuck1 's +.20 value to within .07. This clearly increases confidence relative to such an extended lead time, as does the remarkable consistency that the polar composite has with other the weak La Niña, east-based La Niña, QBO, solar and EMI composites. These preliminary composites also share a consensus with some of the early seasonal guidance. Conclusions to Drawn Regarding Winter 2025-2025 The fact that the weak and east-based/basin-wide La Niña composites match the preliminary Eastern Mass Weather Polar Composite belies the fact that they have a great deal of variability. This does not mean that a weaker cool ENSO event necessarily favors a colder pattern with more high latitude blocking, however, it does mean that they are much less prohibitive to said regime than are strong La Niña events. Weaker La Niña events are more prone to higher latitude influences, which in this case will be a negative QBO/near max descending solar cycle. This latter combination is why winter 2025-2026 will likely feature some blocking and colder intervals, as a weak La Niña event in and of itself does not necessarily ensure that particular outcome. The easterly QBO and high solar conditions should largely cancel one another out, with a slight nod in the direction of the easterly QBO relative to the AO (modestly negative), and the solar max with respect to the NAO (modestly positive). That being said, there are likely to be periods of significant negative NAO possible during the month of December into early January before the polar vortex recovers, and then again between mid February and mid March in response to a potential mid season SSW between approximately January 14 and February 14. Although snowfall may be more plentiful than it has in recent seasons, the interior of the northeast is still likely to be favored given the likelihood of a variable storm track and a substantial mid season thaw period. Eastern Mass Weather will have a preliminary assessment of the extra tropical Pacific for winter 2025-2026 within the next few weeks-
-
RIP Milwaukee
-
I'm not a big tropical tracker but this set-up is a like a day 10 blizzard. Certainly not a hallucination but currently modeled upper air patterns are tenuous.
-
According to history this is the sweet spot for a NE hurricane with big blocking.
- Today
-
Sounds like the last 75 years. It won’t happen till it happens wink wink
-
This is a Hatteras head fake and then 300 miles East of Chatham. Ridge placement will lock in this week and then weenie dreams will fade.
-
Back from a nice week on the Cape. A little smoky and cloudy to start but last few days were stellar.
-
This week is gonna' be hot. Dew points look tolerable for most of the week so we AC by day and window fans by night. We'll see how September goes but get out and enjoy the heat while it's here. Go Swim!
-

Occasional Thoughts on Climate Change
blizzard1024 replied to donsutherland1's topic in Climate Change
My issue for many many years is that CO2 levels during the glacial to interglacial periods lagged the inferred temperatures from Oxygen Isotope Ratios by up to 1000 years. This suggests strongly that it's the oceans outgassing and absorbing CO2 that is leading to these changes in CO2 and not CO2 driving the climate. Plus, one small absorption band around 15 microns is very small compared to water vapors much larger absorption in the IR spectrum. A doubling of CO2 leads to about a 1% change in energy balance. How does that equate to 4.8C? Even 2-3C seems farfetched. All of this work is based on computer modeling and proxy records which are not definitive. What about tropical convection? This has a huge impact on the global energy balance. Climate models don't explicitly predict this. Anyway, I have been trying hard to come around to the mainstream on this and my skeptical mind won't let me. I guess my main sticking points are the ice core records, the small change in energy balance from a doubling of CO2, Earth is coming out of a little ice age and the small absorption band of CO2 relative to H20. Anyway, I do agree that we shouldn't pollute the atmosphere at all and should be weaning off of fossil fuels for cleaner sources of energy. So at the end of the day, I may not agree with the doomsday warming scenarios but I agree with you on what the world needs to do for the future. -
If you want a really good illustration of what happens when there is no gap in a mountain range, then the Bitterroot Valley is your huckleberry. Take some time and look at the annual snow totals for Hamilton and also at their winter temps. Then, look at Missoula's. Different worlds and only about 30mins apart. We nearly moved here, so I had done a lot of research about the valley. They used to grow apples in that valley. It is a true banana belt. The downlsope winds keep it warm for most of the winter. There are few ways for cold air masses to get south into the valley. Just of this area gets bitterly cold during winter. The eastern TN Valley is similar to this in many ways.
-
That also means the airport deals with downslope winds that Knoxville and western burbs don't see nearly as much.
-
Pay attention to the super ensemble
-
I tend to lean towards the idea that AMO cycles flipped around 1990. We are due for it to reverse. As John noted last winter, there is some debate as to whether the AMO actually exists. I think the big change is that we finished a -AMO cycle during the late 1900s, and that greatly changed our weather in E TN. We also really need the -NAO in E TN to have decent shots at Nor'Easters. That is a different answer for the Plateau westward where the PDA/PNA ridge complex matters tremendously. There were some crazy strong El Nino's during the 90s. Right now we are in a pattern of La Ninas which I believe is driving the weather pattern here and placing the default NA trough over the Mountain West during many winters. Eventually, the pattern will change to something entirely different. La Nina is not great for the coast. It is weird, but TRI is kind of linked to DC's pattern. When it is snowy there, it is often snowy here. TRI generally does poorly in La Nada's and moderate to strong La Nina's. Strong El Ninos are torch city as well. We also have a wicked bad rain shadow here. Lately, downsloping over the eastern Foothills has been a problem. We are feast or famine up here. We generally do well w/ inland runners, sliders, NW flow, and a once in a decade setup where a low stalls/forms in the lee of the Apps. But trajectory of each system matters greatly. A slider with nearly perfect east-west trajectory is no good here. We need it to bend NE just a hair. The missing piece during recent winters are Alberta clippers. I believe the lack of clippers is probably directly correlated to the lowering snow totals. Joe Bastardi (who I like when he talks historical weather patterns) says that it snows where it wants to snow. During some winters, it just snows more here regardless of the pattern. He also notes there is a connection between late season cold and late hurricane action. One other JB note is that if a place has a rainy fall, that is generally where cold will try to setup. Those are fairly sound observations which have merit. Also as John notes, we generally hit big winters in cycles.
-
 Highs: PHL: 87 EWR: 86 New Brnswck: 85 TEB: 85 * (89) faulty reading NYC: 85 LGA: 84 ISP: 83 TTN: 83 JFK: 82 * missing intra hour highs ACY: 80 BLM: 79
 -
 Looks like another cool night, down to 65
 -
Agree. It needs to be hugging or very near the Antilles.
-
I’m THIS close to buying every milk carton within a 10 mile radius
-
Even though it’s looking back at 12z, the super ensemble is probably most useful tool right now. It also gives a good window into where predictability ends and weenie range begins.
-
Oh, man. That isn't good. I have the same recollection of that year.
-

-
 MJO812 changed their profile photo
 -

2025 Spring/Summer Mountain Thread
Tyler Penland replied to Maggie Valley Steve's topic in Southeastern States
Nice! My best friend lives in Billings and I went out to see him. We hiked Mt Rearguard which was my first hike up to a 12kft peak (and highest significant hike over 9k). The elevation absolutely whooped my butt but it was worth it. The first night in Yellowstone there was a tinge of frost on the meadow and we dropped to 33/34º, super super nice. I got off the plane on my second, and unplanned, connection in DC from Denver and the humidity hit me in the face for the first time in a week. No fun. -
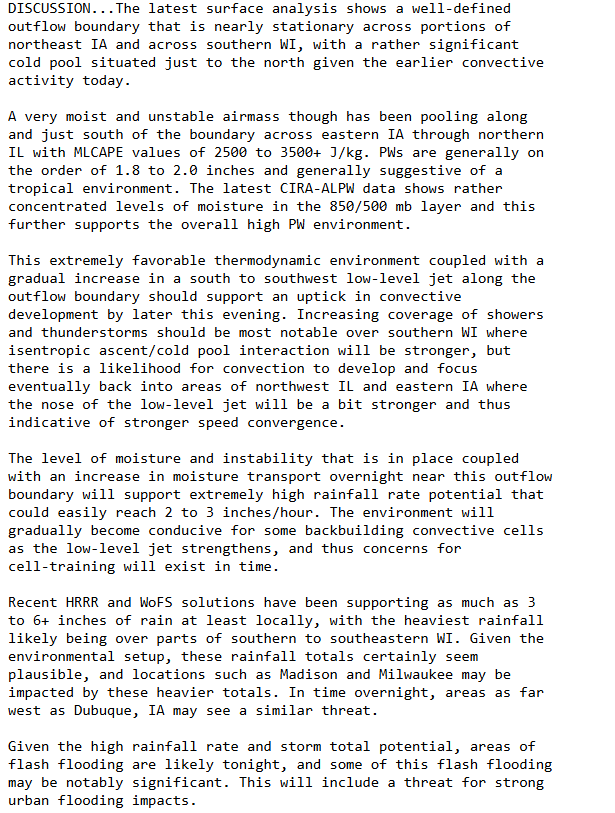
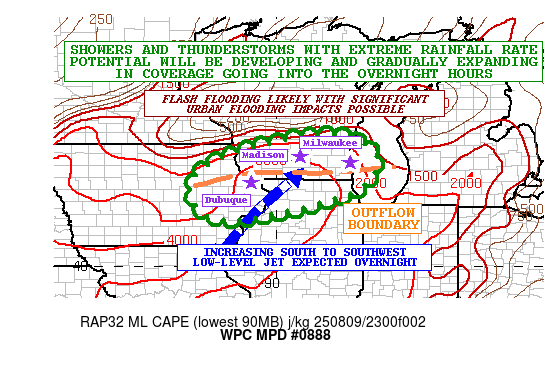
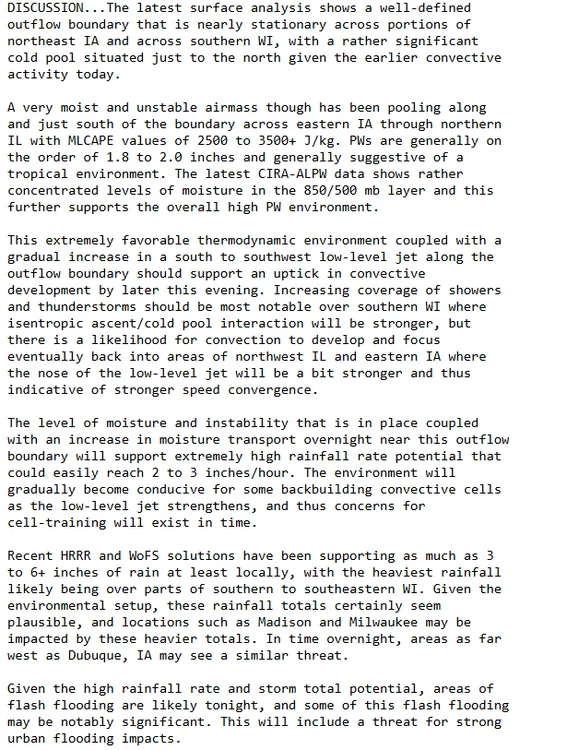
It is going to be a long night for S WI for rain/flooding. Already a rare FFW out for Milwaukee and West Allis (On State Fair weekend no less!) with 2.5"+ hrly totals. And WPC just put out a pretty strongly worded MPD for the area.
-
I don't know if a rookie manages to break that...maybe? Lol They been doing this crap all year! All early hit then quiet...the whole hitting philosophy needs to be overhauled. I hope this ain't an Elias issue...he oughta let the new manager pick his staff.
-
No hits since the first 3 batters of the game.
.thumb.png.4150b06c63a21f61052e47a612bf1818.png)