All Activity
- Past hour
-
Ended the day with .69" from 3 different storms.
-

2025 Atlantic Hurricane Season
Supercane replied to BarryStantonGBP's topic in Tropical Headquarters
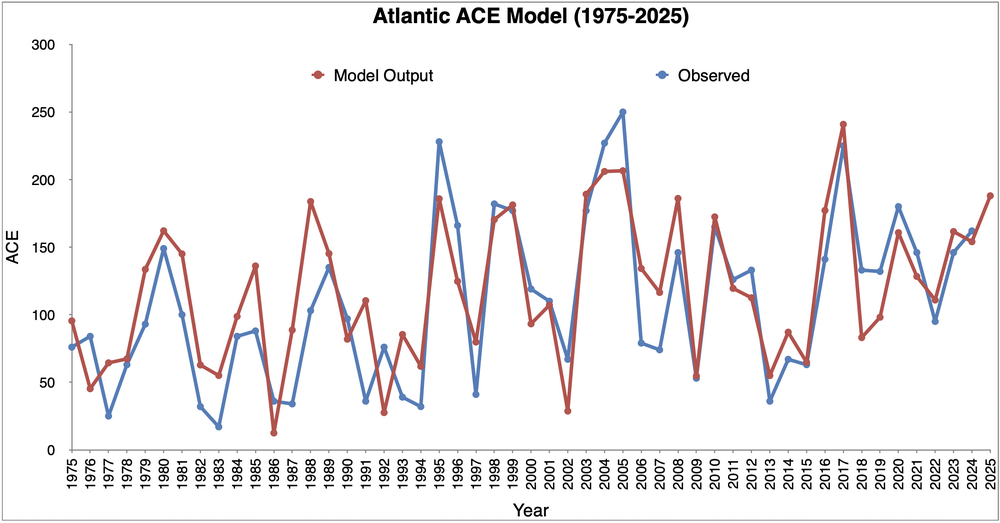
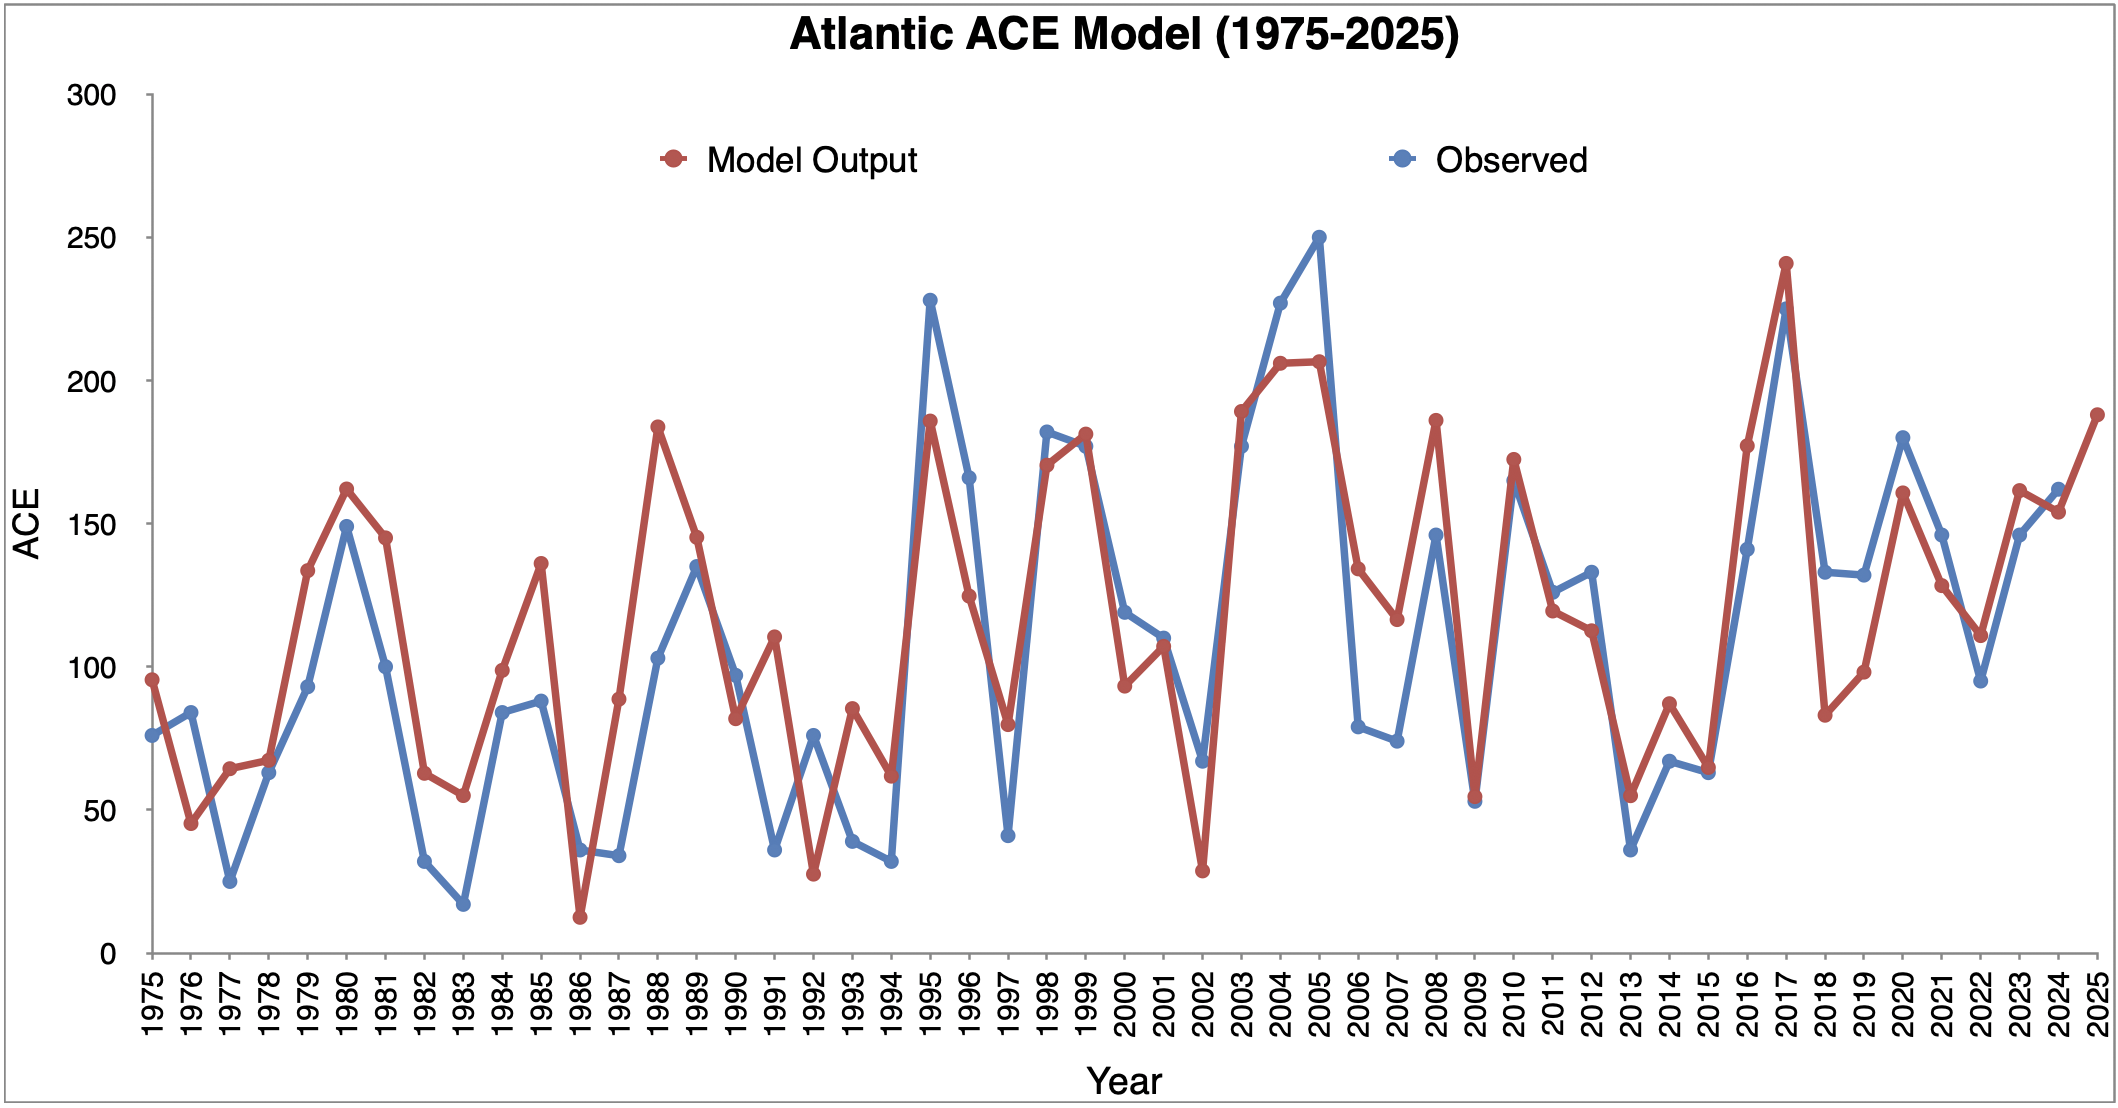
My Atlantic hurricane season forecast model predicts an ACE of around 188 (90% confidence it will be between 141-235). Notably, last year's forecast of 152 was very close to the observed 162, and much closer than what was forecast by CSU (230) and TSR (240) at the same lead time. The correlation is robust going back to 1975: Perhaps the more interesting question is where will the storms go? Obviously this is much trickier to answer, but based on how ENSO has evolved over the past 16 months, the best analogs are 1967, 1971, 1981, 1984, 1996, 1999, 2006, 2011, and 2017. As seen below, there are some patterns in the tracks of all tropical storms and hurricanes in these years: Therefore, I would estimate an above-normal hurricane risk for the US East Coast, Antilles, and Western Basin, and slightly below-normal risk for the North Gulf Coast. To emphasize, this is just a general risk assessment and by no means rules out or forebodes a hurricane impact in any part of the basin.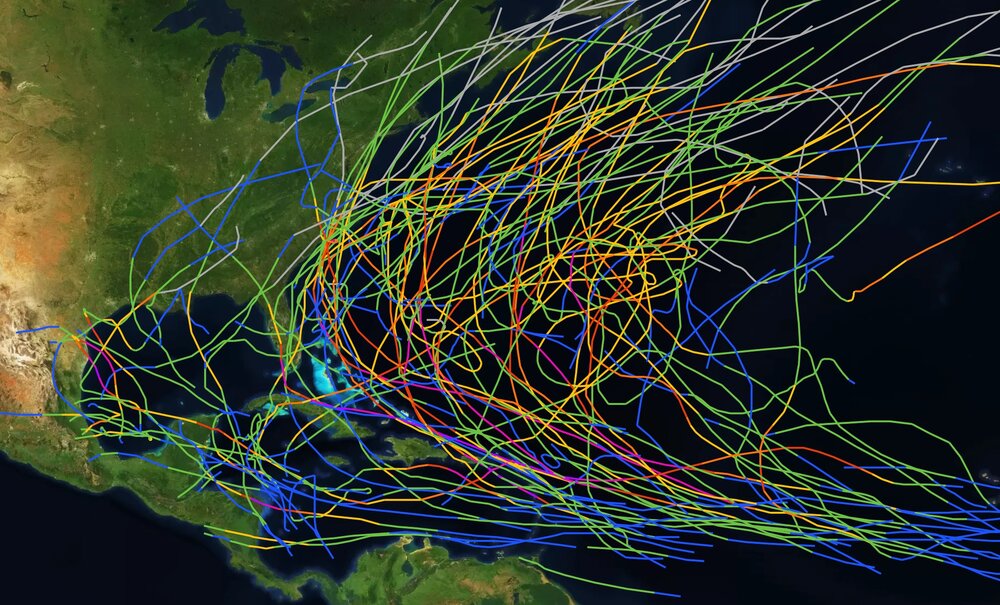
-

July 2025 Obs/Disco ... possible historic month for heat
RUNNAWAYICEBERG replied to Typhoon Tip's topic in New England
Perfect. -

July 2025 Obs/Disco ... possible historic month for heat
weathafella replied to Typhoon Tip's topic in New England
Looks like the 4th is kind of perfect. Warm enough to swim with comfortably dews. -

July 2025 Discussion-OBS - seasonable summer variability
SACRUS replied to wdrag's topic in New York City Metro
Dews on the rise 76/71 here up from 66 at 6pm -

2025-2026 ENSO
PhiEaglesfan712 replied to 40/70 Benchmark's topic in Weather Forecasting and Discussion
Since 2010, the only summers that were below the 1981-2010 average here at PHL were 2014 and 2023. However, June 2023 was significantly cooler than September 2023, and if you used JAS 2023 instead of JJA, it would have been above the 1981-2010 summer (JJA) average. JJA 2014 (75.7) finished .2F below the 1981-2010 average, and JJA 2023 (75.8) finished .1F below the average. JAS 2023 was 76.1F, which would have been above the 1981-2010 JJA average. -

July 2025 Discussion-OBS - seasonable summer variability
Roger Smith replied to wdrag's topic in New York City Metro
The peak was today, July 2nd still holds record highs on both max and min side (100, 82). The over-90 portion of the 1901 heat wave ran from June 26 to July 3. The highs and lows for those eight days were June 26 ___ 91 72 _ max was a record tied with three previous years until 1904,1909 tied 93, then 1923 had 94, 1943 and 49 96F, and 1952 100F (96F 1963 warmest since, 93F warmest recent 2003 and 2024. June 27 ___ 91 74 June 28 __ 93 75 June 29 __ 95 76 June 30 __ 95 60 _ max a record tied in 1931, broken 97F 1945 (eventual 99F 1964) July 1 __ 100 78 _ max is a record, min was a record until 79F in 2018 July 2 __ 100 82 (.03 in) _ both records today, max shared with 1966 July 3 ___ 94 76 (.31 in) suspect the 94 was early and it dropped during the day After 84/71 on the 4th, a record 3.07 inches of rain fell on the 5th (86/75) and 1.26 more on the 6th (77/74). It's pretty easy to visualize a stalled front being responsible for the heavy rainfalls. Then a second less severe heat wave lasted from July 14 to 24 (86 to 93 max, highest 21st). Several overnight lows were 76 to 78 F in that warm spell. A record low max of 69F was observed on July 26 then it warmed back to 92, 93 on July 29-30. Aug and Sep were close to average with a mix of warm and cool spells. July 1901 had a mean of 77.7 F and was 4th warmest July 1869-1901 and is now t39 of 157. Factoring in an increasing heat island it ranks 27th. - Today
-
-

2025-2026 ENSO
TheClimateChanger replied to 40/70 Benchmark's topic in Weather Forecasting and Discussion
Yeah, some areas will definitely stand to benefit from these changes. Others might not fare as well, with sea level rises and such. -
Topped out at 91° at ORD and 91° at MDW today. ...2025 90°+ Day Tally... 12 - ORD 12 - DPA 11 - MDW 11 - RFD 11 - PWK 10 - ARR 10 - LOT 7 - UGN
-
Great news. Think of the savings on heating.
-
zzzzzzzzzzz
-
Occasional Thoughts on Climate Change
TheClimateChanger replied to donsutherland1's topic in Climate Change
July is warming by as much as 5 or 6 degrees per century, which is substantially less. However, the latitudinal variance is considerably less, so that's possibly an even bigger shift in terms of latitude. Will everyone east of the Mississippi have a South Carolina low country climate by 2100? Will the Southeast turn into a blazing inferno of deadly wet bulb events? -
Occasional Thoughts on Climate Change
TheClimateChanger replied to donsutherland1's topic in Climate Change
Man, I've been tracking global warming for decades and some things still just stop me in my tracks. January is warming at 11F/century in parts of the eastern US over the past 5 1/2 decades. This is a steady long-term trend that is older than me! Just unbelievable. I mean simply extrapolating this trend, suggests that Januarys by the early 22nd century will be warmer than recent Marches. This is just extrapolation of the long-term trend. With acceleration, will we see this increase to 15 or 20F per century? -

Occasional Thoughts on Climate Change
LibertyBell replied to donsutherland1's topic in Climate Change
Was that the one in which Seattle hit 109? -

July 2025 Obs/Disco ... possible historic month for heat
Sn0waddict replied to Typhoon Tip's topic in New England
Can confirm lol. Saw this guy in my driveway presumably hunting chipmunks after it stopped raining, so that was kinda cool.
-
Occasional Thoughts on Climate Change
LibertyBell replied to donsutherland1's topic in Climate Change
Could the following day actually have been hotter but it wasn't recorded because the weather station was destroyed? I remember the recorded high was 50C which should actually be 122F -
Occasional Thoughts on Climate Change
LibertyBell replied to donsutherland1's topic in Climate Change
didn't an entire town burn down out there because of the heat? Lytton was the one-- how does it get so hot out west that far north and yet it can't do that in the northeast? we get the more humid lower temp kind of heat. -
We are getting there little by little. Can’t believe it’s just about July 4th
-
2025-2026 ENSO
TheClimateChanger replied to 40/70 Benchmark's topic in Weather Forecasting and Discussion
If the current long-term trend were to continue, we would be seeing mean January temperatures of about 39.5F in northeast Ohio and about 44F in coastal New York. Those are warmer than March averages today. Again, that is only extrapolating the ongoing trend. The reality is that the trend is actually accelerating as @bluewavepointed out. Not out of the question, we see warming as high 15-20F per century in the coming decades. Just unbelievable. -
2025-2026 ENSO
TheClimateChanger replied to 40/70 Benchmark's topic in Weather Forecasting and Discussion
Just a sobering trend. Over the last six decades, January is warming up to 10 or 11F per century in many areas. Northeast Ohio - 11F/century Coastal New York, including NYC Metro - 10F/century! -
I would take my chances with that. Let's bring the cold and worry about the precip later.
-
E PA/NJ/DE Summer 2025 Obs/Discussion
Kevin Reilly replied to Hurricane Agnes's topic in Philadelphia Region
Total rainfall from everything yesterday and this morning was 0.63" so we were stuck between bandings subsidence. -
July 2025 Obs/Disco ... possible historic month for heat
RUNNAWAYICEBERG replied to Typhoon Tip's topic in New England
Perfect. -

July 2025 Obs/Disco ... possible historic month for heat
kdxken replied to Typhoon Tip's topic in New England
Just wait until nodewdependence day.


.thumb.png.4150b06c63a21f61052e47a612bf1818.png)
