All Activity
- Past hour
-
That’s pretty crazy. Thanks.
-
The weather doesn’t get more boring than this. There is literally nothing to talk about.
-

2025-2026 ENSO
40/70 Benchmark replied to 40/70 Benchmark's topic in Weather Forecasting and Discussion
I prefer to study females, but you do you. -
2025-2026 ENSO
40/70 Benchmark replied to 40/70 Benchmark's topic in Weather Forecasting and Discussion
https://psl.noaa.gov/data/atmoswrit/map/index.html -

September 2025 OBS-Discussion centered NYC subforum
ILoveWinter replied to wdrag's topic in New York City Metro
Thanks you for the perspective on the "drought"! Completely agree, we in this forum sometimes are overly concerned during dry stretches. There may be a time to worry but now is not it. -
Steinland. It's spectacular weather, but man, we really need some solid rn.
-

September 2025 OBS-Discussion centered NYC subforum
uofmiami replied to wdrag's topic in New York City Metro
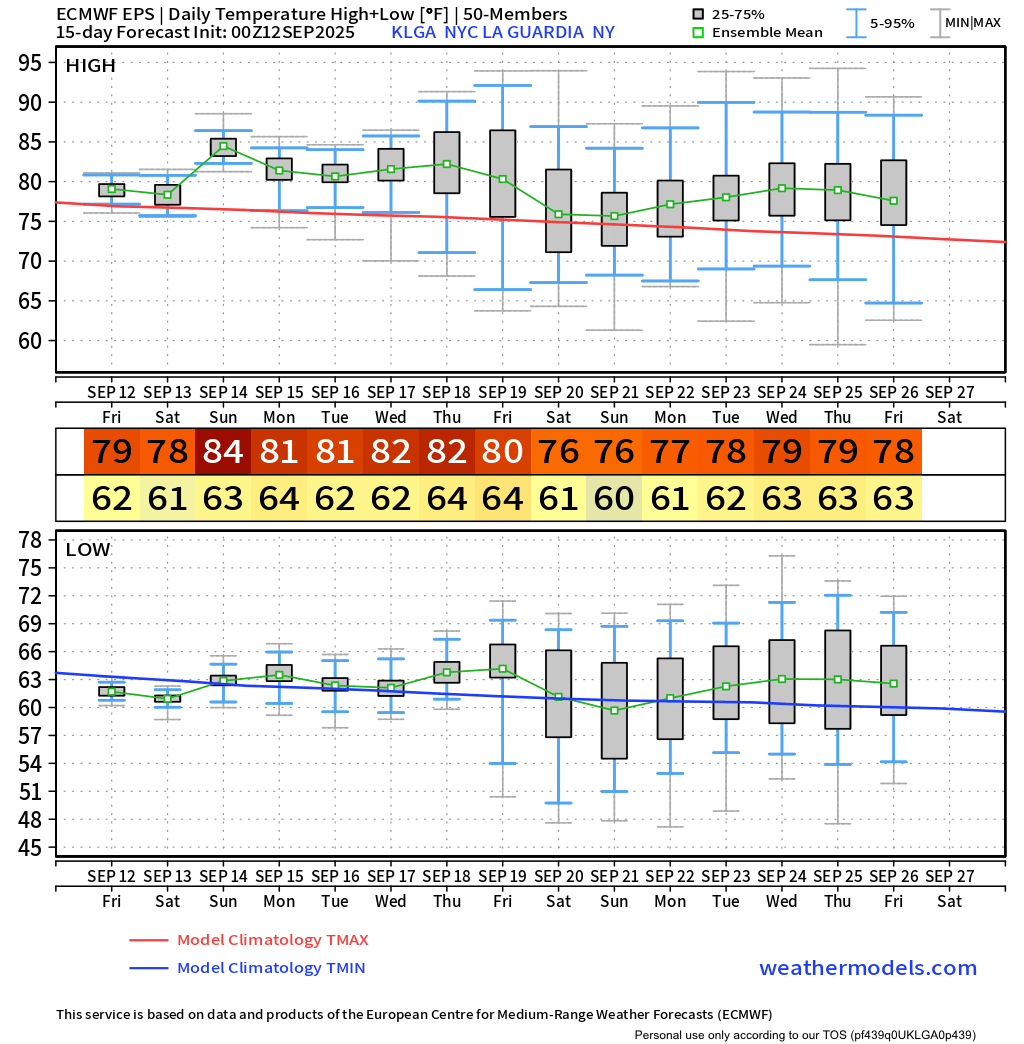
Looks like low 80s on EPS, regardless it’s above normal.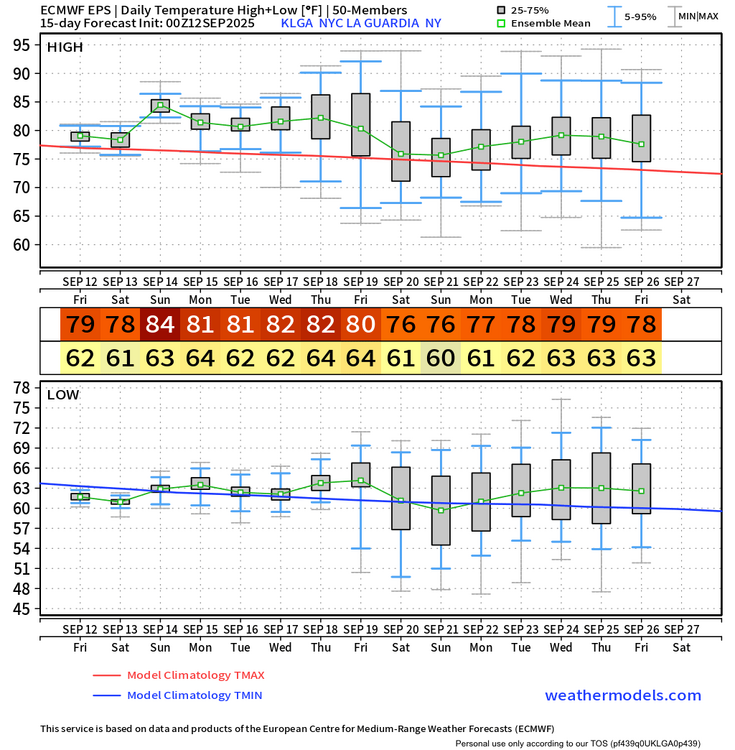
-

September 2025 OBS-Discussion centered NYC subforum
wdrag replied to wdrag's topic in New York City Metro
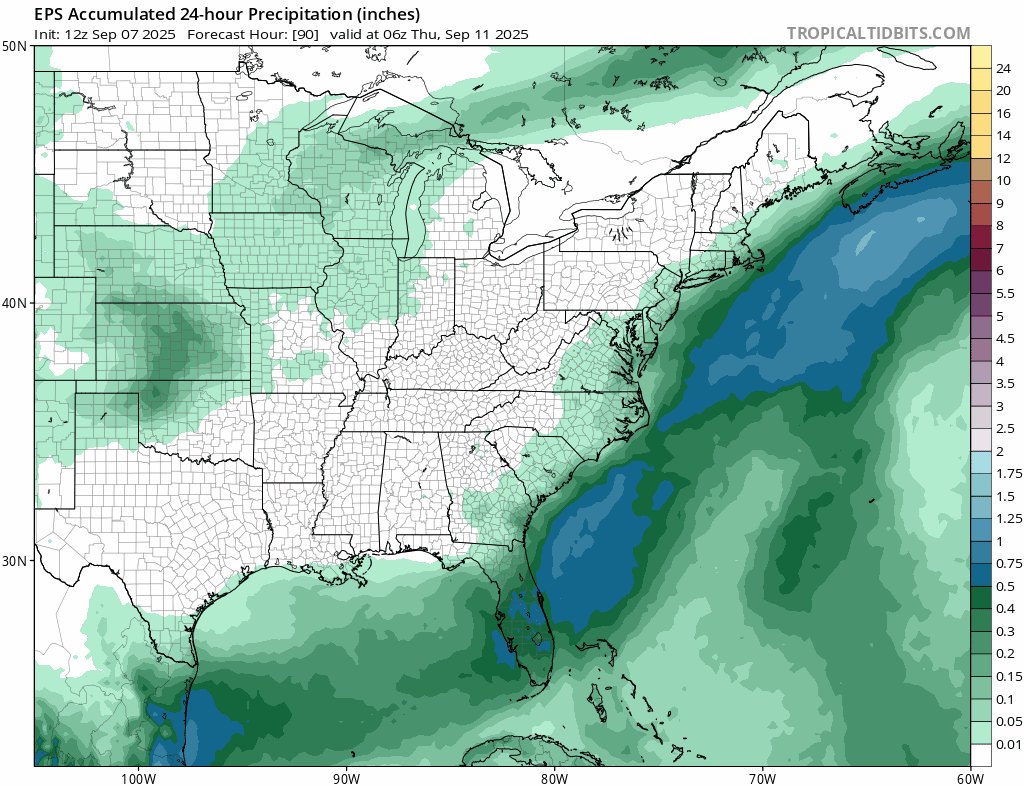
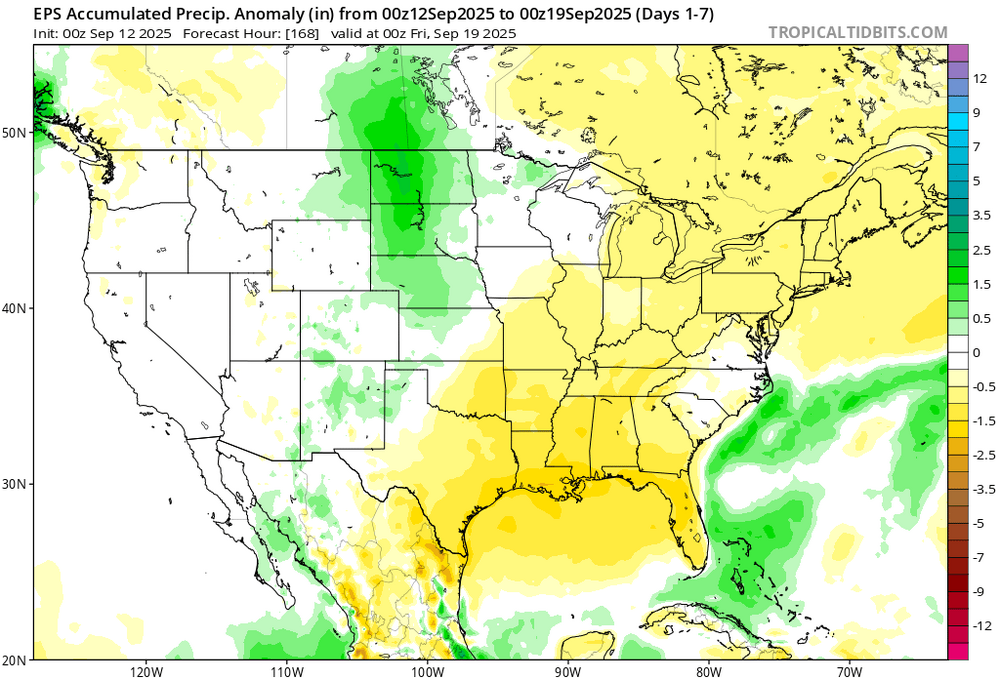
Just catching up: comments... modeling other than the dry CMCE, has patches of light-=mdt showers Saturday and Sunday. How it turns out I cant be sure but its repeatedly in guidance that I rely upon including EPS, SPC HREF and now some experimental MPAS guidance. Middle of next week northern fringe UA low rainfall potential to our NYC subforum. Drought monitor: I think we need perspective on the dryness... I just cant get overly concerned. Drought monitor needs a map to show the "perspective" - how unusual component of ST drought. NYC reservoir system less than 2% below normal as of yesterday. Yes vegetation takes a beating but almost every summer fall this happens... and here we are. The fall rainfall component I think is in part dependent on tropical connection. Obviously none so far and yet we got a pretty good dose a few days ago...even Wednesday morning (see CoCoRaHs attached) had some minor impact on sea behavior. As long as it doesn't get windy and hot... I think we're ok. -

September 2025 OBS-Discussion centered NYC subforum
bluewave replied to wdrag's topic in New York City Metro
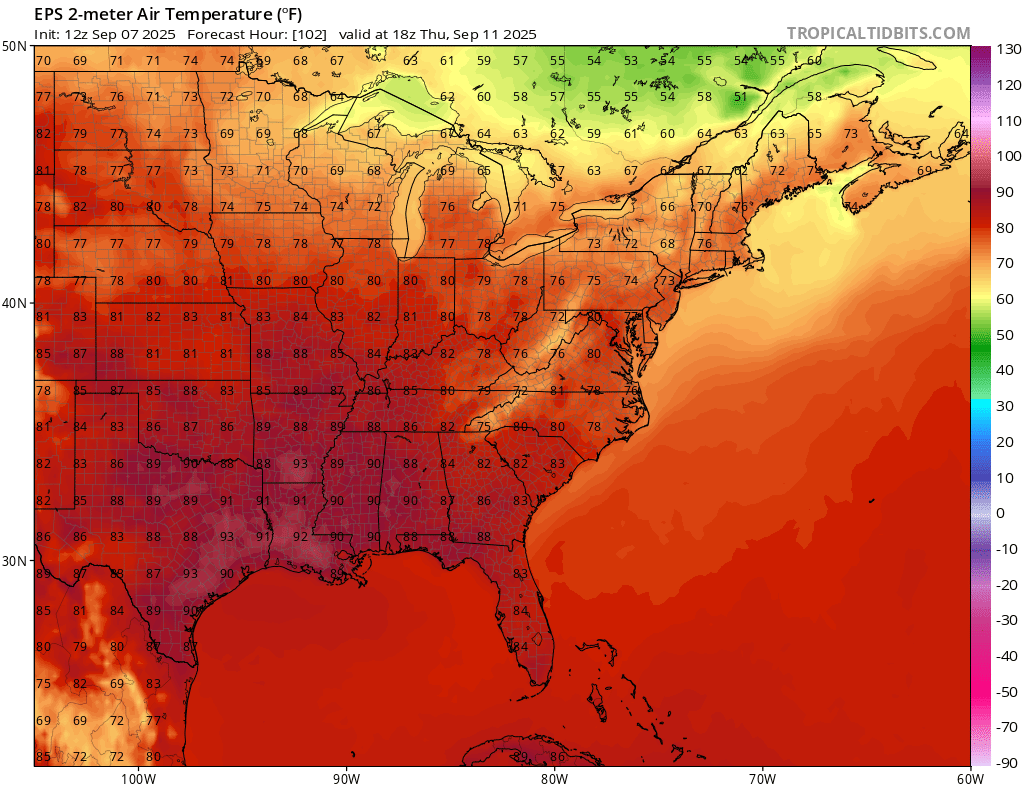
Both the GFS and Euro have 850 mb temps which would support 90° highs by later next week at the usual warm spots if the flow becomes SW with full sun. But they have been wavering on whether we get SW or more onshore flow and amounts of clouds. So if the flow stays more onshore, then the warm spots will probably only top out in the mid 80s. -
Yeah it feels like an eon after the swarm we had for storms. I had a dream where a vicious storm was approaching at noon and inside you could barely see; it was so profoundly dark (some precursors to tornadoes a veil of total darkness descends moments before). Intense, sharp, bright lightning that was terrifying not knowing if it was right above you. Pitch black skies and two mesos spotted. Craving?
-

September 2025 OBS-Discussion centered NYC subforum
Sundog replied to wdrag's topic in New York City Metro
For yesterday the EPS run from your posted map had the coastal lingering, that's why temps were probably too low.
-

September 2025 OBS-Discussion centered NYC subforum
SACRUS replied to wdrag's topic in New York City Metro
Records: Highs: EWR: 95 (1961) NYC: 94 (1961) LGA: 94 (1961) JFK: 91 (1981) Lows: EWR: 47 (1958) NYC: 46 (1917) LGA: 52 (1967) JFK: 46 (1967) Historical: 1775: The Independence Hurricane caught many fishing boats on the Grand Banks off Newfoundland Canada killing 4,000 seamen, most from Britain and Ireland. (Ref. Wilson Wx. History) 1857: The SS Central America sinks during a hurricane, killing 425 lives. Fourteen tons of gold was aboard the ship as well. 1869: A hail storm between 1 and 3 AM broke windows and caused considerable damage to late vegetables at Madilia, MN in Watonwan County. (Ref. AccWeather Weather History) 1882 - Hot and dry winds caused tree foliage in eastern Kansas to wither and crumble. (David Ludlum) 1921: The San Antonio River flooded, killing 51 people and causing millions of dollars in damages. The flood was caused by some of the heaviest rainfall ever recorded in Texas. A storm stalled over the town of Taylor and dumped an astounding 23.11 inches of rain on the area in less than a day. (Ref. Wilson Wx. History) 1944: The destroyer USS Warrington was sunk by the Great Atlantic Hurricane 300 miles east of Cape Canaveral, FL. 247 men were lost in the tragedy. The hurricane would pass just east of the North Carolina Outer Banks and make landfall on the east end of Long Island, then pass into Rhode Island. The Great Atlantic hurricane was significant because it was the first storm in which forecasters had regular aircraft reconnaissance reports available. The success convinced the military of the value of reconnaissance and the program continued and evolved to what it is today. (Ref. Wilson Wx. History) 1950: Hurricane Dog was the most intense hurricane in the 1950 Atlantic hurricane season. The fourth named storm of the season, Dog developed on August 30 to the east of Antigua; after passing through the northern Lesser Antilles, it turned to the north and intensified into a Category 5 hurricane. Dog reached its peak intensity with winds of 185 mph (300 km/h) over the open Atlantic and after weakening, it passed within 200 miles (320 km) of Cape Cod Hurricane Dog retains the record for longest continuous duration for a Category 5 Atlantic hurricane, although Hurricane Allen spent more total time as a Category 5. On September 4, Hurricane Dog was one of three simultaneous Atlantic hurricanes, along with Charlie and Easy. This is a rare occurrence in the Atlantic Ocean, and has only happened six times since 1950—in 1961, 1967, 1980, 1995, 1998, and most recently in 2010. This also occurred on August 31 with Baker, Charlie and Dog. Additionally, Dog remains one of only three Category 5 hurricanes in the historical database to avoid land—the others were Easy and Cleo, both of which also occurred in the 1950s. Why was it called the Dog Hurricane? Hurricane naming began back in 1950, when meteorologists wanted to give tropical storms and hurricanes an easy name to remember them by, instead of just plain "Hurricane Six" or "Tropical Storm 8b". So, in 1950, the National Hurricane Center named hurricanes from the World War 2 phonetic alphabet. Hurricanes that year were given names such as "Dog", "Barker", "Item", and "Jig". And yes, these names did sound a little funny, that is probably why they only used these names until 1952. In the Hurricane Season of 1953, they tried a different approach - giving the hurricanes human names. They started out just using female names, and this lasted over 25 years until in 1979, men's names were incorporated into the list. 1950: A hailstorm struck southern parts of Oklahoma City on this day. The storm damaged about 4,000 homes, 300 businesses, and 750 cars, resulting in a loss estimated at $987,000. 1960: Hurricane Donna hits the Boston, MA area. Winds were recorded to 140 mph at the Blue Hills Observatory at Milton, MA and 130 mph at Block Island, RI. Donna was the first hurricane to affect every point along the east coast from Key West, FL to Caribou, ME. (Ref. NOAA Boston Weather Events) 1963: President Kennedy gave his, “We choose to go to the moon” speech at Rice University. 1974: Another three inches of snow fell at Scottsbluff, NE bringing the early season snowfall total to 3.8 inches. Saratoga, WY received 4 inches of snow. (Ref. Wilson Wx. History) 1977 - Thunderstorms deluged the Kansas City area with torrential rains in the early morning hours, and then again that evening. Some places were deluged with more than six inches of rain twice that day, with up to 18 inches of rain reported at Independence MO. Flooding claimed the lives of 25 persons. The Country Club Plaza area was hardest hit. 2000 vehicles had to be towed following the storm, 150 of which had to be pulled out of Brush Creek, which runs through the Plaza area. (The Kansas City Weather Almanac) 1979 - Hurricane Frederick smashed into the Mobile Bay area of Alabama packing 132 mph winds. Winds gusts to 145 mph were reported as the eye of the hurricane moved over Dauphin Island AL, just west of Mobile. Frederick produced a fifteen foot storm surge near the mouth of Mobile Bay. The hurricane was the costliest in U.S. history causing 2.3 billion dollars damage. (David Ludlum) (The Weather Channel) 1986: 6 to 12 inches of rain in three days resulted in record flooding from Muskegon, MI to Saginaw, MI. The flooding was worsened by the collapse of several dams. 10 people were killed and damage estimates approached $500 million dollars. (Ref. Wilson Wx. History) 1987 - Showers and thunderstorms produced heavy rain which caused flooding in North Carolina, West Virginia, Virginia and Pennsylvania. Parts of Virginia received 3 to 4 inches of rain in just two hours early in the day. Later in the day, three to five inch rains deluged Cumberland County of south central Pennsylvania. Evening thunderstorms produced seven inches of rain at Marysville PA, most of which fell in three hours time. (The National Weather Summary) (Storm Data) 1988 - An afternoon tornado spawned a tornado which skipped across northern sections of Indianapolis IN damaging roofs and automobiles. It was the first tornado in central Indiana in September in nearly forty years of records. Hurricane Gilbert plowed across the island of Jamaica, and by the end of the day was headed for the Cayman Islands, packing winds of 125 mph. (The National Weather Summary) (Storm Data) 1989 - Snow whitened the mountains and foothills of northeastern Colorado, with eight inches reported at Buckhorn Mountain, west of Fort Collins. Two to three inches fell around Denver, causing great havoc during the evening rush hour. Thunderstorms produced severe weather in the Southern Plains Region between mid afternoon and early the next morning. Thunderstorms produced hail three inches in diameter at Roswell NM, and wind gusts greater than 98 mph at Henryetta OK. Thunderstorms also produced torrential rains, with more than seven inches at Scotland TX, and more than six inches at Yukon OK. (National Weather Summary) (Storm Data) 1993: The high temperature in Fort Collins, CO was 94°. A strong cold front dropped the temperature overnight and by 10 a.m. the next morning, it was 33° with 3 inches of snow on the ground. (Ref. Wilson Wx. History) 1997: Hurricane Linda became the strongest storm recorded in the eastern Pacific with winds estimated at 180 mph and gusts to 218 mph. For a time it threatened to come ashore in California as a tropical storm, but the storm turned away, impacting the region only with added moisture for showers and thunderstorms. (Ref. Wilson Wx. History) 1999: Extremely dangerous Hurricane Floyd, a Category 4 storm with top winds of 145 mph, was making residents along the U.S. East Coast very nervous as it steamed steadily westward. The storm was 360 miles east of the Bahamas, causing hurricane warnings to be raised in the islands. (Ref. Wilson Wx. History) 2008: Hurricane Ike intensified from tropical storm to Category 3 status in less than nine hours on 3 September. A few days later, Ike crossed the Caribbean and waltzed across extreme western Cuba as a Cat 3. But Ike's peak winds never regained major-hurricane force. Instead, the system simply got bigger, eventually packing some of the largest radii of hurricane-force winds (125 miles) and tropical-storm force winds (275 miles) ever measured. This posed a major public communication challenge, as the vast swath of wind was expected to stir up a storm surge in the Galveston area far worse than people might presume from the storm's Category 2 rating. The worst of Ike's surge struck less-populated areas just east of Galveston Island on the night of 12-13 September, but the overall damage was still tremendous: more than $30 billion (in inflation-adjusted dollars, that's the third costliest U.S. hurricane on record). Much of Galveston and nearby coastal towns were left in shambles, and storm-surge damage extended well east into Louisiana. Ike resulted in 82 U.S. deaths--among the highest tolls in recent decades--and more than 200 people remain missing in the hurricane's aftermath. (Washington Post "Top Ten Weather Events of 2008") 2017: Cape Canaveral Air Force Station have to reopened on September 16th after IRMA of Cat 1 hurricane gave 75 MPH force winds from Hurricane Irma that lashed the Florida Space Coast on Sunday and Monday (Sept. 10/11) – forcing launch delays and leaving damaged and destroyed homes, buildings, infrastructure and launch viewing locations in its wake. Cape Canaveral Air Force Station military forces partially reopened certain critical runways soon after Irma swept by the space coast to assist in emergency recovery operations. The “Kennedy Space Center will resume normal operations Saturday, Sept. 16,” NASA announced. Irma Data 2018: Hurricane Florence was a powerful and long-lived Cape Verde hurricane, as well as the wettest tropical cyclone on record in the Carolinas and the ninth-wettest tropical cyclone to affect the contiguous United States. The sixth named storm, third hurricane, and the first major hurricane of the 2018 Atlantic hurricane season, Florence originated from a strong tropical wave that emerged off the west coast of Africa on August 30, 2018. Steady organization resulted in the formation of a tropical depression on the next day near Cape Verde. Progressing along a steady west-northwest trajectory, the system acquired tropical storm strength on September 1, and fluctuated in strength for several days over open ocean. An unexpected bout of rapid intensification ensued on September 4– 5, culminating with Florence becoming a Category 4 major hurricane on the Saffir–Simpson scale with estimated maximum sustained winds of 130 mph -
September 2025 OBS-Discussion centered NYC subforum
SACRUS replied to wdrag's topic in New York City Metro
64 / 56 another dry / warm day as we erode the early month below normal with a period of warmer than normal. Center ridge a bit east keeping the cut off / ULL away and the area dry through the week. Overall warmer period with max temps in the mid 80s in the warmest spots othwerwise upper 70s to low 80s. -
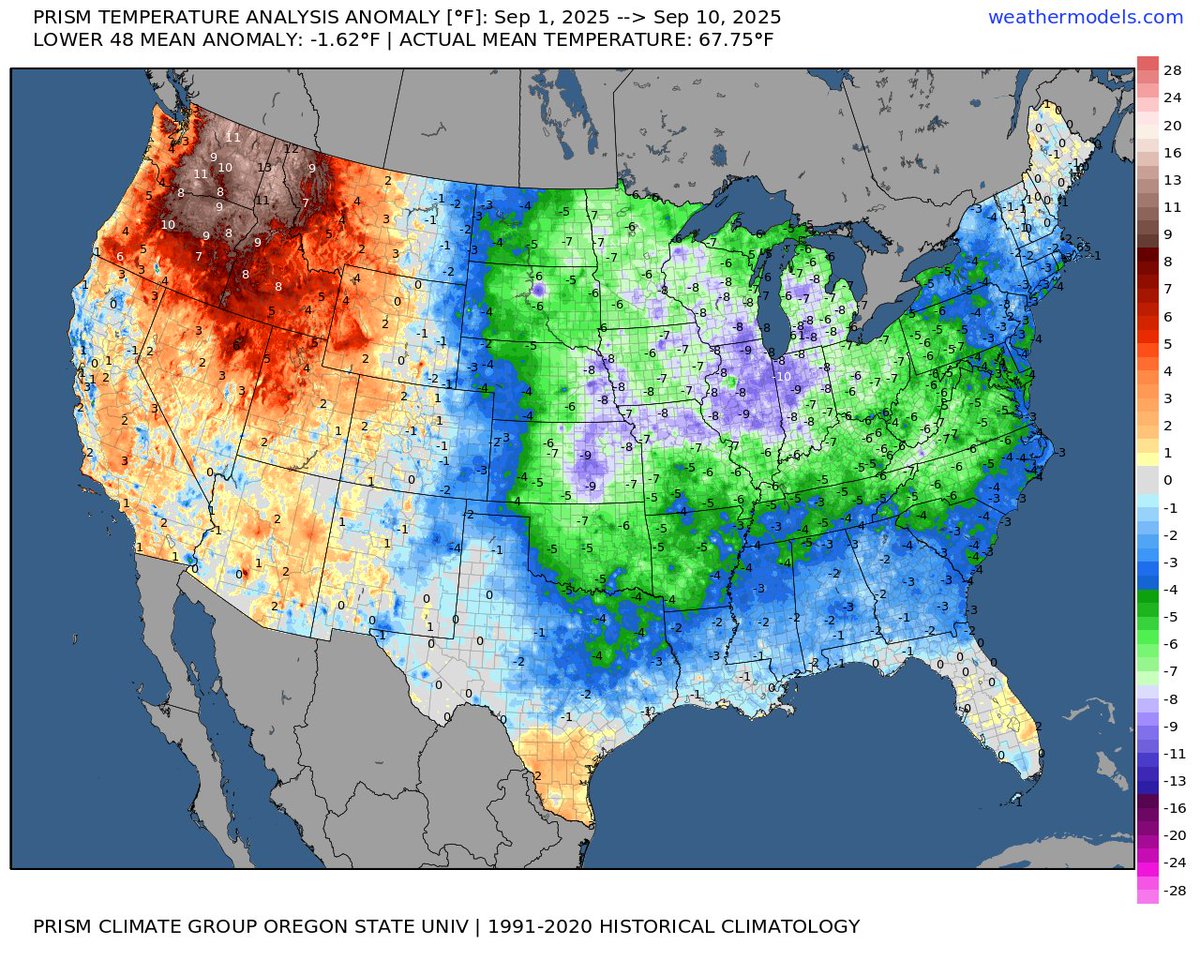
All sunshine all the time for the past week! Very few clouds. .08" total the first 12 days of Sept. is .05% of the normal of 1.68". 44.4 this morning.
-
September 2025 OBS-Discussion centered NYC subforum
bluewave replied to wdrag's topic in New York City Metro
The EPS longer range was too cool for yesterday. It originally had mid 70s from its older forecasts. But the warm spots it to the low 80s yesterday. Data for September 11, 2025 through September 11, 2025 Click column heading to sort ascending, click again to sort descending. SOMERSET AIRPORT WBAN 83 NEWARK LIBERTY INTL AP WBAN 82 Newark Area ThreadEx 82 TRENTON-MERCER AIRPORT WBAN 81 Trenton Area ThreadEx 81 MILLVILLE MUNICIPAL AIRPORT WBAN 80 ATLANTIC CITY INTL AP WBAN 80 TETERBORO AIRPORT WBAN 80 CALDWELL ESSEX COUNTY AP WBAN 80 SOUTH JERSEY REGIONAL AIRPORT WBAN 80 Atlantic City Area ThreadEx 80 PENNSAUKEN 1N COOP 80
-
September 2025 OBS-Discussion centered NYC subforum
Sundog replied to wdrag's topic in New York City Metro
Are the overall anomalies being affected by higher low temps? I don't see any temps higher than upper 70s on the EPS. -
Played Brunswick GC in Maine yesterday. One of the nicest munis in New England. Playing Belgrade Lakes today which is supposed to be top 3 in Maine.
-

2025 Lawns & Gardens Thread. Making Lawns Great Again
BrianW replied to Damage In Tolland's topic in New England
This ice plant has been growing like crazy out of tiny crack in my patio all summer. It gets roasted in the sun and was amazed it made it through all that summer heat and drought. I have a few others in some beds so it must have spread naturally. Did a little research and these are some hardy plants. I have had them bloom into November a few times here. There is no need to fuss with ice plants to achieve vibrant blooms. This powerful, low-growing perennial will thrive and spread in full sun, intense heat, periods of drought, and neglect! Not only do they produce colorful blooms through periods of intense high temperatures, but they also prefer it! This tough-as-nails succulent thrives in the heat, where many other flowers wilt and fade. Hailing from South Africa’s sunny shores, ice plants are adapted to high temperatures. The succulent foliage stores water, helping them easily weather dry spells putting on a dazzling display of blooms throughout the hottest months.
- Today
-
More SE ridging this year-good as long as it doesn’t go wild and link up with the NAO block or otherwise send every storm to Buffalo. Here we need some ridging to make storms turn the corner, but as we all know Nina’s often promote the wild SE ridge. Of course any -PNA makes it worse.
-
Just some food for thought over the long haul. We have been in an AMO Active period since 1995. When you look at the history of AMO Active and Inactive periods those are historically 25 to 30 years long. Historically we are due to return to a AMO Inactive period and perhaps this is a transition year back to an AMO Inactive period.
-
September 2025 OBS-Discussion centered NYC subforum
bluewave replied to wdrag's topic in New York City Metro
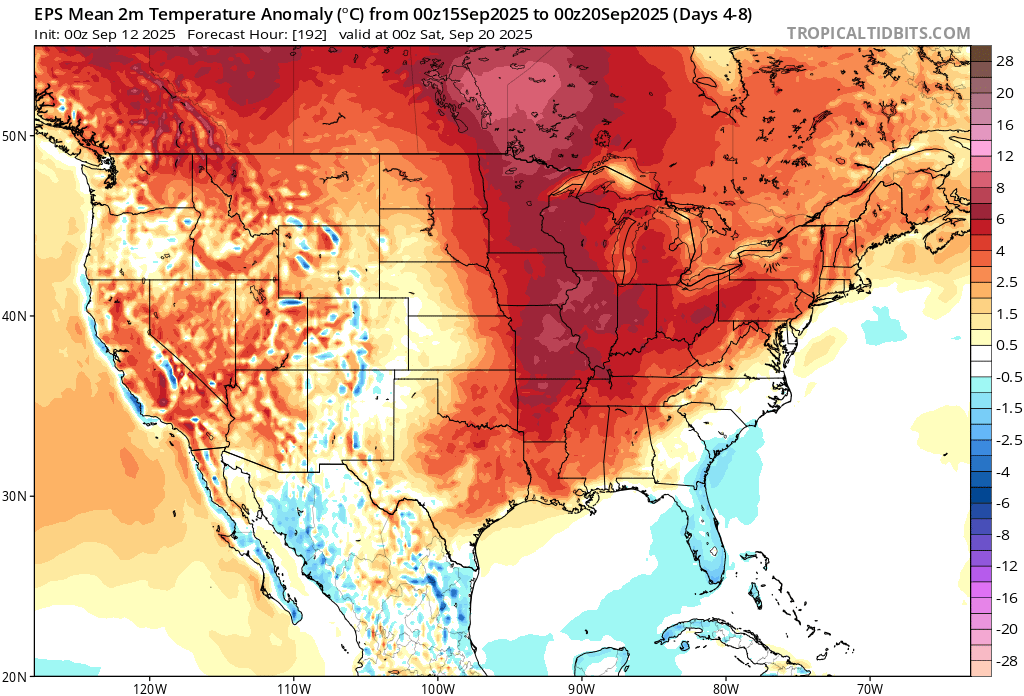
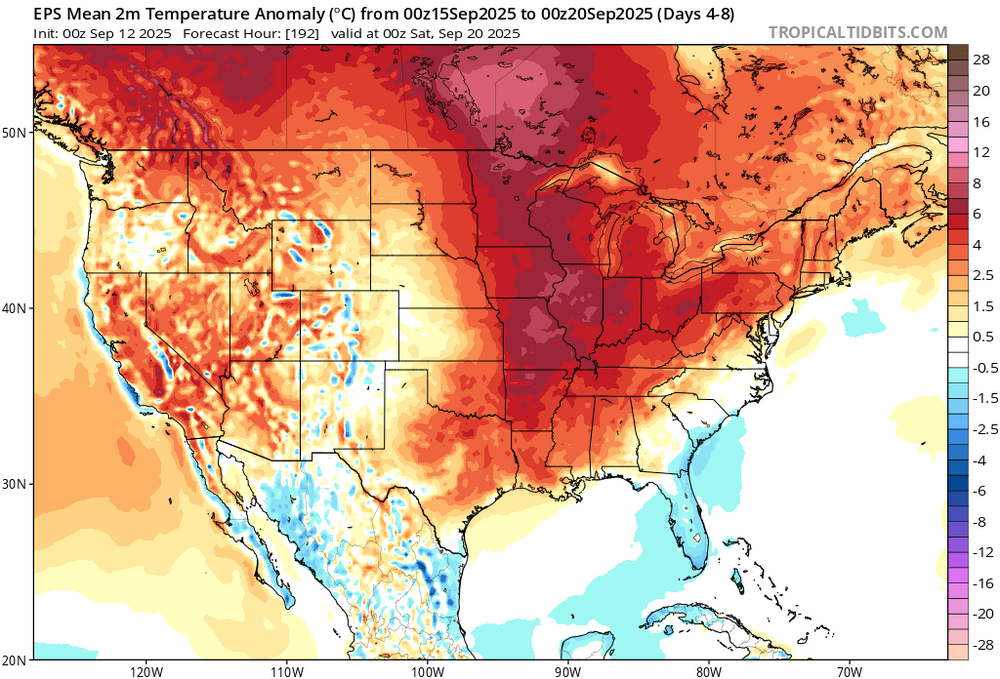
Models bring back the mid to perhaps upper 80s again going forward for the usual warm spots. Much drier pattern returns as the recent rains were just a blip in the expanding drought pattern. The cool departures will begin shrinking. If we get a warmer Sep 21 to 30, then the month could finish with a + departure.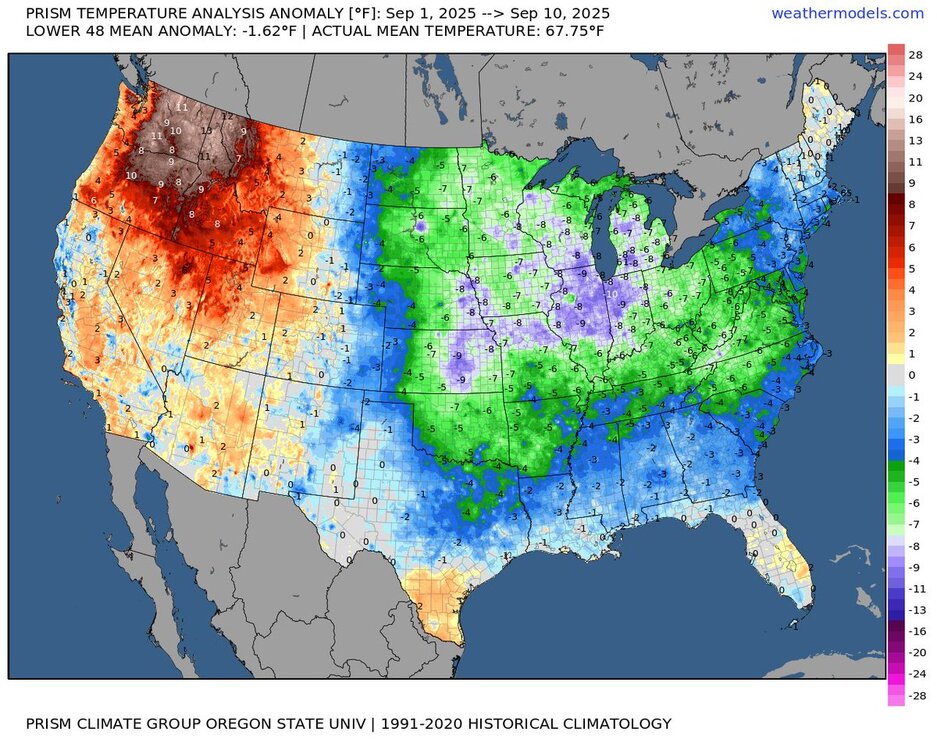
-
Injuries and no energy. GB might be best team in NFC
-
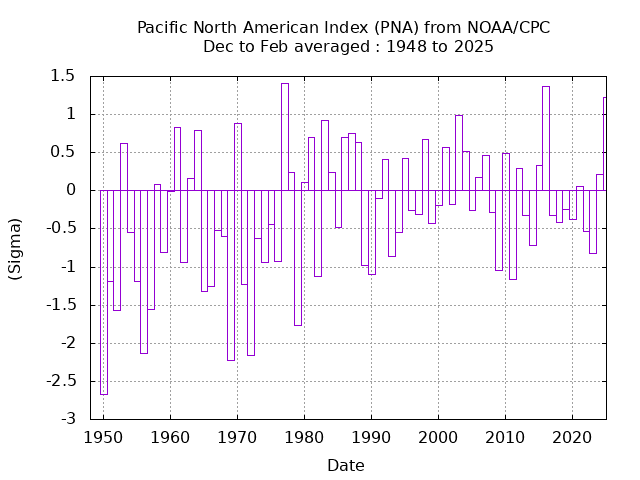
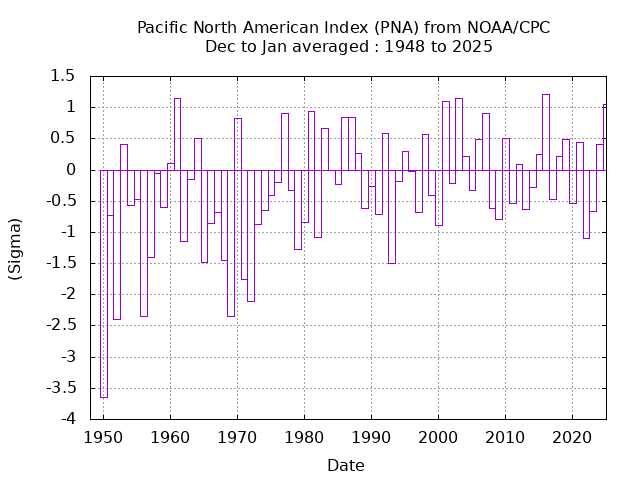
It didn’t work out this past winter and we saw one of the strongest +PNA patterns from December into January since 1948. But you are correct that prior to this winter it was a good indicator. Even though the CPC registered ad a +PNA in February, the 500mb PNA had a more negative look. In any event, the winter PNA has been trending more positive since 1948.
-
This was mentioned extensively last fall….the research showing that +QBO/-ENSO causes a more poleward Aleutian High, while -QBO/-ENSO causes a more flattened, equatorial Aleutian Ridge. HM had a blog on this many years ago, which unfortunately I can’t find the link to anymore. IF this research is correct, then we will see it come “cold season” (Nov-Mar).
-
should ramp up a bit through Oct. 1., though obv not going out on a limb saying that. Pretty dead overall