All Activity
- Past hour
-
90 Sunday in the interior if these new NAM 12z grid numebrs are right. I don't think its profile over Logan is right 18z+, tho. NAM is spuriously cooling the 850 mb level where it should be roasting them because that day has a westerly wind burst in the BL to 20 kts coming down from 280 degree direction, under superb solar max heating (off a high launch no less...). The mixing quotient should have that level closer to what it's doing over LGA, rising a couple clicks...not falling. So, it keeps the exit temp in the 82 range via adiabats when it should be about 91 given so going to toss ... It will be interesting to start delving into these kind of OCD inspections when the new model versions cripple the forecast community in a couple of months. HAHA
-

2026-2027 Strong/Super El Nino
snowman19 replied to Stormchaserchuck1's topic in Weather Forecasting and Discussion
Regardless of whatever has happened in the past, I don’t think this event has any problem at all becoming a super El Niño on the RONI or the ONI -
70's on tap today, but was warned on local news last night that some blowing dust could enter the picture from the Dakotas. Skies are a little milky this morning. Gusty W winds today with low RH has a big chunk of the N areas under a Reg Flag warning. Lots of rain coming next week, tho.
-
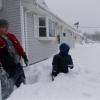
I needed roof repairs and a new window after that day, not fun.
-
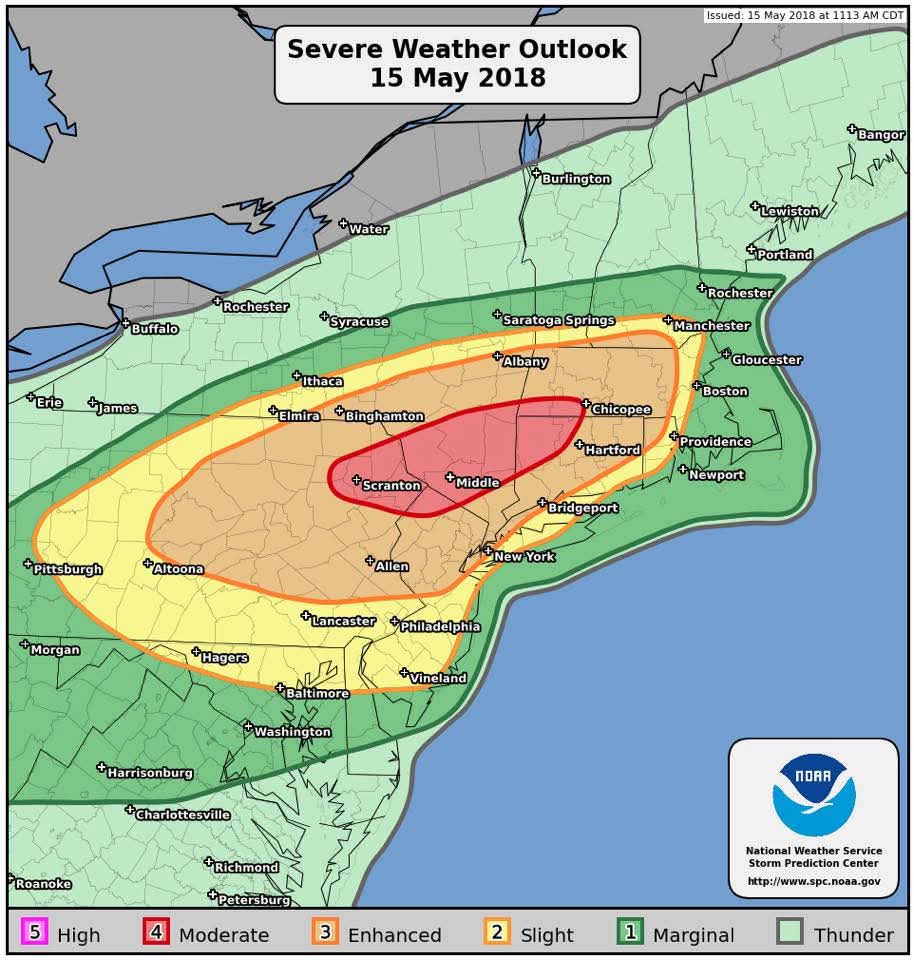
May 15 1998: Damaging tornadoes impact Minnesota. One tornado hits a flea market in Albany, killing one person and injuring 30 others. 102 homes are severely damaged in the northern Twin Cities due to another tornado. 1969: Torrential rain occurs in Synnes Township, dumping 8 inches of rain in three hours. For Friday, May 15, 2026 1834 - The Northern Atlantic Coast States were in the midst of their greatest May snowstorm of record. The hills around Newbury, VT, were covered with two to three feet of snow. (David Ludlum) 1968 - A tornado touched down southwest of Anchorage, AK. It was the second of just three tornadoes reported in Alaska since 1950. (The Weather Channel) 1972 - The worst ice jam flooding of memory for long-time residents took place along the Kuskokwim River and Yukon River in Alaska. It was the first time since 1890 that the two rivers "flowed as one". The towns of Oscarville and Napaskiak were completely inundated. (15th-31st) (The Weather Channel) 1987 - Unseasonably warm weather returned to the north central U.S. Seven cities reported record high temperatures for the date, including Janestown, ND, with a reading of 96 degrees. Thunderstorms in Utah produced five inches of rain south of Bicknell. (The National Weather Summary) (Storm Data) 1988 - Thunderstorms in Oklahoma produced wind gusts to 80 mph in Oklahoma County, and baseball size hail at Pawnee. Hail piled up to a depth of 18 inches south of Pawnee. Hail damage in Oklahoma was estimated at close to 25 million dollars. Thunderstorms in the Upper Midwest produced golf ball size hail around Cleveland, OH, and wind gusts to 83 mph at Angola, IN. (Storm Data) (The National Weather Summary) 1989 - Thunderstorms developing along and north of a stationary front produced severe weather in the south central U.S. Thunderstorms spawned eleven tornadoes, and there were 145 reports of large hail and damaging winds. Softball size hail caused 2.1 million dollars damage at Sherman, TX. (The National Weather Summary) (Storm Data) 1990 - Thunderstorms produced severe weather from the Central Plains Region and Oklahoma to Indiana and western Kentucky. Thunderstorms spawned fifteen tornadoes, including seven in Oklahoma, and there were 165 reports of large hail or damaging winds. A tornado killed one person, injured a dozen others, and caused four million dollars damage at Stillwater, OK. Another tornado injured eight persons at Foyil, OK. Thunderstorms in Oklahoma also produced wind gusts to 92 mph at Oologah Lake, and softball size hail at Canton and north of Oakwood. (The National Weather Summary) (Storm Data)
-
Maine seemed to have fewer juicy SWFE this past winter (just the one big one), which can be jackpots for western / northern areas.
-

Winter 25-26 (All Snowfall Maps & Season Total)
ORH_wxman replied to The 4 Seasons's topic in New England
Good map....def a lot of weirdness to the snowfall distribution this season....that Feb blizzard def juiced SE MA/RI I had 68.5" so the 66.6 near me is pretty accurate....we might need to fire those two coops in SE ORH county. Are those Buffumville and Northbridge? -
Aren’t seasons fun!
-
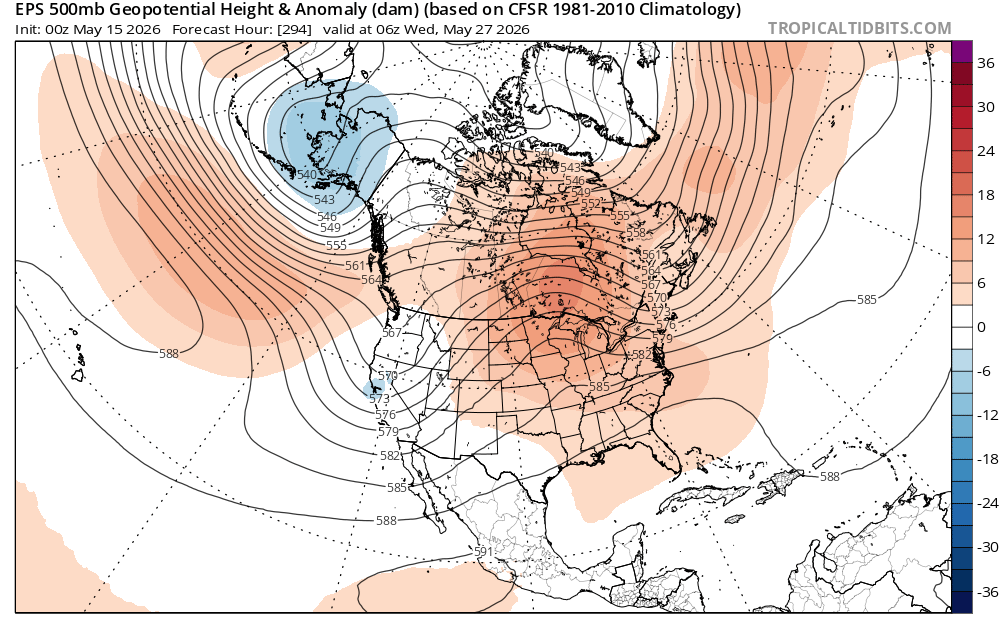
GFS a much more prolonged cut off uglier Memorial Day weekend then the Euro which pushes it out and north quickly with ridge building into the Mid west
-
Outside of the upslope sites, NNE did somewhat poorly, especially CAR. Their 86.4" ranks 74th of 87 and failed to have a 10"+ event for just the 4th time in 60+ years.
-
You know this reminds me ... I was just reading an article at phys.org ( paraphrasing site for deeper dive science papers ) that shows CC precipitation distribution is doing two aspect concurrently, world over. Water boarding gasping rates where it actually rains, while simultaneously ...everyone is getting drier ( on land of course..) in the general layout. I guess implying less opportunities. Intuitively this is probably more true in the interior of continents than it is around the seagull's range from the coasts. Anyway, what you described fits how a location might express the same. I guess wait until you get a slow mover in late June and the babbling creek under the street down the way suddenly flows over the road, scouring it completely away off a weather forecast for isolated thunder but primarily just partly sunny warm, high of 87
-
You're too young to have experienced the 1960s.
-
We're far enough from salt water to avoid significant marine influence. However, with a warming climate one might expect more convective events, but the opposite has been occurring. Our average for thunder days is 15 but in recent years it's been lower, and just 5 days last year, only the 2nd year below double digits (8 in 2010). Met summer had only 2 instead of the average of 10. Merely stochastic variation? (SSS - we moved here 28 years ago on May 15.) Had 1.28" between 9 last evening and 7:30 this AM, a very pleasant surprise given the modest forecast yesterday afternoon. With that drink, the coming 70s should bring an explosion of growth - leaf out here is a bit behind the average.
-
WAD
-
Back dat azz up
- Today
-
(002).thumb.png.6e3d9d46bca5fe41aab7a74871dd8af8.png)
Central PA Spring 2026 Discussion/Obs Thread
ChescoWx replied to Voyager's topic in Upstate New York/Pennsylvania
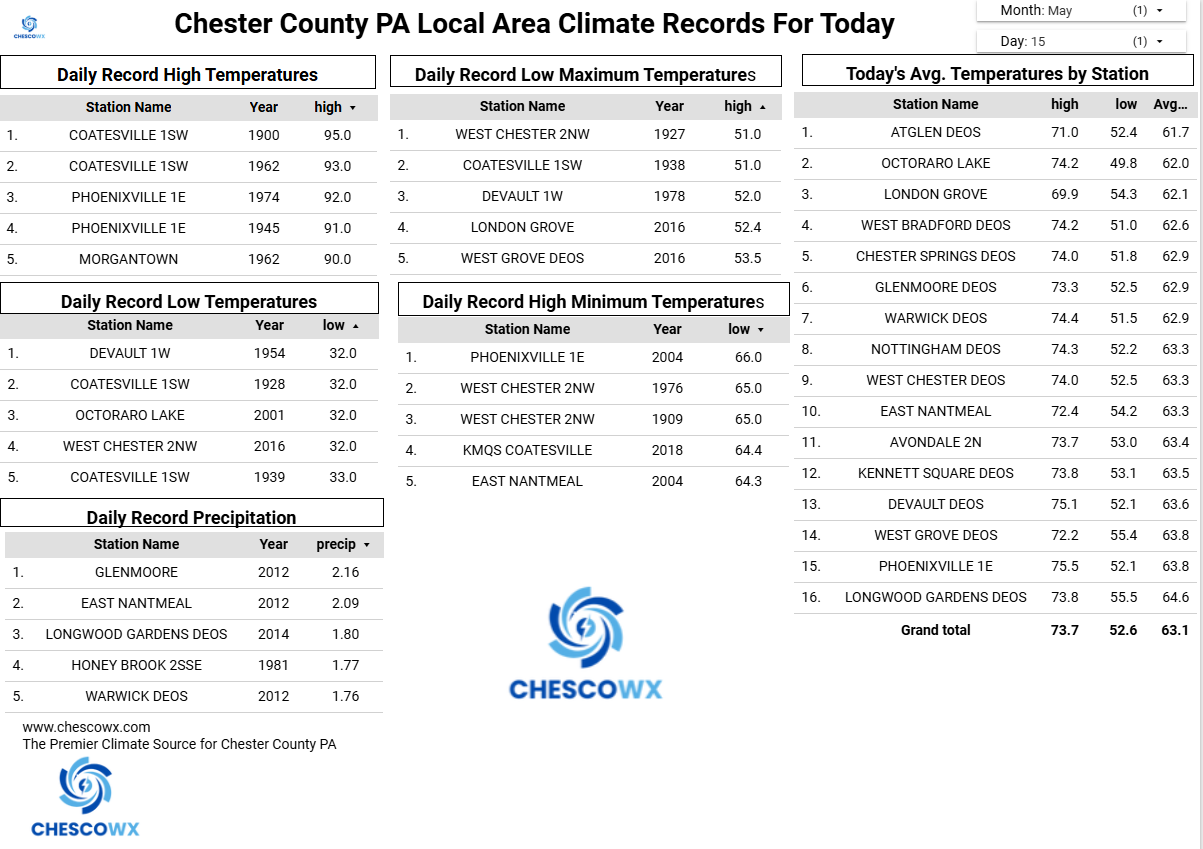
16 of our last 20 days have featured below average temperatures. Today will be another below average day before we start a strong warmup with temperatures by Tuesday approaching 90 degrees across especially the valley locations across the County. A cold front will cross the area later Wednesday with a chance of some showers. Following that front we should see temperatures fall back closer to normal levels by the end of next week.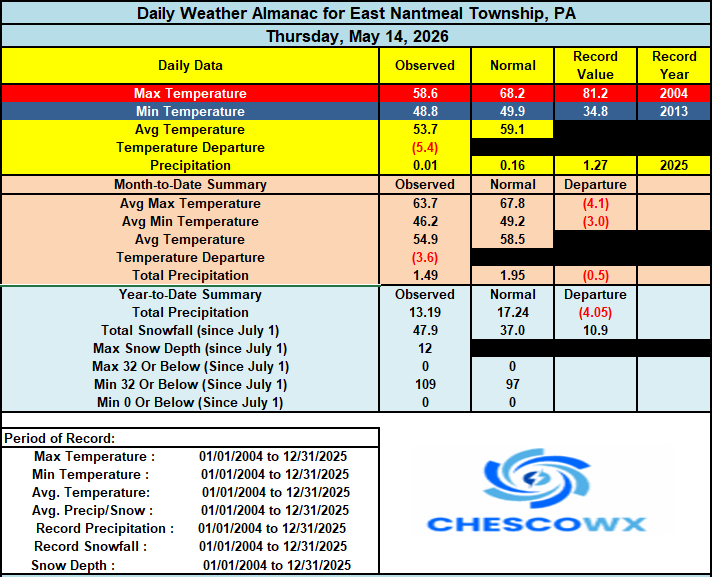

-
E PA/NJ/DE Spring 2026 Obs/Discussion
ChescoWx replied to PhiEaglesfan712's topic in Philadelphia Region
16 of our last 20 days have featured below average temperatures. Today will be another below average day before we start a strong warmup with temperatures by Tuesday approaching 90 degrees across especially the valley locations across the County. A cold front will cross the area later Wednesday with a chance of some showers. Following that front we should see temperatures fall back closer to normal levels by the end of next week.
-

2026-2027 Strong/Super El Nino
GaWx replied to Stormchaserchuck1's topic in Weather Forecasting and Discussion
My educated guess is that the current/daily RONI equivalent is ~+0.5 although like the ONI it is always moving, of course. -
Bought this place Apr 06…moved in Jun 06. Road washed out in between.
-
Yep that is life
-

Central PA Spring 2026 Discussion/Obs Thread
pasnownut replied to Voyager's topic in Upstate New York/Pennsylvania
good luck w/ the crops. Sounds like later is better for your garden. Happy planting. We gave up on our garden a couple years ago. I/we miss the "fruits of the labor, but it was my wifes hobby, and i was just the weed guy. I hate pullin weeds....lol. She just does small batch stuff in some of our larger beds. Jalapenos going in very soon she says. Her pepper jam is a crowd pleaser, just like her horseradish used to be. Have a good weekend all. -
yes it was! And I don't have any faith in seasonal outlooks so you've manage to penetrate my cynical lead on this one. Ha... I nailed the first 1/2 of winter; didn't do so good in the 2nd. Having said that, I also did not formalize any outlook so ... heh. I guess it doesn't count. Maybe if I had put the time in I might have thought differently about the back half but I bet I would have had trouble getting out of my own way. See, for NINA-decaying springs - according to my own linear eval of correlations of other ENSO of past vs the cosmic dildo - there's an interesting 2ndary offset mode for bombastically warm AMJ. As 2ndary implies, it's not the leading mode. But there's a cluster. So they don't always happen, but the ones that did went impressively warm. I felt 'hot' on the dice roll. I took a rather quick and glib gamble that CC would team up and weight the die - this could be one of those years to see an early spring. And for those of us that covet bombastically decisive endings and warm flips ...yay. Didn't really pan out. But here's the funny thing... as an after thought, CC is fucking up the analysis, anyway. See, we keep cooking up positive anomalies in the relative comparisons of just about everything. That makes is hard to parse out what is happening because of what. Example, March and April we regionally were above normal relative to climate... during a colder pattern construct. Oops. We did however bottom of the barrel below the results relative to the whole U.S., so pattern still expressed. It's like we have parallel processes going on.
-
Yeah, Islip is only ranked 13th warmest this spring for average high temperature due to the strong onshore flow influence. Areas to the west of the sea breeze are the top 5 for spring warmth. So next week looks like more of the same theme. Time Series Summary for ISLIP-LI MACARTHUR AP, NY Average Max Temp Mar 1 to May 14 Click column heading to sort ascending, click again to sort descending. 1 2010-05-14 60.5 0 2 2025-05-14 60.0 0 - 2012-05-14 60.0 0 3 2023-05-14 58.5 0 4 1991-05-14 58.1 0 5 2021-05-14 57.8 0 - 1999-05-14 57.8 0 6 2024-05-14 57.6 0 - 1977-05-14 57.6 0 - 1976-05-14 57.6 0 7 2002-05-14 57.5 0 8 2000-05-14 57.4 0 9 2016-05-14 57.1 0 10 1973-05-14 57.0 0 11 1985-05-14 56.9 0 12 2022-05-14 56.7 0 13 2026-05-14 56.4 0 14 2008-05-14 56.3 0 15 2006-05-14 56.2 0 - 1974-05-14 56.2 0 Time Series Summary for SUSSEX AIRPORT, NJ Click column heading to sort ascending, click again to sort descending. 1 2012-05-14 62.7 0 2 2025-05-14 62.4 0 3 2010-05-14 62.3 0 4 2026-05-14 61.5 0 5 2023-05-14 60.3 0 6 2024-05-14 60.2 0 7 2021-05-14 59.4 0 8 2016-05-14 59.3 0 9 2006-05-14 58.5 0 10 2004-05-14 58.1 0 Time Series Summary for PHILADELPHIA/MT. HOLLY WFO, NJ Click column heading to sort ascending, click again to sort descending. 1 2010-05-14 64.6 0 2 2025-05-14 64.5 0 3 2012-05-14 63.9 0 4 2026-05-14 63.8 0 5 2000-05-14 63.4 0 6 2002-05-14 62.5 0 7 2006-05-14 62.2 0 8 2024-05-14 62.1 0 9 2023-05-14 61.8 0 10 2021-05-14 61.6 0
-
1.11" yesterday and 0.05" from midnight through now.
-
8 years ago. Wild day for SW CT. Thankfully I outran it and missed driving through it coming home.