All Activity
- Past hour
-

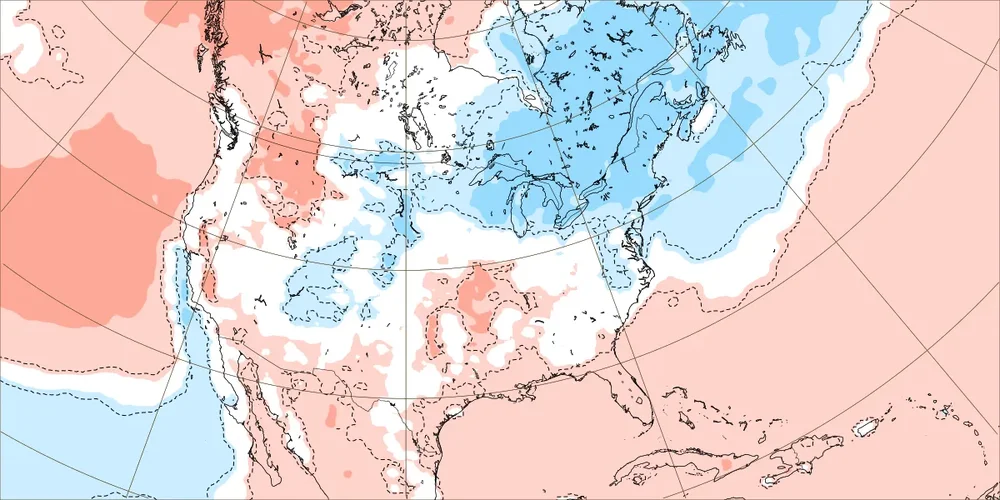
2025-2026 ENSO
KakashiHatake2000 replied to 40/70 Benchmark's topic in Weather Forecasting and Discussion
https://www.facebook.com/share/p/1ZRAvb2Cut/? climate prediction center on the new enso probabilities -
Look at that ridge pumping on the N/NE flow around Erin… If anything we need to wait for it to get out of the way to allow the return flow back in.
-
@canderson we find ourselves in a familiar spot currently Sent from my SM-G970U1 using Tapatalk
-
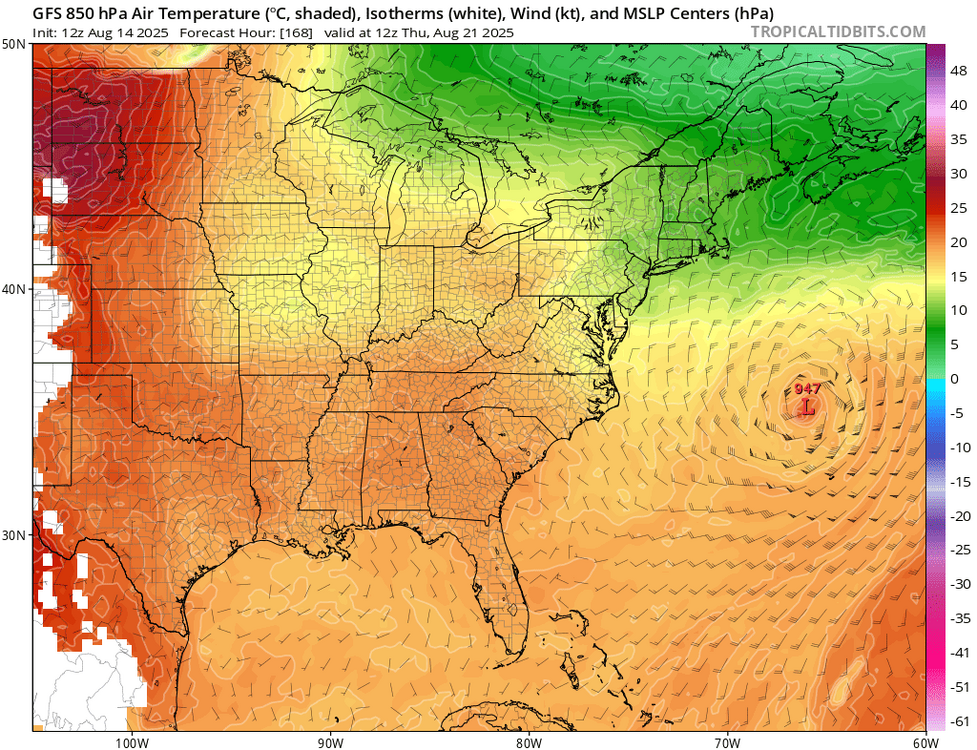
Invest 98L - 20/20 - Recon enroute Thursday afternoon
Windspeed replied to BarryStantonGBP's topic in Tropical Headquarters
This may have just enough time to close off prior to landfall. Might even get named. But the real threat here is the potential for significant inland flooding as any surface low moving inland will pull trailing feeder bands. Daytime heating, high CAPE, and an open tap on that bathwater will most likely do its thing for a flooding event this time of year. -
 watch out for surge pricing
 -

Invest 98L - 20/20 - Recon enroute Thursday afternoon
Scott747 replied to BarryStantonGBP's topic in Tropical Headquarters
Recon just left Keesler so it will be a few hours before any upgradable obs were to come in. As mentioned while it looks pretty it's not particularly impressive structurally. But who knows, if they find one barb of a west wind there could be PTC advisories initiated at 4. -

Tropical Storm Erin - NOW AT 50 KTS!
GaWx replied to BarryStantonGBP's topic in Tropical Headquarters
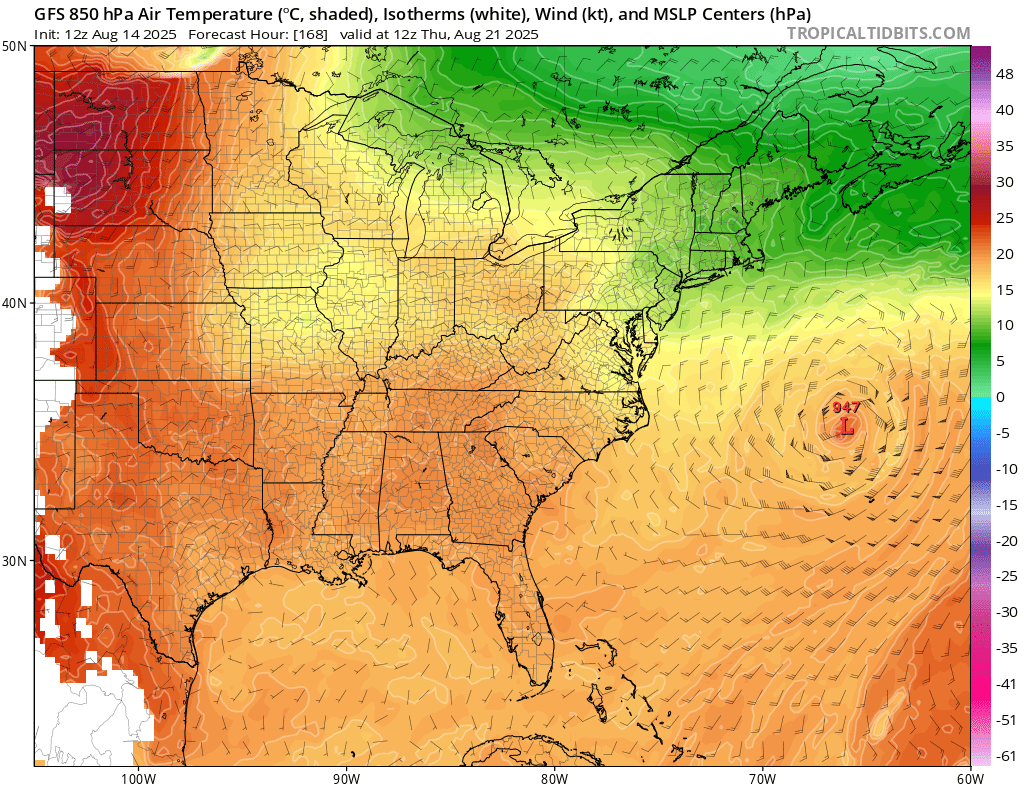
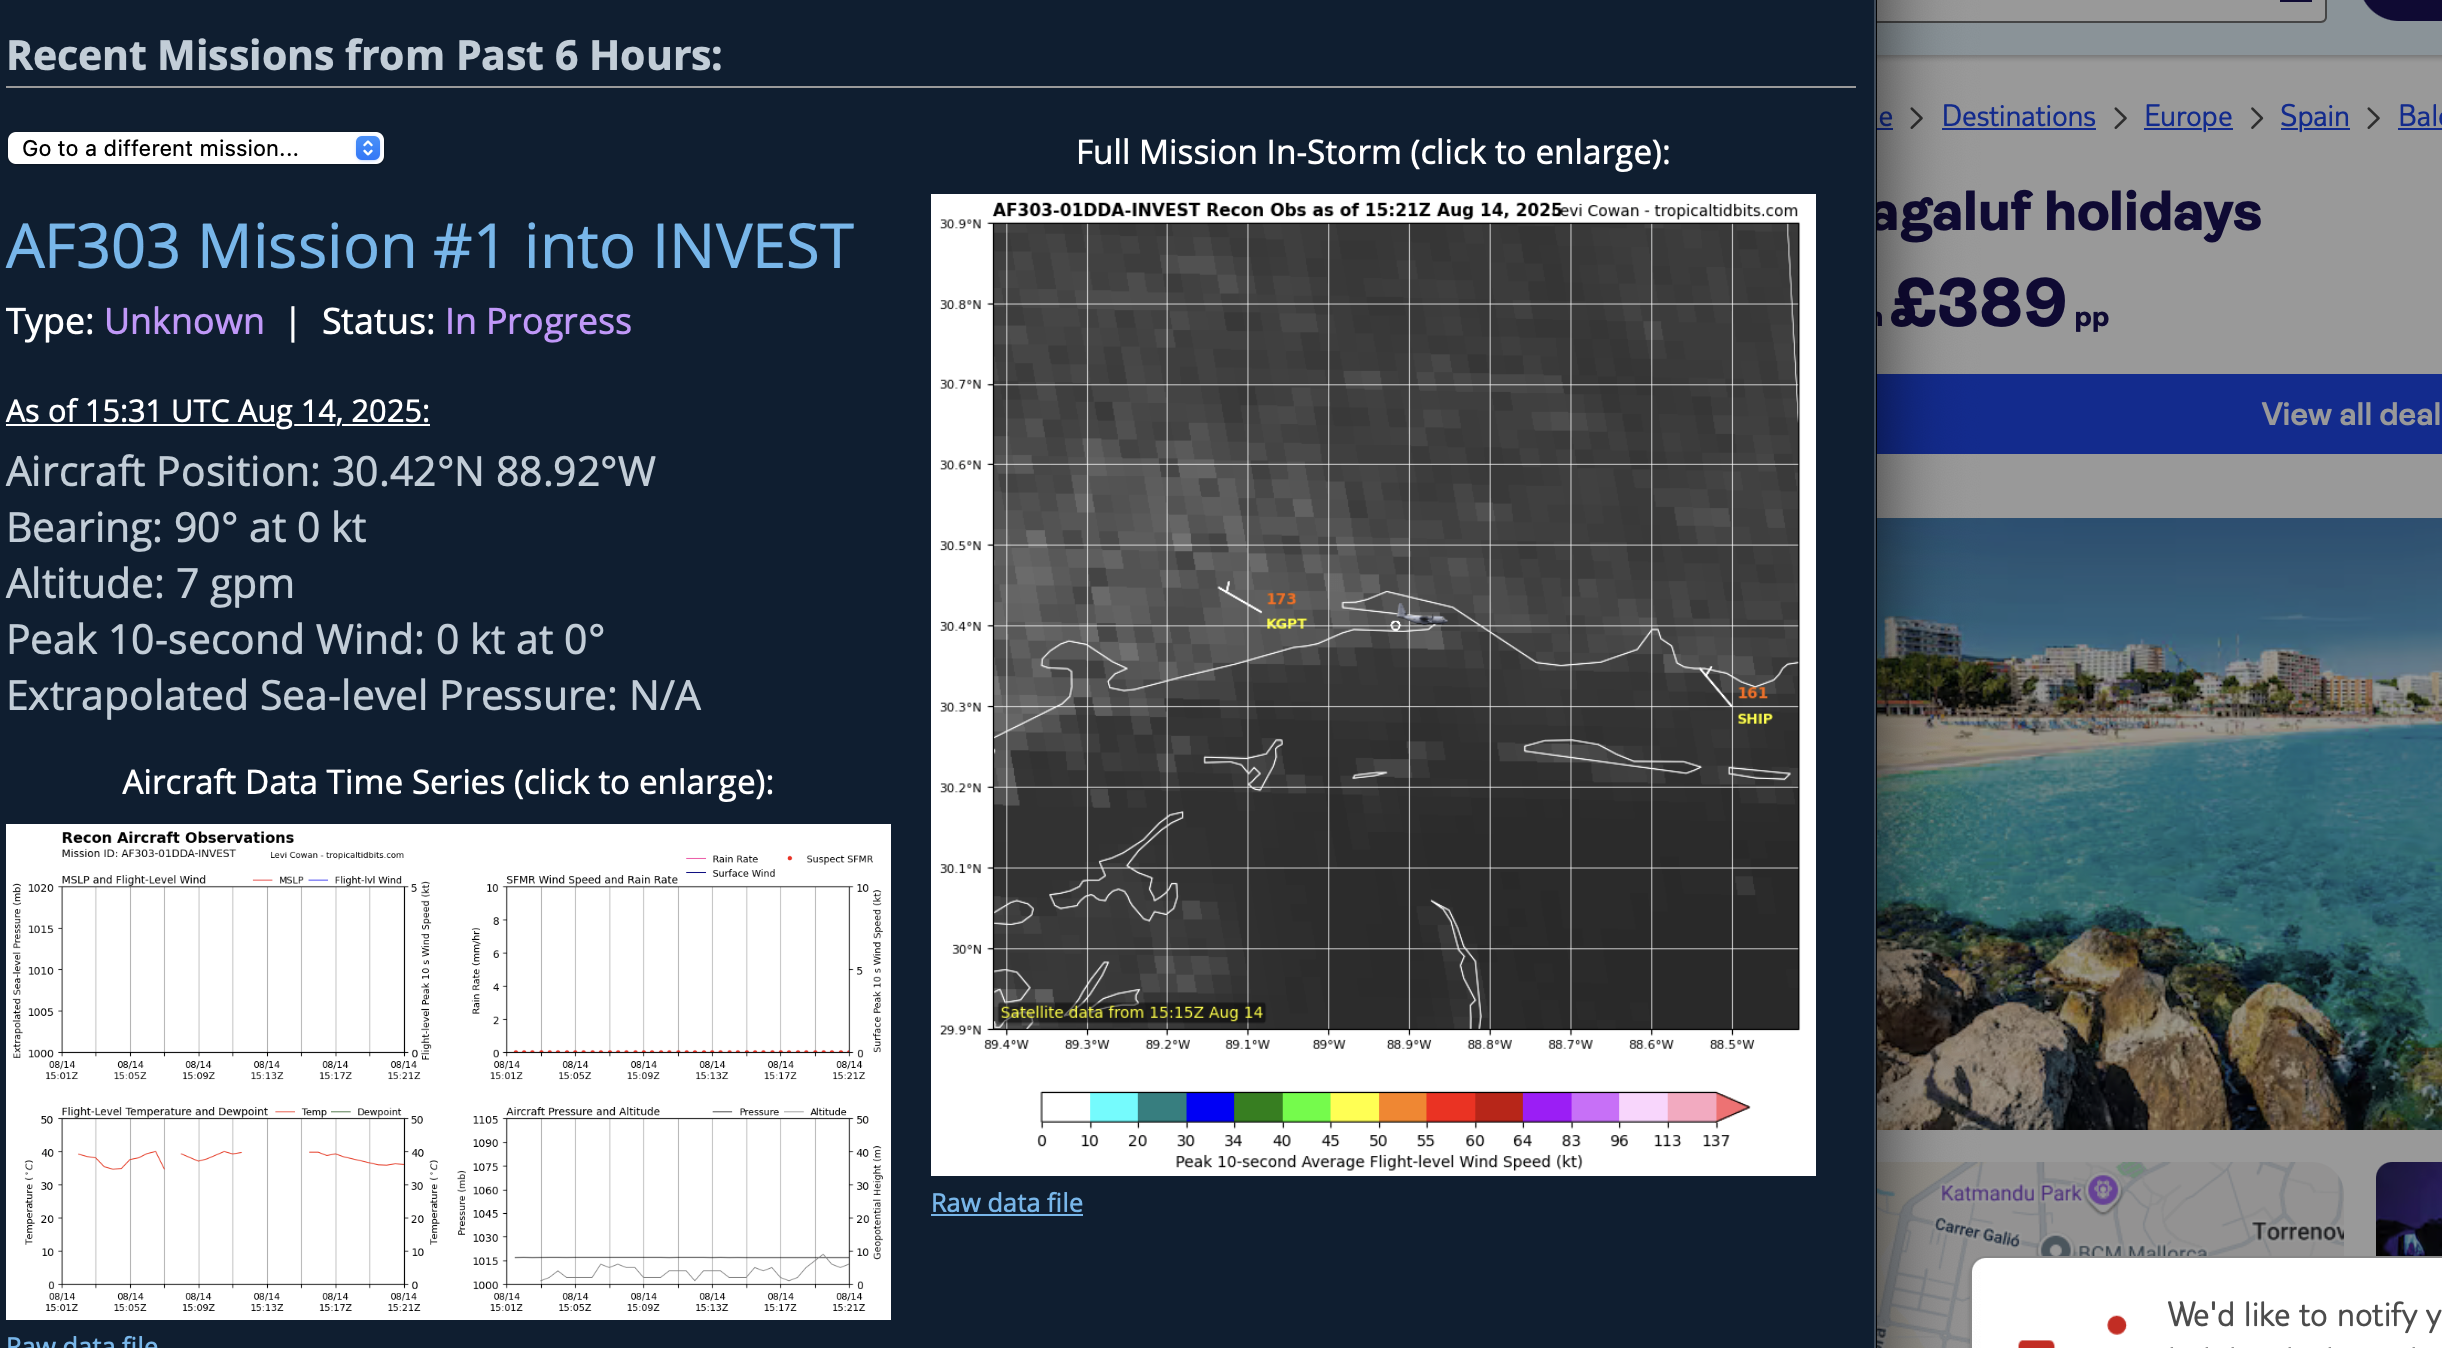
12Z UKMET: similar to last two with recurve at 71.9W: TROPICAL STORM ERIN ANALYSED POSITION : 16.6N 49.1W ATCF IDENTIFIER : AL052025 LEAD CENTRAL MAXIMUM WIND VERIFYING TIME TIME POSITION PRESSURE (MB) SPEED (KNOTS) -------------- ---- -------- ------------- ------------- 1200UTC 14.08.2025 0 16.6N 49.1W 1005 33 0000UTC 15.08.2025 12 17.5N 51.8W 1006 33 1200UTC 15.08.2025 24 18.5N 55.5W 1004 34 0000UTC 16.08.2025 36 19.2N 58.9W 1003 35 1200UTC 16.08.2025 48 19.7N 62.3W 999 36 0000UTC 17.08.2025 60 20.1N 65.0W 996 37 1200UTC 17.08.2025 72 20.8N 67.3W 993 41 0000UTC 18.08.2025 84 22.0N 68.9W 990 44 1200UTC 18.08.2025 96 23.8N 70.3W 988 49 0000UTC 19.08.2025 108 26.0N 71.2W 985 50 1200UTC 19.08.2025 120 28.3N 71.7W 981 52 0000UTC 20.08.2025 132 30.5N 71.9W 979 52 1200UTC 20.08.2025 144 32.6N 71.0W 976 59 0000UTC 21.08.2025 156 34.6N 68.7W 970 66 1200UTC 21.08.2025 168 36.4N 65.0W 969 63 -
Who cares? Add 2 degrees every day to their temps during the leaf season if it makes you hard.
-
I wonder if this correlation changes at all with the strength of the ENSO event. It's going to be a fairly weak event in terms of ENSO, so perhaps the correlation won't be as reliable. The weakest example you showed for 16-17 didn't match the expected pattern. I guess it may depend on what is driving it. I suppose the -PDO implies the atmosphere thinks its la nina regardless of ENSO, at least to some degree.
-

2025-2026 ENSO
40/70 Benchmark replied to 40/70 Benchmark's topic in Weather Forecasting and Discussion
I think it's a no-brainer to take the under on last year....odds are two La Nina seasons with a deeply -PDO will feature an extremely +PNA. -
This. And govt. money (i.e., taxes) is currently flowing 10 times faster to petroleum than it does to renewables.
-
The irony of a PA poster saying this in the MA forum lol.. come on
-

Central PA Summer 2025
Mount Joy Snowman replied to Voyager's topic in Upstate New York/Pennsylvania
Very interesting that you posted this because I was just coming here to say that I wasn't expecting this many blotches on the radar near us today, let alone at this hour. -
@FPizz can't wait to see this post, it's his favorite subject.
- Today
-
Good late morning everyone. A news article on the Accu weather site highlighted the occurrence frequency of 100 degree temperatures in US states/cities. The article stated that NYC has reached this temperature 60 times since the early 1900’s, yet not once in the last 13 years. I have the good fortune of belonging to this forum and while snapshot articles like this are beneficial and superficially informative they are, in a way, misleading. Our city temperature is taken and recorded for general public reporting at a beautiful urban oasis known as Central Park, located in its smallest borough, Manhattan. The city has experienced boroughs wide 100 degree temperatures in the last 13 years. The Accu weather daily report showed my Cobble Hill Brooklyn neighborhood standing at 103 degrees while the official Central Park ASOS temperature never went above 99. The screenshot of the NYC portion of the article is below. As always ….

-
 RECON ABOUT TO PENETRATE LADS
 -
USGS has added some of the NW areas of the board into the D0 classification.
-
The longer nights do make it cool down more than it did in June and July though. I don't keep my a/c on all night like I did in those months. That said, it came back on at 11 am today, it's really humid even without any sun.
-
-
 Yep, my a/c was turned back on at 11 AM and there isn't even any sun today. On Monday I didn't turn it on until 4 PM.
 -
Nice to see this on the latest weeklies. Temps have been dropping for that period over the next few days.
-
 Feels much worse than the 90 on Monday
 -
not really lol
-
wow lots of historic heat in extremely hot summers on this date 1933: Bakersfield, CA reached 117° to set their all-time record for August. Hanford reached 115° for the second day in a row, tying their all-time August high temperature record. (Ref. Wilson Wx. History) 1936 - Temperatures across much of eastern Kansas soared above 110 degrees. Kansas City MO hit an all-time record high of 113 degrees. It was one of sixteen consecutive days of 100 degree heat for Kansas City. During that summer there were a record 53 days of 100 degree heat, and during the three summer months Kansas City received just 1.12 inches of rain. (The Kansas City Weather Almanac) 1980: National Airport had a 98° high temperature today the last of 21 consecutive days of 90°F or more. (Ref. Washington Weather Records - KDCA) The temperature reached the century mark for the 53rd time in Dallas, TX, establishing the all-time record for 100 degree plus days in a year. (Ref. AccWeather Weather History) 1988 - Eighteen cities in the northeastern U.S. reported record high temperatures for the date, and the water temperature at Lake Erie reached a record 80 degrees. Portland ME reported a record fourteen straight days of 80 degree weather. Milwaukee WI reported a record 34 days of 90 degree heat for the year. Afternoon and evening thunderstorms resulted in about fifty reports of severe weather in the northeastern U.S. One person was killed at Stockbridge MI when a tornado knocked a tree onto their camper. (The National Weather Summary) (Storm Data) 2002: A 594 decameter area of high pressure off the Carolina coast produced hot south to southwesterly winds ahead of a cold front bringing record heat to parts of the east. The temperature in Boston, MA reached 101°, equaling their August record (8/2/1975). Other daily records included: Syracuse, NY: 101°, Concord, NH: 99°, Hartford, CT: 99°, Allentown, PA: 99°, Philadelphia, PA: 99°, Milton, MA: 98°, Providence, RI: 98°, Rochester, NY: 97°, Harrisburg, PA: 97°, Burlington, VT: 96°, Binghamton, NY: 95° and Erie, PA: 94°. (Ref. Wilson Wx. History) In San Angelo, TX, just after midnight, a descending heat-burst jumped the temperature from 75° to 94° in 30 minutes. The event ended about 90 minutes later when the temperature fell back to 73°. (Ref. Wilson Wx. History) (Ref. WxDoctor) The tropics were very active in 1953 and we still managed to have a historic heatwave and triple digit temperatures right at the peak of hurricane season in September!!! 1953 - Hurricane Barbara hits North Carolina as a Category 2 hurricane. Damage from the storm was relatively minor, totaling around $1.3 million (1953 USD). Most of it occurred in North Carolina and Virginia from crop damage. The hurricane left several injuries, some traffic accidents, as well as seven fatalities in the eastern United States; at least two were due to electrocution from downed power lines. Offshore Atlantic Canada, a small boat sunk, killing its crew of two.