All Activity
- Past hour
-
A strong NAO blocking regime is in place and will persist into early November. As a result, an extended period of cooler than normal weather will prevail through the end of the month. Tomorrow will be another cool day. Temperatures will top out in the lower and middle 50s across much of the region. The unseasonably cool weather will continue into at least the middle of next week. Rain could arrive Wednesday night or Thursday. A significant rainfall is possible through Friday. The ENSO Region 1+2 anomaly was -0.4°C and the Region 3.4 anomaly was -0.6°C for the week centered around October 15. For the past six weeks, the ENSO Region 1+2 anomaly has averaged -0.15°C and the ENSO Region 3.4 anomaly has averaged -0.47°C. La Niña conditions will likely continue through mid-winter. The SOI was +24.62 today. The preliminary Arctic Oscillation (AO) was +0.187 today. Based on sensitivity analysis applied to the latest guidance, there is an implied 50% probability that New York City will have a cooler than normal October (1991-2020 normal). October will likely finish with a mean temperature near 57.9° (near normal). Supplemental Information: The projected mean would be 1.0° above the 1981-2010 normal monthly value.
-
NO thread before tomorrow morning. Surprisingly WPC DECREASED the expected rainfall in its afternoon forecast. Yet...all 12z ensemble models are same or increased amounts with CMCE leading the way. Could be routine less than 1" event... I think more than that due to likely southern track scoop, 150M 12 hr HFC passing across PA and a pretty strong 5H jet. Have to go with what will work best for the outcome which is modeled with varying solutions. Waiting it out. Maybe tomorrow morning at 630A... could end up <1" but I thiink significantly more for a part of the forum with wind 50+ for a 6 hr period Thu or early Fri. Patience and model watching...
-
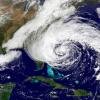
Yep, definitely getting its act together very good outflow in all quadrants. Sucking in some dry air south, southeast, east side for now should work out though fairly quickly.
-
High of 57. Been cloudy since mid afternoon. Currently 56.
-
Yes. Consistent with what would expect from the strong NAO block. Select Mean Temperature Data for October 22-31, 1980-2024: NAO -2.000 to -1.000: 51.0° All Other Cases: 55.0° 1980-2024 Mean: 54.3° If we can get such blocking regimes during winter, things will likely be quite a bit different in terms of snowfall from the last several paltry winters.
-
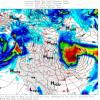
And the latest. Still quite a bit of uncertainty among the guidance wrt storm evolution and impacts. So the blend is the way to go for now. Most here only care about precip since it has been dry, so here is that. However depending on the exact track/evolution there could also be major impacts for coastal areas that took a big hit recently.
-

Spooky Season (October Disco Thread)
Snowcrazed71 replied to Prismshine Productions's topic in New England
Take the cutter now.... you get your high winds and we don't worry about getting cut out of any snow. -

Spooky Season (October Disco Thread)
CT Valley Snowman replied to Prismshine Productions's topic in New England
Enjoying the crisp fall air. 54 and mostly cloudy with a breeze. -
Of course but its nice to see a cooler pattern showing up .
-
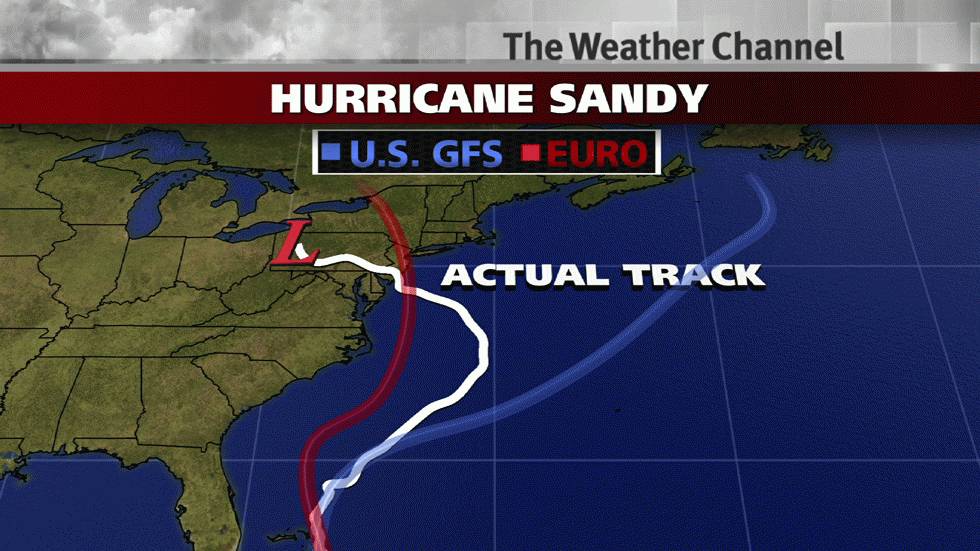
Thought this was pretty interesting. Would be much less so if not for the GFS being biased well east already… To be sure, not looking at Sandy and its forecast as a verbatim but an analog. That’s all. Right now the H5 output consensus is for east of Sandy, but I’m not discounting a hook back to eastern New England… Of course will have to monitor closely especially given the reduction in real time data, as noted above.
-
We need Arctic stream involvement for snow to the coast this time of year. Polar stream involvement means possible snow for the Poconos/Catskills.
-
I'm reading the Omaha weather balloons were resumed in April 2025 after a brief pause in March 2025.
- Today
-
its go time .. multiple VHTs going up
-
I don't disagree that weather balloons are important, but missing balloon data is commonplace throughout the world for various reasons, and the average daily missing balloon data globally far outpaces the missing American balloon data. The conversation started about model accuracy.
-
Probably not. It Probably doesn't make it in the short term or mid term with the way the indices are setting up.
-
Just phenomenal to have temperatures at 3:30 PM in the mid 50s with mostly clear skies
-

E PA/NJ/DE Autumn 2025 Obs/Discussion
Birds~69 replied to PhiEaglesfan712's topic in Philadelphia Region
60F/partly cloudy and actually not much of a breeze, surprising. 3:25pm -
Still colder than normal which is great to see. Hopefully winter comes early this year.
-
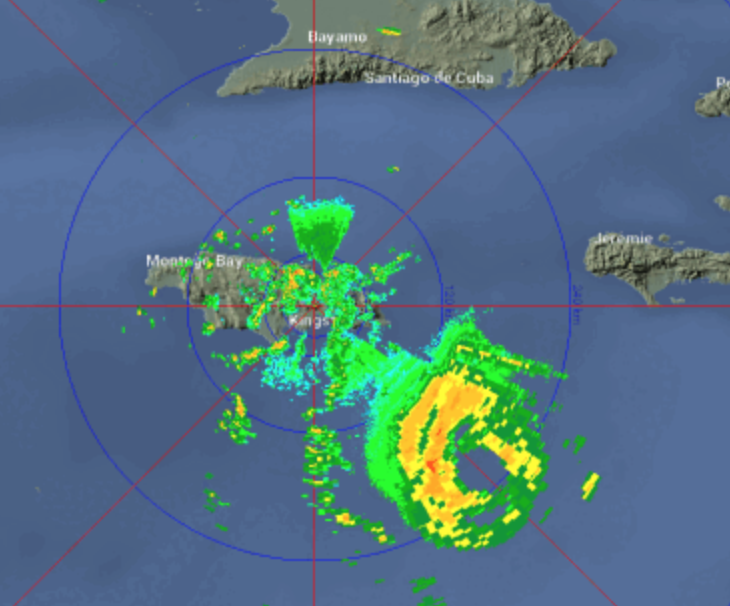
Hard to believe it's nearly 3 days from landfall based on that radar image. For context, Jamaica is about the size of Connecticut
-
On modeling while awaiting a hayride return.., imo ballon launches help confirm but imo, satellite,aircraft . Radar all contribute to improved modeling. We wouldn’t have had a clue in the 20th century. Modeling is pretty darn good and is the reason threads are startednonce some sort mood reliable agreement is reached. We evaluate the threads once started. Today’s D5 is reliable telling you whether something significant will happen. We on this forum have a difference of opinion. Model sensitivity to theNew England trough is part of the problem.? Others in NWS can explain
-

Spooky Season (October Disco Thread)
Damage In Tolland replied to Prismshine Productions's topic in New England
It’s turned into a screamer with strong SE winds -
-
Tom Skilling and Matt Lanza have a nice in depth discussion here on what the lack of balloon soundings may mean for the accuracy of weather model forecasts. https://www.facebook.com/TomSkilling/posts/weather-forecast-models-produce-forecasts-of-varying-accuracy-interestingly-some/1319935109491429/ With weather balloon observations regularly going off line at a whole series of key observation stations, we're moving into uncharted territory and hoping forecast models still behave. The concern is legitimate. Weather satellite and in flight aircraft data may help fill the void--but the data they provide is different than the more thorough balloon measurements. We may not see issues with model accuracy each day. But it's been established in some research work--and we know for a fact---that the upper air observations gathered by weather balloons carry disproportionate weight in influencing model accuracy. That's because their measurements of the atmosphere are in many ways more complete than other sources--such as satellite or in flight aircraft. NASA runs a global weather forecast model--the GEOS model. Among its roles is to look at the impacts of and distribution of gases and particulates in the atmosphere. It's also been useful in studying greenhouse gases and also the movement of dust and other particulates off the Sahara Desert westward out over the Atlantic and all the way to South and North America. It could also be used, were, God forbid, biological agents released into the atmosphere or a nuclear accident sent a huge amount of radioactivity into the atmosphere to track these agents and where they might go. So the NASA GEOS model isn't exclusively used for weather forecasting alone. But it IS an atmospheric forecast model and the data fed into it is comparable to the data fed into the full range of weather forecast models. You might have asked when you hear discussions of the fact different models come up with varying forecasts at times---"why is it they employ multiple models in the weather forecast process? Why not just one??" It's a reasonable question--and the answer is quite simple. It's because NO single model is perfect. Nor are our measurements of the atmosphere. Having multiple solutions from multiple models, each making slightly varied assumptions on how to handle the physics of the imperfectly measured atmosphere, offers human forecasters a range of possible forecasts scenarios--each valid yet some more likely to work out than others. When a common set of forecast solutions appears from varying models, it makes it easier to "cull" the less likely forecasts from the mix settling on the most accurate of the varied forecasts. NASA modelers have spent time looking at the observations fed into their model. By studying how the model behaves when certain data is flawed or missing, they've produced a ranking of which of the 210-million observations which go into many global forecasts based on their importance to the forecasts these models generate. A graphic I'm posting with this post lays out what they found. And interestingly, radiosonde data--in other words, weather balloon data--comes out as 2nd most influential of the different data sets which go into computer weather forecast models. This places weather balloon data in a uniquely powerful position. Eliminating balloon data from a set of stations, which has begun happening in greater numbers in recent months due to budget cuts, won't be something which messes up model predictions every day or in the same way. What it DOES suggest is that unexpected, hard to identify impacts may well occur. And who's to say that won't happen on a day when tornadoes or a snowstorm is a occurring and you need an accurate model read on how the extreme weather situation is evolving----or, equally scary, when a hurricane is approaching. That unpredictable and varying accuracy is introduced into the weather forecast environment is very concerning. Also, since many of the stations which have been pulled off line by budget cuts are in tornado and severe weather prone areas, the uniquely accurate 3-D measurements of the atmosphere weather balloons provide is worrisome. ----------------------------------------------- One other period provided meteorological forecast modelers a unique opportunity to check out the impact of losing upper air data from weather balloons--and it resulted in a measurable loss in computer model accuracy. The world lost Russian weather balloon soundings during an outage in 2015. European Centre researchers studied the impact on the loss of these balloon reports during that outage. This was a much broader loss of weather balloon data than what is happening now. But the outage led to a significant loss in model forecast accuracy. Because global weather is part of a vast, interconnected system, the loss of a critical data set produces forecast accuracy issues upstream and downstream of the regions where such data is usually taken. The 2015 outage provided a rare glimpse of what happens when weather balloon data is lost. That was a much different era in meteorological science so it's difficult to precisely anticipate the sort of problems such an out would produce today. But the loss of data as critical as that which is provided by our radiosonde (i.e. weather balloon) network can't be dismissed. ---------------------------------- https://theeyewall.com/weather-balloon-launch-cuts-an-honest-look-at-how-it-should-impact-forecasts/
-
18z Best Track up to 75kt. AL, 13, 2025102518, , BEST, 0, 165N, 752W 75, 976,HU
-

Mid to long range discussion- 2025
WinstonSalemArlington replied to wncsnow's topic in Southeastern States
One of the best late summer to mid fall periods we have had, drought notwithstanding