All Activity
- Past hour
-
Nah, Wed is a big time +d(hgt) day. That's going drop a ton of bricks on any vertical attempt. That day's likely to be that kind of blue sky that sounds like arcing electricity.
-
We’re about due for our annual one nighttime thunderstorm per year
-
Heatwave for me is temps 90+. Will be in the upper 80's Tues-Thurs then back to avg. Higher dews will make it rather muggy, and heat advs/warns will be out for higher indexes.
-

2026-2027 Super El Nino
PhiEaglesfan712 replied to Stormchaserchuck1's topic in Weather Forecasting and Discussion
If true, 2027-28 is going to challenge 1973-74 and 1988-89 for the strongest la nina. Both of those followed robust el ninos, and broke relatively long (over a decade) strong la nina droughts. Remember, we haven't had a strong la nina since 2010-11. Strong La Nina: 1955-56, 1973-74, 1975-76, 1988-89, 1998-99, 1999-00, 2007-08, 2010-11, (2027-28) -
Looks like right along the theta-e axis. What happens tomorrow night could end up setting the stage for Wednesday too, particularly when it comes to any potential remnant outflow boundaries. We'll have to see how things time with shortwave energy and even shortwave strength but Wednesday has potential to be a higher-end severe day I think
-
Euro seems to have scaled back the heat a bit. 102 on Friday for a peak
-
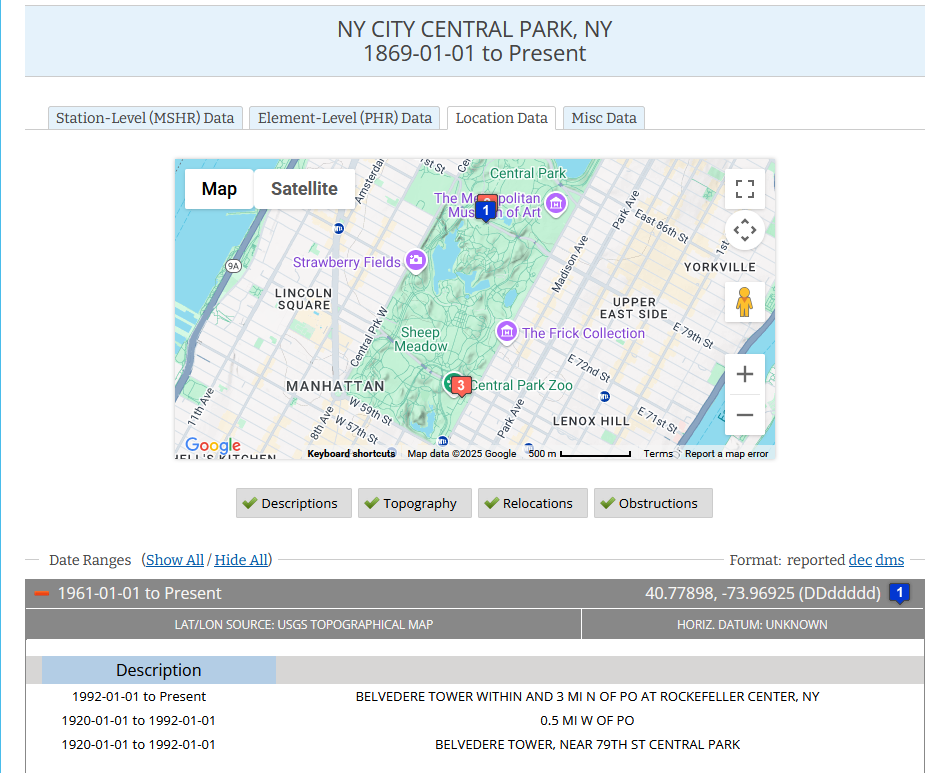
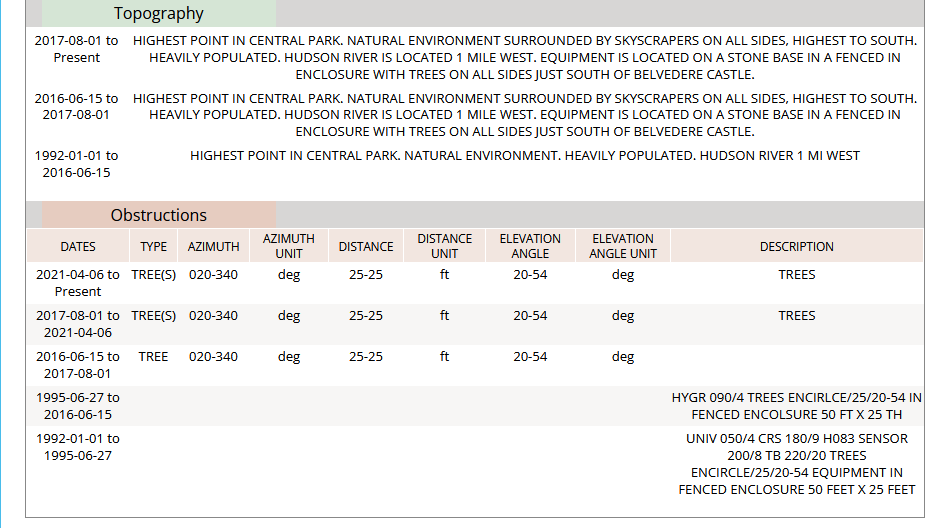
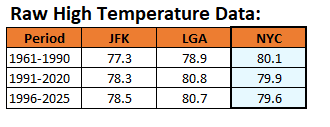
As an extreme air mass is poised to set temperature records across the New York City Metro Area during July 1-3, it is again worth noting that the strong cooling effect of Central Park's overgrowth of trees will make it exceedingly difficult for Central Park to reach 100°. It is likely that JFK Airport, LaGuardia Airport, Newark, and possibly Bridgeport, Islip, and White Plains could all reach 100°. Last June, the New York City area experienced its highest June monthly temperatures on record. JFK Airport topped out at 102° (old record: 99°, 1952, 1959, and 1964). LaGuardia Airport reached 101°, tying the mark set in 1952 and tied in 2017). Newark reached 103° (tying the record set in 2021). Bridgeport reached 97° (tying the record set in 2008). Islip topped out at 101° (demolishing the old mark of 96° from 1966 and 1994). White Plains reached 98° (tying the record set in 1952 and tied in 1953). A shaded Central Park reached just 99°. Based on a statistical regression equation (coefficient of determination: 0.941), for the 30-year period preceding the excessive tree growth (1966-1995), Central Park actually hit 100° on two days. Its peak temperature would have been 102° on June 24th, also setting a new monthly record (old record: 101°, 1934 and 1966). For good reason, homogenization is applied to long-term records to account for changes such as the tree growth that has been permitted to dampen Central Park's summer high temperatures. IMO, homogenization should be applied on a daily basis, given the persistent lack of interest in addressing the documented problem (as noted on NOAA's climate site inventory). How has tree growth affected Central Park? Even as average high temperatures have increased at JFK Airport and LaGuardia Airport during 1961-1990 to 1991-2020, they have decreased at Central Park. Through June 28th, Central Park's mean June temperature is running 0.5° below that of JFK Airport, even as JFK is affected by the sea breeze. Only 2015 (0.03° margin) had a warmer mean June high at JFK airport. To date, Central Park's highest monthly temperature is 91°. Here's how it compares with the other sites in the New York City area: Bridgeport: 91°; Islip: 94°; JFK Airport: 96°; LaGuardia Airport: 98°; Newark: 97°; and, White Plains: 92°. Based on the statistical assessment, Central Park's monthly high is likely 97° (June 11-12). In terms of 90° or above days, Central Park stands at 2 days in June. Here's how that compares with the other sites in the New York City area: Bridgeport: 1 day; Islip: 2 days; JFK Airport: 2 days; LaGuardia Airport: 6 days; Newark: 7 days; and, White Plains: 2 days. The statistical estimate suggests 4-6 days are likely to have occurred this month.

-
Not impossible... Friday's more susceptible. Objective guidance has a slow leak in the ridge bubble, hissing as the flow pancakes going into Saturday; altho staying above normal overall. That goes from ridge suppression curvature, to more of a zonal W-E flow structure. No real cold fronts there... so heat languishes into the weekend, ** unless** the SW to WSW flow of 70+ DP plumes running up underneath, makes for statically more unstable environment from the IA all the way across and most importantly ... if it gets triggered. If the heat doesn't break from something like that, it may be a slow rot exit. Some machine guidance by the way still taps 90 on Sunday even though the ridge is remnant by then.
-
Mesos have some action tomorrow night
-
If we can make it to 103 here, having a low of -7 earlier this year, the 110 degree range is one of the largest I can think of since I've been tracking.
-
CT is just a rest stop between Boston and NYC.
-
Wednesday looks pretty solid
-
Watch 'em get 30 foot corn stalks along that line
-

Fireworks Heat Contest W 7/1 - S 7/4 for Five MA Airports
WxUSAF replied to nw baltimore wx's topic in Mid Atlantic
DCA: 98, 101, 100, 97 BWI: 97, 102, 101, 97 IAD: 96, 99, 98, 96 SBY: 97, 100, 99, 98 RIC: 98, 100, 100, 98 Rain: 0.45” -
Having lived in North Dakota for a decade, this is spot on. With heat, once you're naked or have loose all white clothing on, there's nothing else you can do. With cold, just put on more layers. I will take -10 / -10 vs. 100/75 any day. Can you believe I have to work with this guy?
-

Junorch obs and discussion 2026
Damage In Tolland replied to Damage In Tolland's topic in New England
Seems like Tuesday and Friday are best shots. EML in place late week. If we can derecho and blows groves of forests down and/or blow windows out of buildings, most folks should be happy. With you in BOX this week, we expect to see some acknowledgment of their CT counties rather than AEMRIATT -
Rough morning for this DOT station. Temp sensor blown into a tractor trailer diesel exhaust? https://mesowest.utah.edu/cgi-bin/droman/meso_base_dyn.cgi?stn=SD607&time=GMT
-
E PA/NJ/DE Summer 2026 Obs/Discussion
JTA66 replied to PhiEaglesfan712's topic in Philadelphia Region
Heard a lone cicada on this morning's Jebwalk. Seems a little early in the season, so maybe he's just an early riser. Finished with 1.05" last evening. I'm sure most was just run off, but hopefully whatever the lawn was able to absorb will help it survive the week. 70F/DP 69F -
My phones weather app doesn't have a single day at 100 or above for CLT now. (Yes I know its not accurate but hey Im trying to be positive lol) There is like 4 99 degree days in a row on there so not much difference but it beats the 103 and 104's that were being posted last week that I haven't really seen any of lately.
-

2026-2027 Super El Nino
GaWx replied to Stormchaserchuck1's topic in Weather Forecasting and Discussion
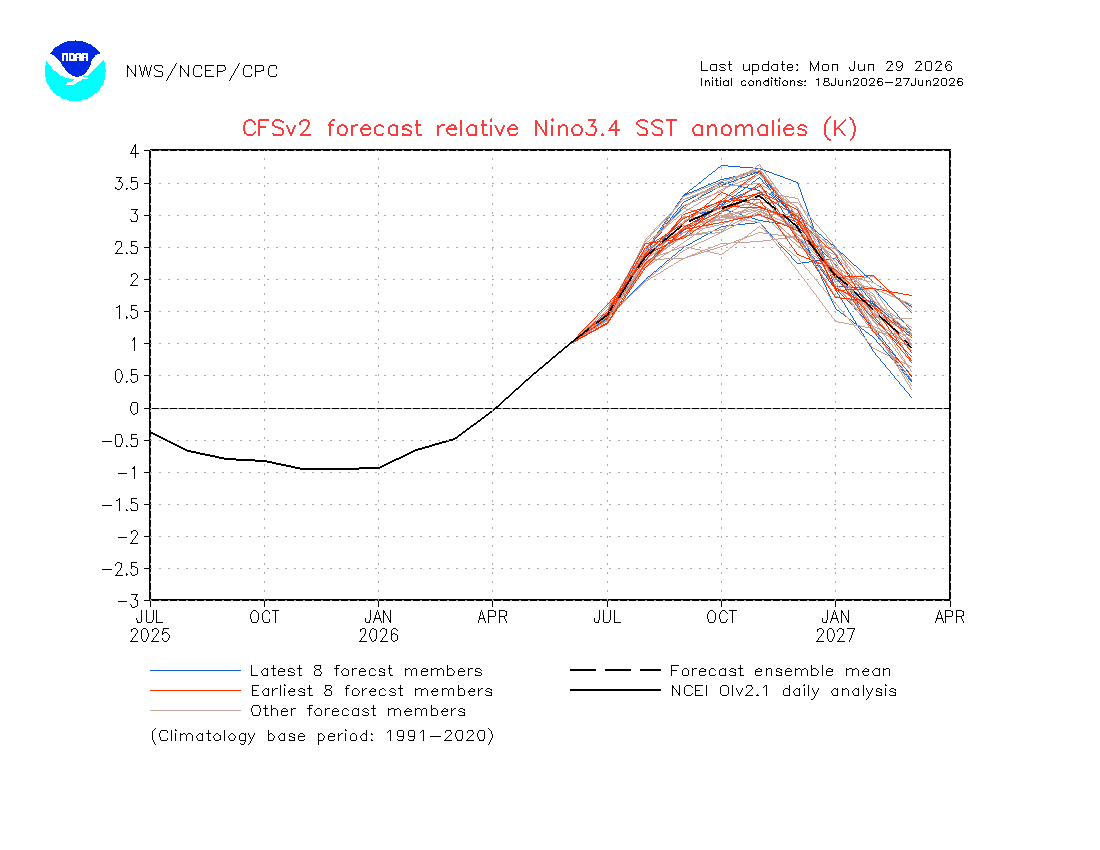
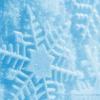
The latest CFS has its warmest relative 3.4 monthly peak yet, way up at a record high obliterating +3.3 in Nov! But note that it also still cools it at a record rapid pace all the way down to +2.0 in Jan, +1.5 in Feb, and +1.0 in Mar: @PhiEaglesfan712
-
12z HRRR catching on to the 0z RRFS?
-
What winds can the radomes withstand before worrying about damage risk?
-
Some guidance suggest the first day of 90+ is actually tomorrow W-N of any s-breeze contamination. I feel some of the guidance is low balling by a couple of ticks overall. The Euro's inventing cu fields with transparent anvils ...enough to rob the top 3 or 4. With 590+ dm heights under a capping ridge (i.e. DVM offset) it seems that could wind up too liberal with cloud production. Little nuances like that. We'll see, but it wouldn't surprise me if 24 and 36 hours before each day in this Wed-Sat period, we see the polish on this return.
-
2026-2027 Super El Nino
GaWx replied to Stormchaserchuck1's topic in Weather Forecasting and Discussion
Updated relative weeklies: Midweek date……..1+2………3……..3.4……..4 29APR2026 0.6 0.4 0.4 0.5 06MAY2026 1.0 0.5 0.4 0.5 13MAY2026 1.3 0.6 0.4 0.6 20MAY2026 1.6 0.7 0.5 0.6 27MAY2026 1.7 0.8 0.5 0.7 03JUN2026 2.0 0.9 0.7 0.7 10JUN2026 2.1 1.0 0.9 0.8 17JUN2026 2.4 1.3 1.1 0.8 24JUN2026 2.5 1.5 1.2 0.6 -
Maybe more impressive is that thing is just a ball of lightning. At its peak there were like 650-700 CGs in 5 minutes.