All Activity
- Past hour
-
But we can always pick out model errors with every model, short, medium, and/or long range. Cansips had a "relatively" decent forecast last winter and now the ever warm Cfs2 and arguably the latest Euro seasonal are looking similar to its forecast for this winter. They could all be right or wrong, but to pick out any one forecast from any one of them and say "it was wrong here, so I don't trust it" is tantamount to saying all modeling is useless. If that's the way you feel, that's fine because sometimes they are, but to cherry pick one forecast doesn't support your case it's going to be wrong one iota.
-
Ok JB lol [emoji23]
-
JB is just showing his lack of understanding of how the earth's climate works. Making a very simplistic argument that ignores the structure of the ocean. He needs to show that changes heat released at the bottom of the ocean made it all the way to the surface. The data is available from argo floats which get subsurface temperatures down to 2000m around the oceans. If seismic was driving our climate or having any significant impact at all we would know about it. I posted info previously which showed that the sun warms the ocean from the top down. Surface waters are less dense because they are warmer. In contrast the the waters at the bottom of the ocean where the vents are located are very cold and dense. That makes the ocean very stable. Ocean flow at the bottom of the ocean is horizontal in most locations. There is no way for changes in seismic activity to impact surface temperatures directly above the Atlantic vents. The only mixing between bottom and surface waters occurs in the arctic and antarctic where surface waters are cold enough to sink to the very bottom of the ocean. That's where the effect of any change in seismic heating would be felt at the surface. There is a much simpler explanation for the changes in the past year: changes in surface wind speed. Since warming is top down, The waters just below the surface are always cooler. Higher winds cool the surface waters by promoting mixing. Light winds allow surface waters to warm. Wind driven mixing usually extends to roughly 100m. I showed a chart upthread which showed that surface winds in the area that cooled are higher this year vs last.
-

July 2025 Obs/Disco ... possible historic month for heat
ineedsnow replied to Typhoon Tip's topic in New England
Thinking upper 80s the next couple days here.. should feel summery.. -

July 2025 Discussion-OBS - seasonable summer variability
bluewave replied to wdrag's topic in New York City Metro
Just look at all the new mesonet sites that have multiple elevation temperature observations. Temperatures most times decline with elevation from 2m to 10m and 30m to over 100m at some sites. The exceptions are during radiational cooling inversions and strong winter WAA when the higher levels warm more than the surface and we get fog. -

July 2025 Obs/Disco ... possible historic month for heat
dendrite replied to Typhoon Tip's topic in New England
Min 59.4° It’ll be a drastic turnaround today. 00z MAV for today and tomorrow
-

July 2025 Obs/Disco ... possible historic month for heat
kdxken replied to Typhoon Tip's topic in New England
Spending warm summer days indoors...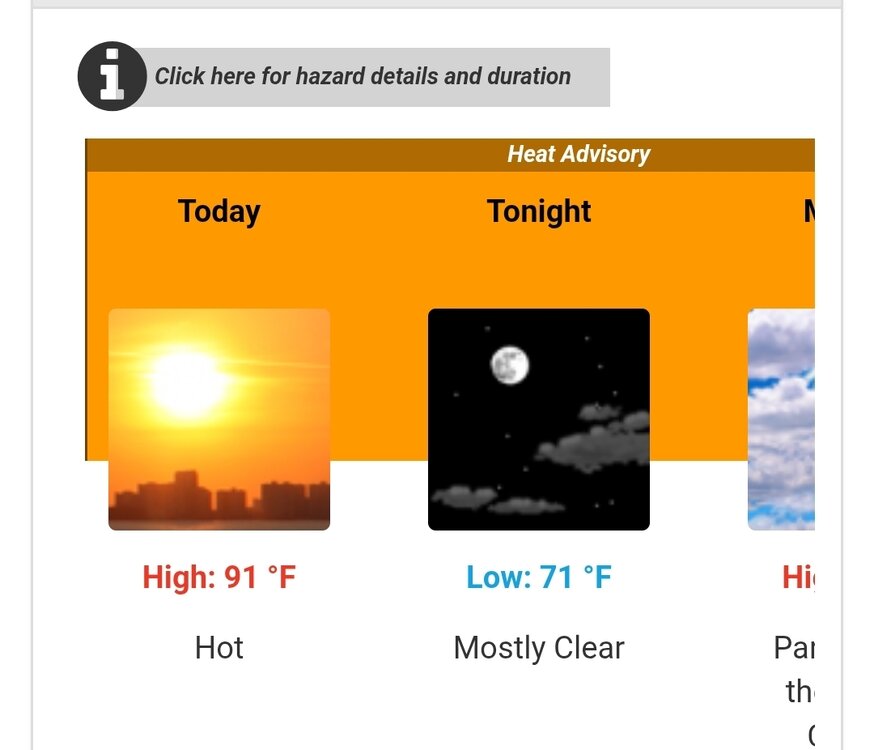
-

July 2025 Discussion-OBS - seasonable summer variability
LongBeachSurfFreak replied to wdrag's topic in New York City Metro
Allot of would depend on just how high of a rooftop. I would love to see obs from the top of the Nordstrom tower at 1550’. (Highest flat roof in nyc) Probably averages double the snowfall of the park. Not only a few degrees cooler due to height but also high enough to be out of the heat island near the ground. -
July 2025 Discussion-OBS - seasonable summer variability
bluewave replied to wdrag's topic in New York City Metro
Higher dew points and more clouds with onshore flow mean more rain chances. So your area usually sees at least 30-40 days reaching 90° each season. But the chances of going 20 straight days reaching 90° like in 1988 when it was much drier without interruption are very low. But the overall 90° day counts in NJ are much higher than the 1980s and 1990s. Just no really long extended heatwaves. So a bunch of shorter heatwaves giving you more total 90° days than you used to get. -
68 degrees with a high of 91 degrees today. Prayers for everyone in Texas.
- Today
-
No problem. We need some levity in here after what has happened since 2018-2019. My only comment on the CanSIPS is that temperatures never match the forecasted 500 mb pattern. Just look at the one month forecast for June to see what I am talking about. The 500mb forecast for June wasn’t bad. But the cold pool to the south was way overdone. So this has also been happening with the La Niña winters showing so much cold to the north around the Great Lakes, Northeast, and Canada. If that Southeast Ridge verifies like it’s showing for the winter, there will be much less cold to the north and the warmth to the south will be much more expansive. 500 mb pattern forecast not bad Cold pool to the south never verified


-
In Morehead city we just had a nasty squall move through with likely some 40 mph gusts. Wind is generally 20-25. Looks like ocean isle to Myrtle beach got a decent little blow from this storm overnight
-
A couple things. 1. This specific area has desperately needed rain as they've been dealing with a multi-year severe drought since at least 2022. It's just unfortunate that it came in the form of a historic flash food event. 2. There have been 56 confirmed deaths so far, and there's still 27 people missing. This is in part because the worst of the flooding occurred in the middle of the night.
-
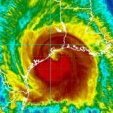
BULLETIN Tropical Storm Chantal Intermediate Advisory Number 6A NWS National Hurricane Center Miami FL AL032025 200 AM EDT Sun Jul 06 2025 ...CHANTAL A LITTLE STRONGER AND CLOSE TO LANDFALL ALONG THE SOUTH CAROLINA COAST... ...FLASH FLOODING CONCERNS INCREASE AS RAINBANDS MOVES ONSHORE... SUMMARY OF 200 AM EDT...0600 UTC...INFORMATION ---------------------------------------------- LOCATION...33.2N 78.8W ABOUT 75 MI...115 KM ENE OF CHARLESTON SOUTH CAROLINA ABOUT 85 MI...140 KM SW OF WILMINGTON NORTH CAROLINA MAXIMUM SUSTAINED WINDS...60 MPH...95 KM/H PRESENT MOVEMENT...N OR 350 DEGREES AT 8 MPH...13 KM/H MINIMUM CENTRAL PRESSURE...1002 MB...29.59 INCHES Recent aircraft and land-based radar velocity data indicate that maximum sustained winds have increased to near 60 mph (95 km/h) with higher gusts. Little change in strength is expected before landfall, with rapid weakening forecast after landfall. Tropical-storm-force winds extend outward up to 140 miles (220 km) from the center. Within the past hour, Springmaid Pier in South Carolina reported a sustained wind of 47 mph (76 km/h) gusting to 56 mph (90 km/h). The estimated minimum central pressure based on Air Force dropsonde data is 1002 mb (29.59 inches).
-
Yeah, this is really bothering all of us down here. Those poor little girls, alone in a raging river that rose something like 25 feet in 45 minutes. I was so relieved earlier tonight, skies were clearing and all the rain areas just went away. Then I just got mocked by the National Weather Service A Flood Watch has been extended through 1 PM Sunday. Additional rainfall amounts of 2-4 inches are possible with isolated pockets of 10 inches somewhere in the watch area. It is very difficult to pinpoint where exactly the isolated heavy amounts will occur in this pattern. Stay Weather Aware! Area Forecast Discussion National Weather Service Austin/San Antonio TX 955 PM CDT Sat Jul 5 2025 ...New UPDATE... .KEY MESSAGES... - Threat of Flash Flooding from slow moving and repeat heavy rains later tonight into Sunday morning. Flood Watch for the Hill Country and I-35 corridor has been extended through 1 PM CDT Sunday. - Continued unseasonably wet and "cool" Monday. - Turning seasonably drier and warmer next week. && .UPDATE... Issued at 955 PM CDT Sat Jul 5 2025 Multiple models show another round of showers and thunderstorms with pockets of heavy rains later tonight into Sunday morning. As a result, have extended the Flood Watch through 1 PM CDT on Sunday. Have also increased POPs for the Hill Country to along the I-35 corridor.
-
Posted just after 1AM in SE subforum by someone visiting N Myrtle Beach, he said this at ~1AM as it’s gotten quite stormy there (consistent with the radar): “Hello everyone, I normally post on the New England forum however I am in North Myrtle Beach and the weather has quickly deteriorated to heavy squalls and the wind has increased considerably in the last 30 minutes from an estimated 10 to 15 miles an hour to 20 to 25 with a couple of gusts that have been 40mph at least, I don’t have an anemometer however I think that is a pretty close estimate.”
-

2025-2026 ENSO
40/70 Benchmark replied to 40/70 Benchmark's topic in Weather Forecasting and Discussion
I'm just messing around, before Bluewave drowns me in the warm pool or raindance badgers me about how differently the Mexican monsoon is behaving from those years....that's just kind of what those H5 looks remind me of. -
2025-2026 ENSO
40/70 Benchmark replied to 40/70 Benchmark's topic in Weather Forecasting and Discussion
-
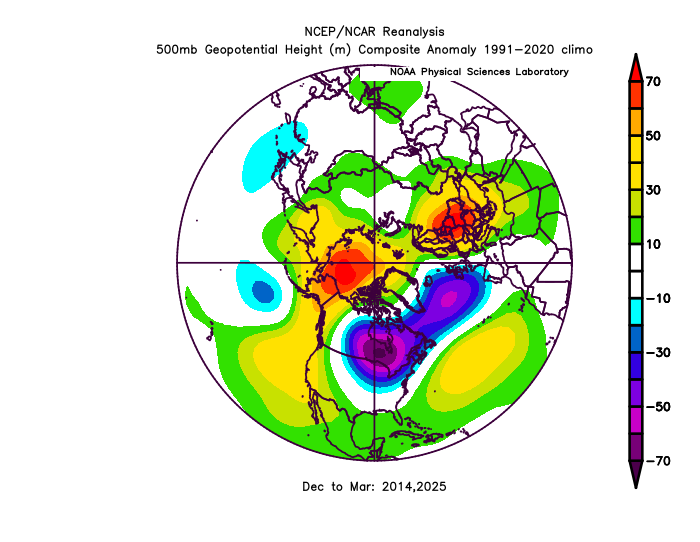
2025-2026 ENSO
40/70 Benchmark replied to 40/70 Benchmark's topic in Weather Forecasting and Discussion
Solid Consensus for NDJ H5: -

July 2025 Obs/Disco ... possible historic month for heat
FlashFreeze replied to Typhoon Tip's topic in New England
As I read your post I am here in North Myrtle Beach and the wind has gone from an estimated steady 10 to 15 miles an hour to a steady 20 to 30 with gusts considerably over 40 possibly a little over 45mph, heavy squalls coming through now, more exciting than I thought it would be. -
Hello everyone, I normally post on the New England forum however I am in North Myrtle Beach and the weather has quickly deteriorated to heavy squalls and the wind has increased considerably in the last 30 minutes from an estimated 10 to 15 miles an hour to 20 to 25 with a couple of gusts that have been 40mph at least, I don’t have an anemometer however I think that is a pretty close estimate.
-
2025-2026 ENSO
40/70 Benchmark replied to 40/70 Benchmark's topic in Weather Forecasting and Discussion
Geez....even the CFS isn't warm for the NE next winter. That thing is usually run by a tag team of Bluewave and snowman. Looks a lot like the CANSIPS at H5. -
As Barry posted, flash flooding is the biggest concern from Chantal. This covers NE SC and SE NC. The main area of solid rain is just entering these areas:URGENT - IMMEDIATE BROADCAST REQUESTED FLOOD WATCH NATIONAL WEATHER SERVICE WILMINGTON NC 1250 PM EDT SAT JUL 5 2025 NCZ099-109-110-SCZ054-058-059-061215- /O.NEW.KILM.FA.A.0002.250705T1700Z-250708T0000Z/ /00000.0.ER.000000T0000Z.000000T0000Z.000000T0000Z.OO/ COLUMBUS-INLAND BRUNSWICK-COASTAL BRUNSWICK-COASTAL HORRY-CENTRAL HORRY-NORTHERN HORRY- INCLUDING THE CITIES OF MYRTLE BEACH, LONG BEACH, SHALLOTTE, OAK ISLAND, AYNOR, LONGS, SOUTHPORT, LORIS, BUCKSPORT, CHADBOURN, BOILING SPRING LAKES, GARDEN CITY, SOCASTEE, SUNSET BEACH, GREEN SEA, NORTH MYRTLE BEACH, LELAND, WHITEVILLE, LITTLE RIVER, TABOR CITY, LAKE WACCAMAW, AND CONWAY 1250 PM EDT SAT JUL 5 2025 ..FLOOD WATCH IN EFFECT THROUGH MONDAY EVENING * WHAT...FLASH FLOODING CAUSED BY EXCESSIVE RAINFALL IS POSSIBLE. * WHERE...PORTIONS OF SOUTHEAST NORTH CAROLINA, INCLUDING THE FOLLOWING AREAS, COASTAL BRUNSWICK, COLUMBUS AND INLAND BRUNSWICK AND NORTHEAST SOUTH CAROLINA, INCLUDING THE FOLLOWING AREAS, CENTRAL HORRY, COASTAL HORRY AND NORTHERN HORRY. * WHEN...THROUGH MONDAY EVENING. * IMPACTS...EXCESSIVE RUNOFF MAY RESULT IN FLOODING OF RIVERS, CREEKS, STREAMS, AND OTHER LOW-LYING AND FLOOD-PRONE LOCATIONS. * ADDITIONAL DETAILS... - HEAVY RAIN FROM TROPICAL STORM CHANTAL WILL INCREASINGLY EFFECT THE AREA LATE TONIGHT INTO SUNDAY. - WEATHER.GOV/SAFETY/FLOOD PRECAUTIONARY/PREPAREDNESS ACTIONS... BE ESPECIALLY CAUTIOUS AT NIGHT WHEN IT IS HARDER TO RECOGNIZE THE DANGERS OF FLOODING. YOU SHOULD MONITOR LATER FORECASTS AND BE PREPARED TO TAKE ACTION SHOULD FLASH FLOOD WARNINGS BE ISSUED.
-

E PA/NJ/DE Summer 2025 Obs/Discussion
RedSky replied to Hurricane Agnes's topic in Philadelphia Region
It's awesome a tropical depression came out of nowhere to swamp the region Monday and Tuesday. This arriving BEFORE the wet period slated to be starting on Wednesday. Totally awesome -
Today the new monthly Euro seasonal outlook was released for August and beyond in the ATL basin. Compared to the prior monthly forecast, which was near the avg for the active period 1993-2015 for # of TS+/# of H and very slightly above the avg ACE, the new one is very slightly less active with very slightly below the 1993-2015 avg for # of TS+/# of H and right at the active period’s ACE avg. The distribution of storms is similar to the prior forecast, which again suggests less activity from the NE Caribbean to Bahamas/FL/SE US/E Gulf vs last year’s horrendous season. It suggests near to very slightly below the active 1993-2015 activity in those regions. So, that wouldn’t mean quiet but instead less active than a terrible year. Fingers crossed this will be right, especially for FL/SE US, because another year like 2024 could be a real disaster for especially FL’s home insurance industry.