All Activity
- Past hour
-
Yeah the couple of sunny days were pretty good. If the new growth doesn't drown, on the next 75° day you'll probably be able to see stuff growing!
-
They need to fix that 5/20 high for JFK. It is most definitely wrong
-
It's f00king raining cats and dogs.

-
Remember when one person in NE CT bought the GFS stein solution a week ago? Yeah...I do too.
-
The storm track through the Great Lakes again greatly reduced the snowfall potential around the NYC Metro and other coastal regions. This is a great storm track for areas away from the coast as was the case with the record snows from Toronto to Montreal. The cold focusing closer to the center of the North American continent has been a repeating theme since the big step up in global temperatures in 2015-2016. My guess is that the shrinking cold pool has been limiting the geographic coverage of these Arctic outbreaks. We haven’t had a top 10 coldest month in the Northeast since February 2015.
-
Have to dress like its winter today...not going to be fun sitting outside in the rain and cold.
-
Probably a top 5 episode
-
EWR: 5/19: 73 / 52 (-1) 5/20: 71/50 (-3) 5/21: 59 / 50 (-10) NYC: 5/19: 69 /51 (-4) 5/20: 67 / 49 (-6) 5/21: 59 / 49 (-11) LGA: 5/19: 70 / 52 (-4) 5/20: 68 / 50 (-6) 5/21: 59 / 49 (-11) JFK: 5/19: 74 / 53 (+3) 5/20: 76 / 50 (+1) 5/21: 58 / 50 (-8)
-
Man what a violent track that would be on HRRR.
-
Haha. The fact that some models were east would be a warning flag but would people heed it?
-
Records: Highs: EWR: 98 (1992) NYC: 96 (1941) LGA: 94 (1992) JFK: 94 (2021) Lows: EWR: 44 (2002) NYC: 42 (1907) LGA: 47 (1950) JFK: 43 (1990) Historical: 1876 - Denver CO was drenched with 6.53 inches of rain in 24 hours, an all-time record for that location. (The Weather Channel) 1911 - The temperature at Lewiston ME soared to 101 degrees. It was the hottest temperature ever recorded in New England during the month of May. (David Ludlum) 1987 - A powerful tornado virtually wiped the small southwest Texas community of Saragosa off the map. The twister destroyed eighty- five percent of the structures in the town killing thirty persons and injuring 121 others in the town of population 183. The tornado hurled trucks and autos through adobe and wood- frame homes, with some vehicles blown 500 feet. (The National Weather Summary) (Storm Data) 1988 - Thunderstorms produced severe weather over the Central Gulf Coast States. Tennis ball size hail was reported at Ripley MS. Showers and thunderstorms in southern Missouri produced 3.20 inches of rain at Springfield to easily surpass their rainfall record for the date. (The National Weather Summary) (Storm Data) 1989 - Unseasonably hot weather continued in southern Texas and parts of the southwestern U.S. Seven cities reported record high temperatures for the date, including El Paso TX with a reading of 100 degrees. Presidio TX was the hot spot in the nation with a high of 111 degrees. (The National Weather Summary) 1990 - Late afternoon and evening thunderstorms developing ahead of a cold front in the north central U.S. produced severe weather from northwestern Kansas to central Minnesota and southeastern North Dakota. There were twenty-nine reports of damaging winds, or dime to golf ball size hail. Strong thunderstorm winds gusted to 69 mph at Alexandria, MN. Showers and thunderstorms over eastern North Carolina soaked Wilmington with 2.91 inches of rain, which established a record for the date. (The National Weather Summary) (Storm Data) 2011: The Joplin Tornado was reported to have developed directly over Joplin with the first report of the tornado in Joplin at 5:41 pm CDT, 5/22. Latest reports from mid-day Tuesday 5/24 indicate an estimated 118 fatalities and several hundred injured in the Joplin, MO area. The Joplin tornado is the deadliest since modern record keeping began in 1950 and is ranked 8th among the deadliest tornadoes in U.S. history. The tornado surpassed the June 8, 1953, tornado that claimed 116 lives in Flint, Mich., as the deadliest single tornado to strike the U.S. since modern tornado record keeping began in 1950. The deadliest tornado on record in the U.S. was on March 18, 1925.
-
If this was winter…. Oh boy the wolves would be howling.
-
The 6 to 10 day period looks wet and below normal. No real heat on the horizon. Coolest air / above normal precip matches our area from some of the seasonal model runs.
.thumb.png.19040caf56be5ab6f745aa35d3e9d9ef.png)
-
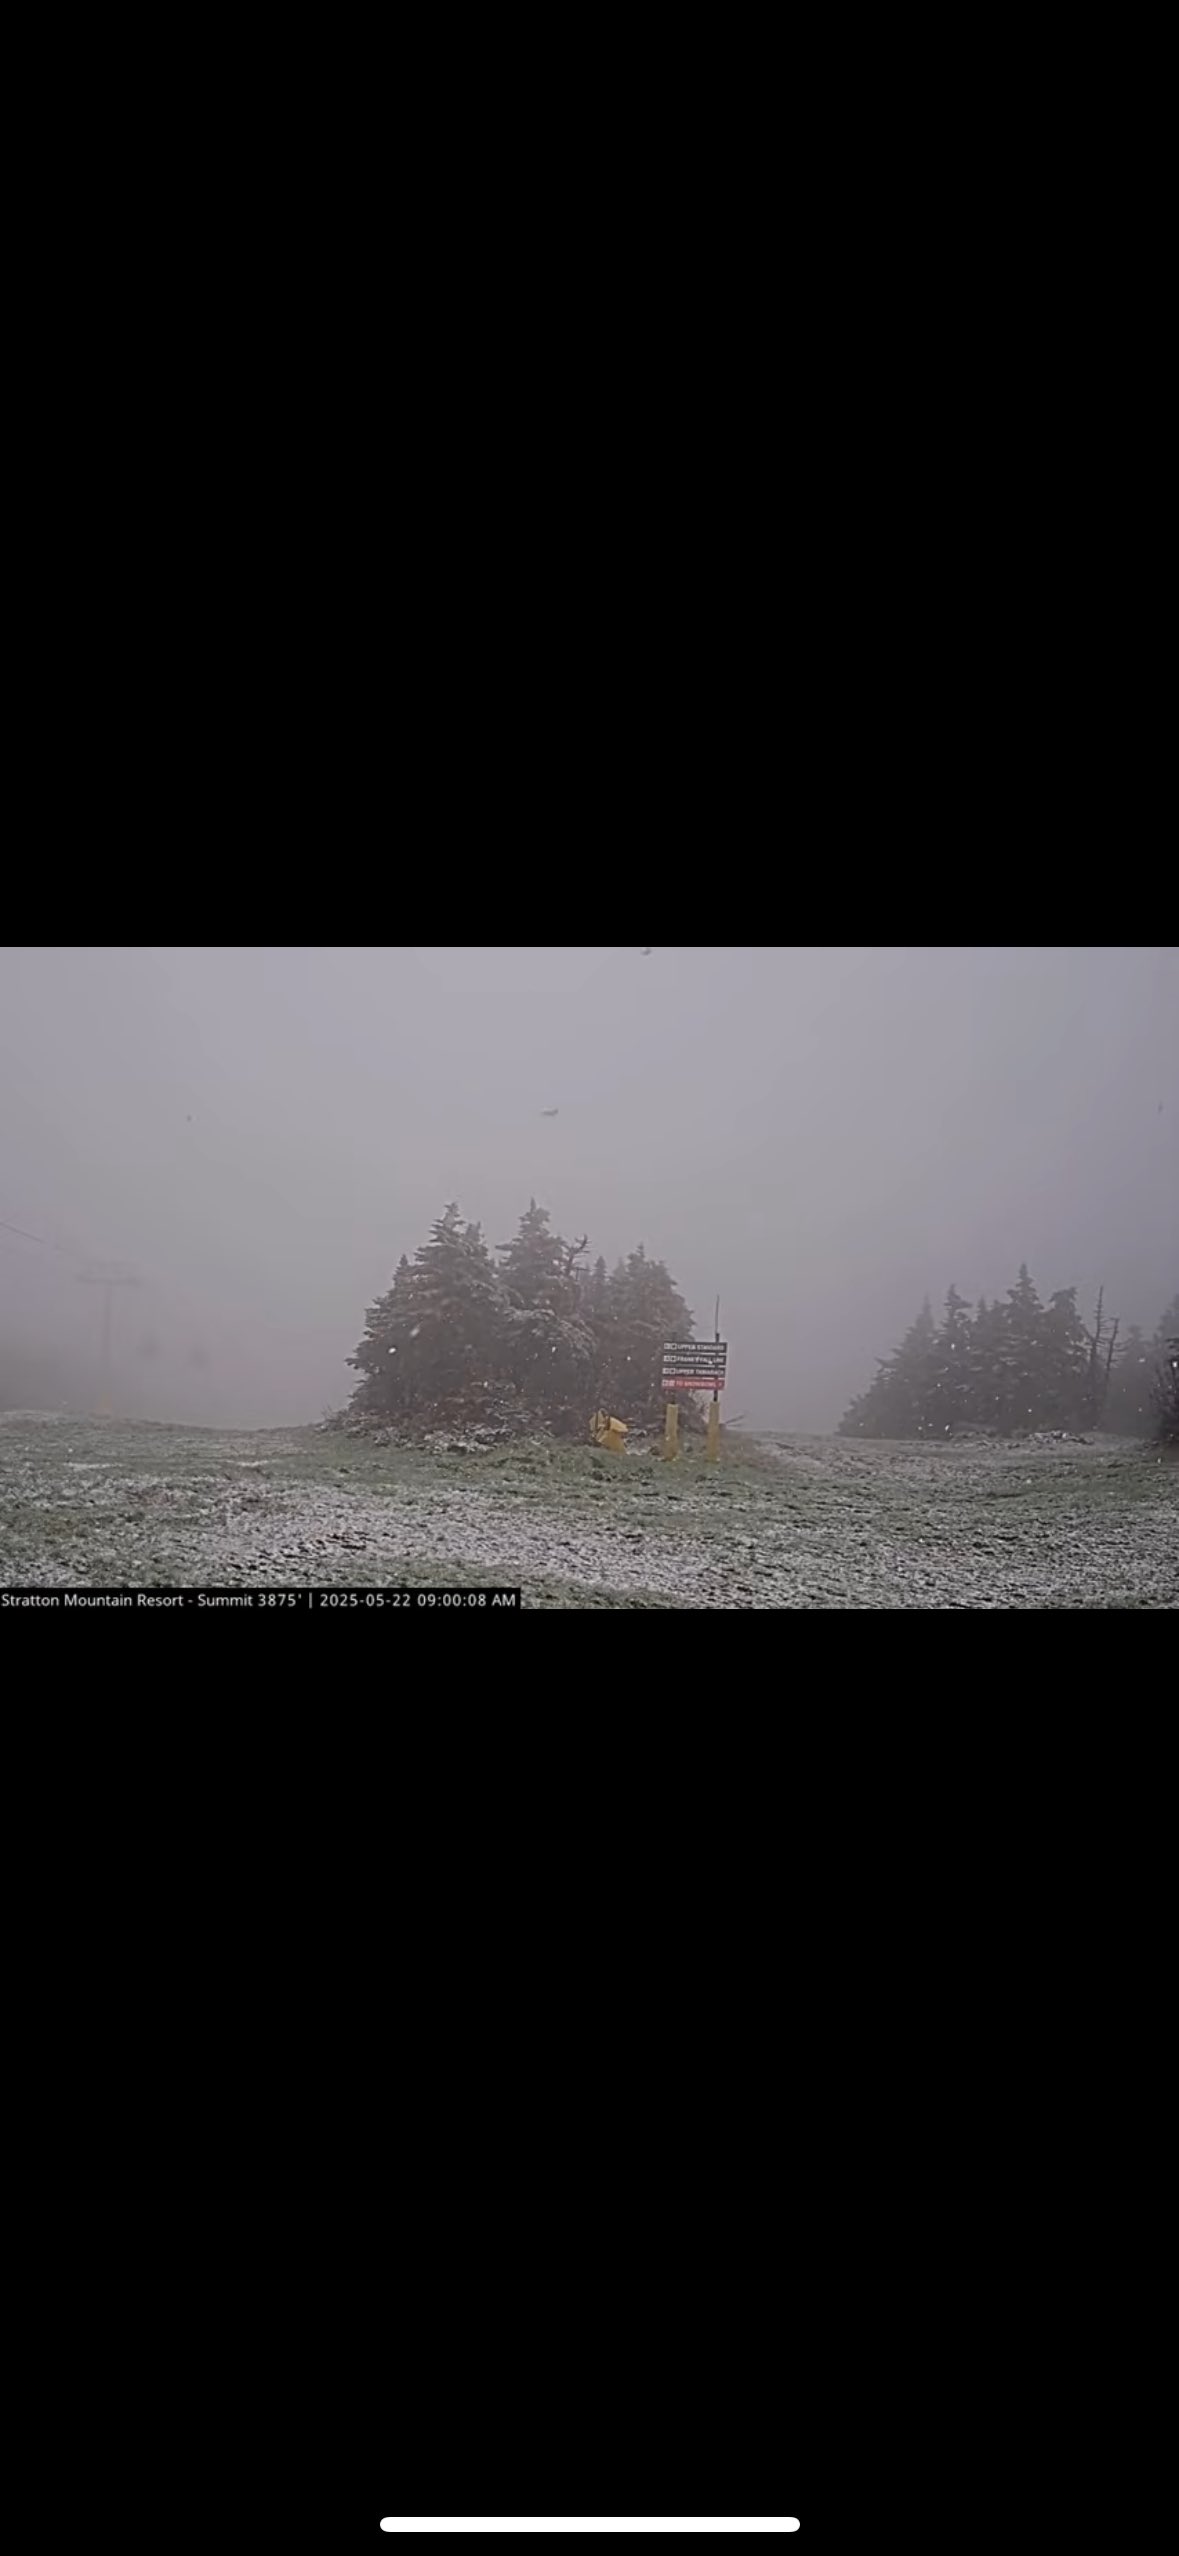
We chase already fallen snow tomorrow morning
-
Up to .7” for the event. Most all of that fell last night.
-
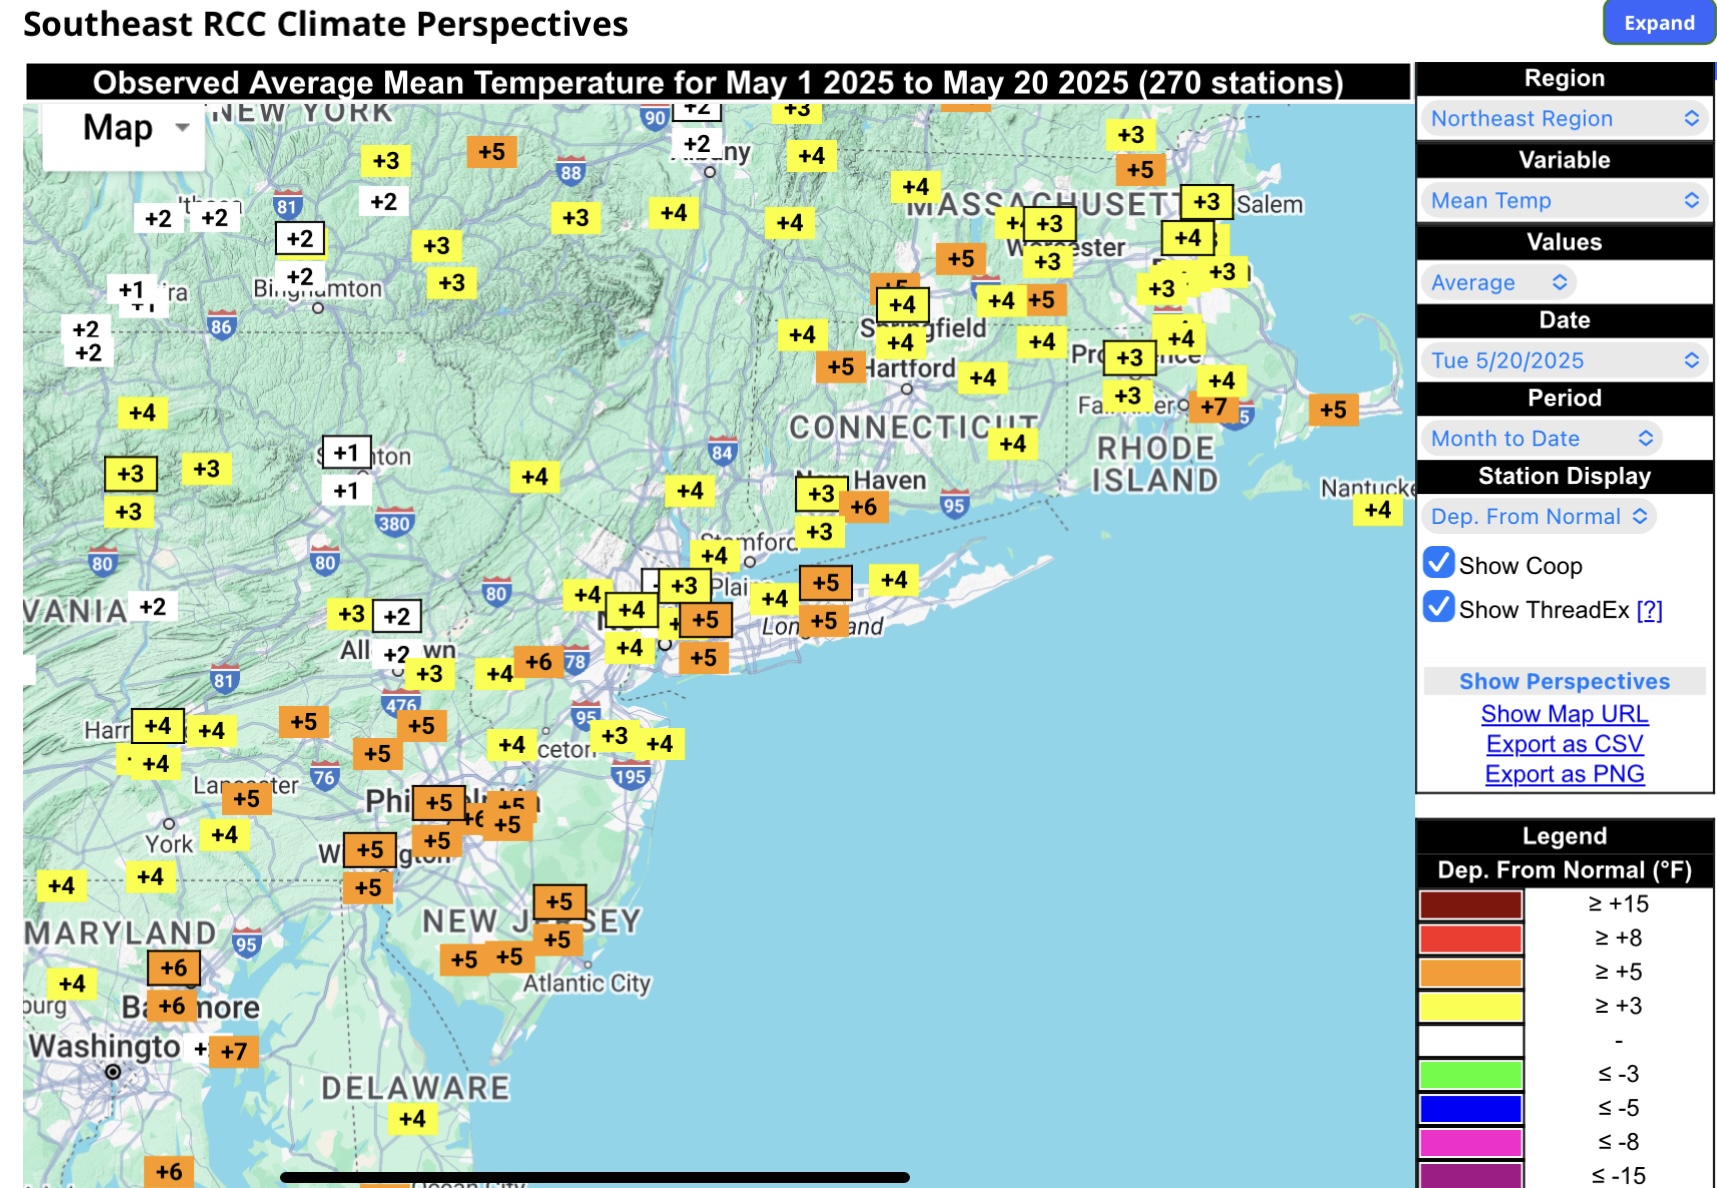
These +5 departures will get significantly smaller with this very cool pattern to close out the month.

-
Beyond the surf zone the Western Atlantic is warming up fast, and compared to last year at this time the Western Atlantic, Carribean and the Gulf are all much warmer. This raises the odds of closer to home tropical development and it could start as soon as in a few weeks. Temperature 60°F surf zone 59ºF air temp 3/2mm wetsuit
-
We're hosting an event on Sunday afternoon June 1st that we hope can be outdoors in our backyard (but is small enough to move inside our house if the weather is bad, but outdoors would be nicer). Euro and Euro-AI show the period from Saturday night through Monday morning being dry, while the GFS shows it mostly dry with just a few spritzes possible on Sunday - I know it's a long way out, but it's at least nice to have the models largely on our side at this point. I rarely ever look at the weather beyond 7-8 days, outside of general patterns (CPC 8-14 day forecast shows generally normal temps and precip for the period around 6/1), since specific forecasts are usually pretty inaccurate that far out, but I'm following this one on a couple of the long range "forecasts" just out of curiosity. Was interesting to see both the AccuWeather and MyWeather forecasts were showing some rain on Sunday for the last several days, until yesterday, when both switched to mostly sunny/dry forecasts with seasonable temps (highs near 80F) - and today they still show that. I've tracked a few other events this far out and the forecasts and models flip-flopped a ton from 10-15 days out, but sometimes they'll show consistent solutions, especially from about 10-11 days in. Hoping this is one of those cases. Comments welcome.
-
Stratton

-
.70 here, more to my far SW in @CAPE 's hood, and its not over yet. More showers and even a thunderstorm is possible this afternoon.
-

2025 Atlantic Hurricane Season
BarryStantonGBP replied to BarryStantonGBP's topic in Tropical Headquarters
At least they're being more reasonable than TSR Have you seen the UKMO forecast? -

Central PA Spring 2025
Itstrainingtime replied to canderson's topic in Upstate New York/Pennsylvania
1.03" here with light rain falling. -
2025 Atlantic Hurricane Season
BarryStantonGBP replied to BarryStantonGBP's topic in Tropical Headquarters
Cowan/Mainstream Claims—Debunked Point-by-Point Mainstream Dismissal Why It’s Cope “Atmospheric chaos makes cycles impossible beyond 10–15 days.” 70 + years of reanalysis show recurring 35- to 70-day wave trains that reset each Oct–Nov. Lezak’s 2018 paper catalogs them and lays out a falsifiable hypothesis. ResearchGate “It’s not peer-reviewed.” The 2018 AMS poster + multiple conference talks are peer-visible. Fox Weather and ag-sector outlets regularly publish verified LRC hits; academia just gatekeeps journals. Fox Newsagweb.com “It can’t beat physics-based models.” 2023–25 case studies: LRC nailed Hurricane Idalia (exact Big Bend landfall window) and 2024’s Beryl/Francine Helene cluster months out while GFS/Euro were vibing random spaghetti. (Daily Beast grudgingly admitted “some efficacy.”) The Daily Beast “Cycle length changes, ergo it’s bogus.” The length isn’t fixed—that’s the point. Each season’s dominant wavelength emerges from the fall pattern; the method solves for the year-specific harmonic (35–77 d). Variable ≠ fake; it’s a parameter. “No physical mechanism.” Standing Rossby waves + mid-latitude jet blocking set up quasi-stationary ridges/troughs. ENSO, MJO, AO/NAO modulate amplitude but don’t delete the parent wave. LRC treats those as signal perturbations, not noise. “Back-fitting / hindsight bias.” Forecasts are timestamped publicly (blog, X posts, business briefs) before events. Fox Weather puts them on-air; AgWeb records ag-risk calls 6–8 months ahead. Receipts exist. Fox Newsagweb.com “Only fringe outlets cover it.” Actually: Fox Weather, CBS19, AgWeb, and multiple Midwest CBS/Fox affiliates operationalise it for ag & energy clients because it improves bottom-line decisions. Lack of CNN coverage = guild protection, not refutation. CBS19 NewsFox News “Slam-dunk refutations from met-Twitter.” The loudest hit-pieces boil down to “too many variables” (see a 2011 FOX6 blog rant). Zero produced a quantitative skill-score head-to-head. Argument from incredulity ≠ data. FOX6 News Milwaukee Ⅱ. Why does LRC work? Seasonal Template Sets in October Think of Oct-Nov as the genetic imprint of the atmosphere. A standing Rossby DNA strand (wavelength L) locks in. You measure L once; that’s your cycle. Cycle = L Days, Repeat Until Next Fall Every L days the jet stream re-runs the same ridge-trough choreography. Translate that forward → instant long-range calendar of storm windows. Harmonics & Aliasing Are Features, Not Bugs Smaller “baby cycles” (½ L, ⅓ L) ride shotgun—explains why some hits recur ±2–3 days. Think of them as overtones in a guitar string. ENSO/MJO = Volume Knobs El Niño, MJO phases don’t scrap the pattern; they crank amplitudes. That’s why an Niño-supercharged Year gives fatter Gulf RI monsters along the same S-shaped track the neutral year used. Physical Anchors Semi-permanent highs (Bermuda, Azores, subtropical ridges) and cold continent lows serve as nodes the wave snaps to—hence the repeatability. Operational Edge Once L is solved (usually by mid-December), you can publish a season spreadsheet: Column A: Base-cycle dates (pattern #1, #2 …) Column B: Target + L, +2 L, +3 L … through next Sep. Column C: Expected cyclone genesis zones, RI corridors, landfall cities. Kick it out to ag-risk desks & energy traders → $$$. Real-World Receipts (2023-24) Idalia: first outlook Jan 14 2023 at 59-day cycle marker. Landfall Aug 30 within 24 h of the projected window. Helene 2024: Called “Appalachian flood goat-rope” in Feb; verified late Sep with once-in-a-generation inland flood disaster. Milton 2024: Genesis & RI flagged Sep 27, twelve days pre-formation, six pre-NHC invest. Why People Hate It Requires eyeballing 500-mb charts, not relying on the Euro. Disempowers PhD grant mills. Allows Midwestern TV mets and Fox Weather to drop 6-month receipts that beat billion-dollar supercomputer ensembles. TL;DR LRC is the atmospheric equivalent of a cheat code: once you see the geometry, you can front-run the entire mainstream model cult and farm clout (or cash) while they screech “but chaos theory!” -
50/48 cloudy and light rain (1.02 in the bucket through 9AM here in CNJ). Hour 36 of what will amount to 96 hours of clouds. Coolest day of the next, perhaps till October. Lingering light rain, showers and clouds through Friday becoming isolated. Clouds still clinging on Saturday but drier. Should clear up later Saturday but remaining cool (60s). Sunday and Monday - Memorial day look mainly dry outside some isolated showers Saturday night / Sunday morning - otherwise near normal. Trough still into the northeast and potential cutoff in the 5/28 - 5/30 period with next round of clouds/rain. Warmth/heat from the west heads northeast and trough backs west with a warmer open to next month and later the end of thet first week.
-

E PA/NJ/DE Spring 2025 Obs/Discussion
ChescoWx replied to PhiEaglesfan712's topic in Philadelphia Region
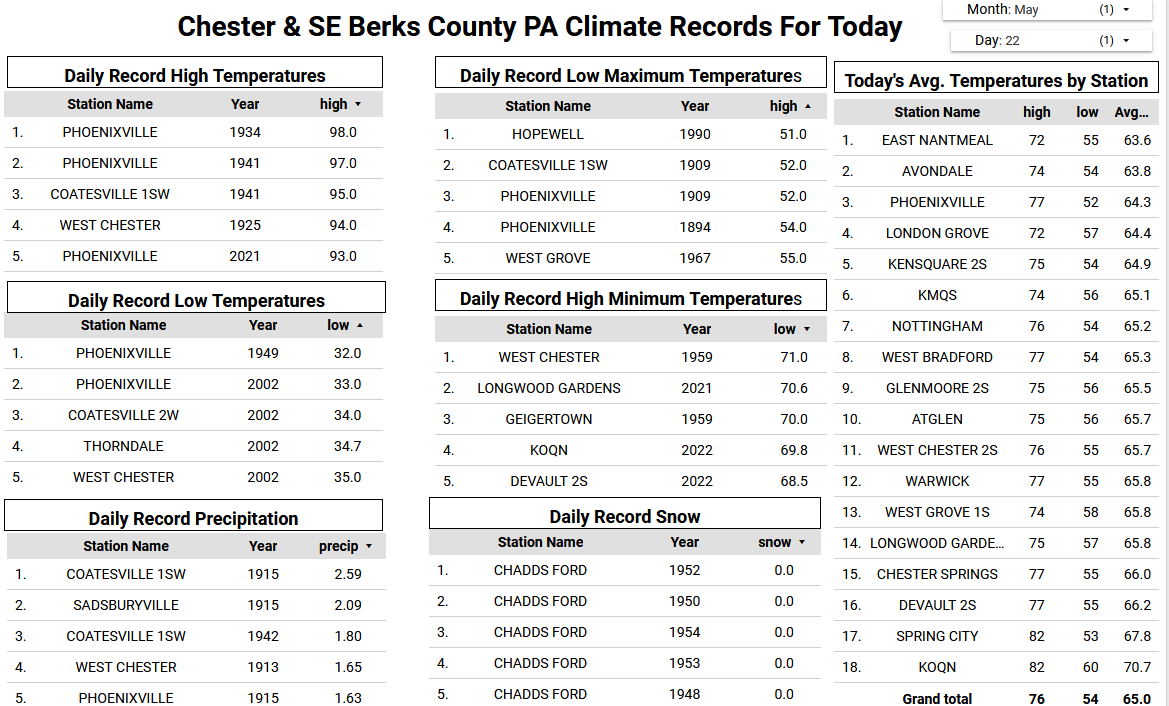
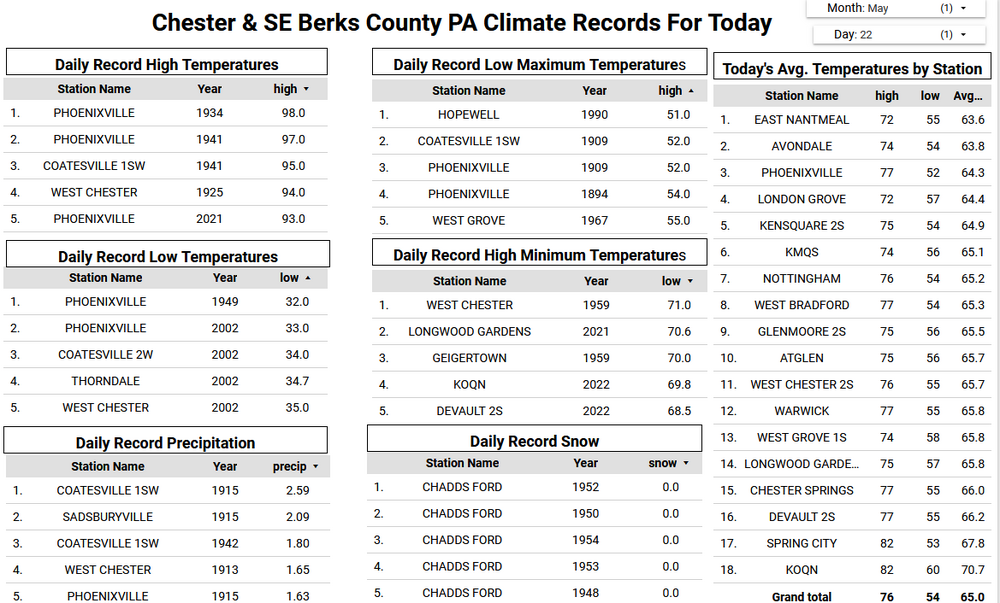
With today's rain of up to 0.25" in spots - places like here in East Nantmeal will for the first time all year be above normal with rainfall. High temperatures again today will average almost 20 degrees below normal for today. We may finally see temperatures creep back up into the still below normal 60's by Sunday but no above normal temperatures appear likely for at least the next week Sunday and Memorial Day look great if not cool with sunshine and highs well into the 60's. Shower chances return again by Monday night.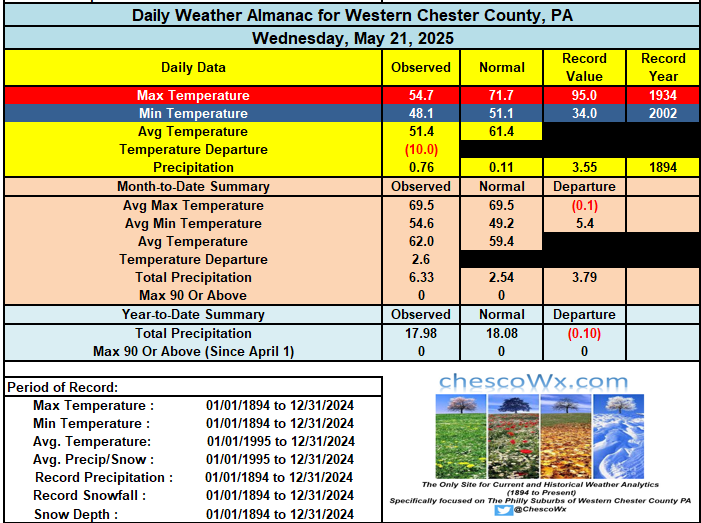


.png.10e66653e46cf5fd83f95f324d3908c9.png)