All Activity
- Past hour
-
Temperatures are now moderating. Most of this week will see highs in the lower 60s. A strong storm will stay too offshore to bring rain to the region this week. Some elevated high tides are possible. The ENSO Region 1+2 anomaly was +5.2°C and the Region 3.4 anomaly was +3.3°C for the week centered around October 7. For the past six weeks, the ENSO Region 1+2 anomaly has averaged +4.98°C and the ENSO Region 3.4 anomaly has averaged +3.12°C. ENSO Region 3.4 ties the all-time record set in the prior week. The ongoing strong El Niño, will continue to strengthen through the mid-fall. The SOI was -30.17 today. The preliminary Arctic Oscillation (AO) was +2.902 today. Based on sensitivity analysis applied to the latest guidance, there is an implied near 69% probability that New York City will have a warmer than normal October (1991-2020 normal). October will likely finish with a mean temperature near 58.7° (0.8° above normal). Supplemental Information: The projected mean would be 1.8° above the 1981-2010 normal monthly value.
-
I come from the future... [code] STATION: LYNCHBURG VA MONTH: JANUARY YEAR: 2027 LATITUDE: 37 19 N LONGITUDE: 79 12 W TEMPERATURE IN F: :PCPN: SNOW: WIND :SUNSHINE: SKY :PK WND ================================================================================ 1 2 3 4 5 6A 6B 7 8 9 10 11 12 13 14 15 16 17 18 12Z AVG MX 2MIN DY MAX MIN AVG DEP HDD CDD WTR SNW DPTH SPD SPD DIR MIN PSBL S-S WX SPD DR ================================================================================ 1 73 44 59 22 6 0 0.00 0.0 0 6.0 15 300 M M 1 1 25 310 2 62 32 47 10 18 0 0.01 0.0 0 6.9 13 50 M M 7 18 50 3 53 22 38 1 27 0 0.15 0.1 0 2.5 10 40 M M 10 1 13 40 4 40 17 29 -8 36 0 0.00 0.0 0 4.0 10 200 M M 3 12 15 210 5 39 32 36 0 29 0 0.92 1.0 0 5.7 17 190 M M 10 12 25 190 6 43 29 36 0 29 0 0.10 0.0 1 4.5 15 40 M M 8 20 40 7 44 21 33 -3 32 0 0.00 0.0 0 8.7 26 200 M M 6 39 200 8 52 39 46 10 19 0 2.04 0.0 0 4.6 13 270 M M 10 1 22 280 9 46 23 35 -1 30 0 0.10 0.0 0 3.1 15 260 M M 8 12 23 280 10 43 23 33 -3 32 0 0.00 0.0 0 4.9 15 190 M M 1 22 190 11 57 26 42 6 23 0 0.00 0.0 0 8.6 23 190 M M 1 32 210 12 63 39 51 15 14 0 0.01 0.0 0 5.0 16 10 M M 5 12 30 20 13 68 44 56 21 9 0 0.00 0.0 0 11.3 30 200 M M 0 43 200 14 57 42 50 15 15 0 0.00 0.0 0 3.9 12 310 M M 0 20 310 15 56 40 48 13 17 0 0.07 0.0 0 6.9 14 40 M M 7 1 20 40 16 46 32 39 4 26 0 1.16 0.0 0 13.6 30 220 M M 10 1 48 220 17 41 23 32 -3 33 0 0.00 0.0 0 7.4 16 260 M M 3 28 270 18 44 25 35 0 30 0 0.00 0.0 0 4.8 14 190 M M 2 19 200 19 40 28 34 -1 31 0 0.00 0.0 0 2.3 9 220 M M 3 14 350 20 34 21 28 -8 37 0 T T 0 7.5 22 190 M M 6 36 180 21 38 23 31 -5 34 0 0.01 0.0 0 2.5 12 360 M M 6 21 340 22 37 23 30 -6 35 0 0.50 5.5 0 5.5 17 200 M M 10 29 270 23 34 23 29 -7 36 0 0.63 5.1 5 7.0 21 300 M M 10 36 320 24 43 24 34 -2 31 0 0.00 0.0 10 4.6 14 70 M M 0 24 40 25 53 22 38 2 27 0 0.00 0.0 8 4.9 17 190 M M 0 23 140 26 60 24 42 6 23 0 0.00 0.0 3 8.8 18 200 M M 1 28 210 27 69 37 53 17 12 0 0.21 0.0 0 7.4 17 40 M M 9 1 26 30 28 55 34 45 8 20 0 0.00 0.0 0 4.6 14 310 M M 1 30 0 29 42 30 36 -1 29 0 1.20 2.6 0 8.2 22 190 M M 10 32 200 30 34 24 29 -8 36 0 0.66 5.0 2 6.8 16 210 M M 10 22 210 31 32 20 26 -11 39 0 0.01 0.1 6 11.7 23 190 M M 8 30 200 ================================================================================ SM 1498 886 815 0 7.78 19.4 194.2 M 166 ================================================================================ AV 48.3 28.6 6.3 FASTST M M 5 MAX(MPH) MISC ----> # 30 200 48 220 ================================================================================ NOTES: # LAST OF SEVERAL OCCURRENCES COLUMN 17 PEAK WIND IN M.P.H. [/code] [code] PRELIMINARY LOCAL CLIMATOLOGICAL DATA (WS FORM: F-6) , PAGE 2 STATION: LYNCHBURG VA MONTH: JANUARY YEAR: 2027 LATITUDE: 37 19 N LONGITUDE: 79 12 W [TEMPERATURE DATA] [PRECIPITATION DATA] SYMBOLS USED IN COLUMN 16 AVERAGE MONTHLY: 38.7 TOTAL FOR MONTH: 7.78 1 = FOG OR MIST DPTR FM NORMAL: 2.7 DPTR FM NORMAL: +4.28 2 = FOG REDUCING VISIBILITY HIGHEST: 73 ON 1 GRTST 24HR 2.14 ON 8-9 TO 1/4 MILE OR LESS LOWEST: 17 ON 4 3 = THUNDER SNOW, ICE PELLETS, HAIL 4 = ICE PELLETS TOTAL MONTH: 19.4 INCH 5 = HAIL GRTST 24HR 10.6 ON 22-23 6 = FREEZING RAIN OR DRIZZLE GRTST DEPTH: 10 7 = DUSTSTORM OR SANDSTORM: VSBY 1/2 MILE OR LESS 8 = SMOKE OR HAZE [NO. OF DAYS WITH] [WEATHER - DAYS WITH] 9 = BLOWING SNOW X = TORNADO MAX 32 OR BELOW: 1 0.01 INCH OR MORE: 16 MAX 90 OR ABOVE: 0 0.10 INCH OR MORE: 11 MIN 32 OR BELOW: 23 0.50 INCH OR MORE: 7 MIN 0 OR BELOW: 0 1.00 INCH OR MORE: 3 [/code] [code] STATION: LYNCHBURG VA MONTH: FEBRUARY YEAR: 2027 LATITUDE: 37 19 N LONGITUDE: 79 12 W TEMPERATURE IN F: :PCPN: SNOW: WIND :SUNSHINE: SKY :PK WND ================================================================================ 1 2 3 4 5 6A 6B 7 8 9 10 11 12 13 14 15 16 17 18 12Z AVG MX 2MIN DY MAX MIN AVG DEP HDD CDD WTR SNW DPTH SPD SPD DIR MIN PSBL S-S WX SPD DR ================================================================================ 1 33 24 29 -8 36 0 0.00 0.0 0 6.0 15 300 M M 1 1 25 310 2 42 32 37 0 28 0 0.08 0.1 0 6.9 13 50 M M 7 18 50 3 43 22 33 -4 32 0 0.00 0.0 0 2.5 10 40 M M 10 1 13 40 4 50 27 39 2 26 0 0.00 0.0 0 4.0 10 200 M M 3 12 15 210 5 56 21 39 1 26 0 0.10 0.0 0 5.7 17 190 M M 7 12 25 190 6 43 28 36 -2 29 0 0.00 0.0 0 4.5 15 40 M M 2 20 40 7 30 21 26 -12 39 0 1.10 11.0 0 8.7 26 200 M M 10 39 200 8 32 19 26 -12 39 0 0.94 9.2 11 4.6 13 270 M M 10 1 22 280 9 26 3 15 -23 50 0 0.00 0.0 19 3.1 15 260 M M 2 12 23 280 10 33 13 23 -15 42 0 0.10 2.1 18 4.9 15 190 M M 9 22 190 11 37 16 27 -11 38 0 0.00 0.0 19 8.6 23 190 M M 1 32 210 12 43 24 34 -5 31 0 0.03 0.3 17 5.0 16 10 M M 6 12 30 20 13 58 34 46 7 19 0 0.00 0.0 14 11.3 30 200 M M 0 43 200 14 56 32 44 5 21 0 0.00 0.0 6 3.9 12 310 M M 0 20 310 15 66 50 58 19 7 0 0.57 0.0 1 6.9 14 40 M M 9 1 20 40 16 56 48 52 13 13 0 2.16 0.0 0 13.6 30 220 M M 10 3 48 220 17 51 29 40 1 25 0 1.20 0.0 0 7.4 16 260 M M 10 28 270 18 44 25 35 -5 30 0 0.00 0.0 0 4.8 14 190 M M 2 19 200 19 50 28 39 -1 26 0 0.00 0.0 0 2.3 9 220 M M 3 14 350 20 44 31 38 -2 27 0 1.32 T 0 7.5 22 190 M M 10 36 180 21 48 33 41 1 24 0 0.01 0.0 0 2.5 12 360 M M 6 21 340 22 57 33 45 5 20 0 0.00 0.0 0 5.5 17 200 M M 0 29 270 23 64 43 54 14 11 0 0.03 0.0 0 7.0 21 300 M M 6 36 320 24 53 34 44 4 21 0 0.50 0.0 0 4.6 14 70 M M 9 24 40 25 43 30 37 -4 28 0 0.00 0.0 0 4.9 17 190 M M 0 23 140 26 50 29 40 -1 25 0 0.10 0.3 0 8.8 18 200 M M 8 28 210 27 39 27 33 -8 32 0 0.31 4.0 0 7.4 17 40 M M 10 1 26 30 28 55 34 45 4 20 0 0.00 0.0 3 4.6 14 310 M M 1 30 0 ================================================================================ SM 1302 790 765 0 8.55 27.0 167.5 M 152 ================================================================================ AV 46.5 28.2 6.0 FASTST M M 5 MAX(MPH) MISC ----> # 30 220 48 220 ================================================================================ NOTES: # LAST OF SEVERAL OCCURRENCES COLUMN 17 PEAK WIND IN M.P.H. [/code] [code] PRELIMINARY LOCAL CLIMATOLOGICAL DATA (WS FORM: F-6) , PAGE 2 STATION: LYNCHBURG VA MONTH: FEBRUARY YEAR: 2027 LATITUDE: 37 19 N LONGITUDE: 79 12 W [TEMPERATURE DATA] [PRECIPITATION DATA] SYMBOLS USED IN COLUMN 16 AVERAGE MONTHLY: 37.7 TOTAL FOR MONTH: 8.55 1 = FOG OR MIST DPTR FM NORMAL: -1.3 DPTR FM NORMAL: +5.65 2 = FOG REDUCING VISIBILITY HIGHEST: 66 ON 15 GRTST 24HR 3.36 ON 16-17 TO 1/4 MILE OR LESS LOWEST: 3 ON 9 3 = THUNDER SNOW, ICE PELLETS, HAIL 4 = ICE PELLETS TOTAL MONTH: 27.0 INCH 5 = HAIL GRTST 24HR 20.2 ON 7-8 6 = FREEZING RAIN OR DRIZZLE GRTST DEPTH: 19 7 = DUSTSTORM OR SANDSTORM: VSBY 1/2 MILE OR LESS 8 = SMOKE OR HAZE [NO. OF DAYS WITH] [WEATHER - DAYS WITH] 9 = BLOWING SNOW X = TORNADO MAX 32 OR BELOW: 3 0.01 INCH OR MORE: 15 MAX 90 OR ABOVE: 0 0.10 INCH OR MORE: 11 MIN 32 OR BELOW: 20 0.50 INCH OR MORE: 7 MIN 0 OR BELOW: 0 1.00 INCH OR MORE: 4 [HDD (BASE 65) ] TOTAL THIS MO. 765 CLEAR (SCALE 0-3) 12 DPTR FM NORMAL +37 PTCLDY (SCALE 4-7) 5 TOTAL FM JUL 1 2708 CLOUDY (SCALE 8-10) 11 DPTR FM NORMAL -539 [CDD (BASE 65) ] TOTAL THIS MO. 0 DPTR FM NORMAL 0 [PRESSURE DATA] TOTAL FM JAN 1 0 HIGHEST SLP 30.61 ON 9 DPTR FM NORMAL 0 LOWEST SLP 29.24 ON 16 [/code] [code] CXUS51 KRNK 011132 CF6LYH PRELIMINARY LOCAL CLIMATOLOGICAL DATA (WS FORM: F-6) STATION: LYNCHBURG VA MONTH: MARCH YEAR: 2027 LATITUDE: 37 19 N LONGITUDE: 79 12 W TEMPERATURE IN F: :PCPN: SNOW: WIND :SUNSHINE: SKY :PK WND ================================================================================ 1 2 3 4 5 6A 6B 7 8 9 10 11 12 13 14 15 16 17 18 12Z AVG MX 2MIN DY MAX MIN AVG DEP HDD CDD WTR SNW DPTH SPD SPD DIR MIN PSBL S-S WX SPD DR ================================================================================ 1 54 34 44 2 21 0 0.00 0.0 0 6.0 15 300 M M 1 1 25 310 2 36 32 34 -8 31 0 0.88 4.3 0 12.4 25 40 M M 10 33 40 3 33 22 28 -14 37 0 2.10 19.0 4 18.7 38 30 M M 10 9 46 30 4 30 17 24 -18 41 0 0.20 2.0 21 15.2 31 320 M M 10 9 40 320 5 41 12 27 -16 38 0 0.00 0.0 22 8.3 20 320 M M 1 28 320 6 50 24 37 -6 28 0 0.00 0.0 18 7.1 17 310 M M 2 24 300 7 58 33 46 3 19 0 0.00 0.0 13 5.4 13 220 M M 3 18 210 8 68 44 56 12 9 0 0.32 0.0 8 9.8 24 190 M M 8 12 32 190 9 73 54 64 20 1 0 1.45 0.0 3 13.4 30 190 M M 10 12 41 190 10 78 60 69 25 0 4 2.30 0.0 0 15.1 34 200 M M 10 3 49 200 11 84 64 74 29 0 9 0.85 0.0 0 17.3 39 210 M M 9 35 61 220 12 73 50 62 17 3 0 0.40 0.0 0 14.6 36 280 M M 8 3 46 290 13 54 36 45 0 20 0 0.00 0.0 0 12.0 30 310 M M 3 39 310 14 57 33 45 0 20 0 0.00 0.0 0 7.9 18 320 M M 1 25 320 15 61 37 49 3 16 0 0.00 0.0 0 6.2 15 220 M M 2 21 230 16 65 42 54 8 11 0 0.12 0.0 0 8.1 19 200 M M 7 26 210 17 52 38 45 -1 20 0 0.47 0.0 0 9.3 22 40 M M 10 1 29 40 18 48 31 40 -7 25 0 0.00 0.0 0 10.7 26 320 M M 3 34 320 19 55 29 42 -5 23 0 0.00 0.0 0 6.5 16 290 M M 1 22 290 20 62 34 48 1 17 0 0.00 0.0 0 5.8 14 230 M M 2 19 240 21 68 41 55 7 10 0 0.00 0.0 0 7.7 20 210 M M 3 26 210 22 71 48 60 12 5 0 0.05 0.0 0 9.0 23 200 M M 6 31 200 23 63 45 54 6 11 0 0.62 0.0 0 10.2 25 270 M M 9 1 33 280 24 56 37 47 -1 18 0 0.00 0.0 0 8.8 21 310 M M 2 28 310 25 59 34 47 -2 18 0 0.00 0.0 0 6.4 15 320 M M 1 20 320 26 55 32 44 -5 21 0 0.00 0.0 0 7.2 18 40 M M 6 24 40 27 37 31 34 -15 31 0 0.22 2.0 0 9.8 22 40 M M 10 29 40 28 35 30 33 -17 32 0 0.13 1.4 2 11.4 26 10 M M 10 33 10 29 49 27 38 -12 27 0 0.00 0.0 3 9.6 22 330 M M 4 29 330 30 58 33 46 -4 19 0 0.00 0.0 0 6.8 16 250 M M 2 22 250 31 66 40 53 2 12 0 0.00 0.0 0 5.9 14 210 M M 1 19 210 ================================================================================ SM 1749 1124 584 13 10.11 28.7 302.6 M 165 ================================================================================ AV 56.4 36.3 9.8 FASTST M M 5 MAX(MPH) MISC ----> 39 210 61 220 ================================================================================ NOTES: COLUMN 17 PEAK WIND IN M.P.H. [/code] [code] PRELIMINARY LOCAL CLIMATOLOGICAL DATA (WS FORM: F-6) , PAGE 2 STATION: LYNCHBURG VA MONTH: MARCH YEAR: 2027 LATITUDE: 37 19 N LONGITUDE: 79 12 W [TEMPERATURE DATA] [PRECIPITATION DATA] SYMBOLS USED IN COLUMN 16 AVERAGE MONTHLY: 46.6 TOTAL FOR MONTH: 10.11 1 = FOG OR MIST DPTR FM NORMAL: +0.5 DPTR FM NORMAL: +6.31 2 = FOG REDUCING VISIBILITY HIGHEST: 84 ON 11 GRTST 24HR 3.75 ON 9-10 TO 1/4 MILE OR LESS LOWEST: 12 ON 5 3 = THUNDER SNOW, ICE PELLETS, HAIL 4 = ICE PELLETS TOTAL MONTH: 28.7 INCH 5 = HAIL GRTST 24HR 23.3 ON 2-3 6 = FREEZING RAIN OR DRIZZLE GRTST DEPTH: 22 7 = DUSTSTORM OR SANDSTORM: VSBY 1/2 MILE OR LESS 8 = SMOKE OR HAZE [NO. OF DAYS WITH] [WEATHER - DAYS WITH] 9 = BLOWING SNOW X = TORNADO MAX 32 OR BELOW: 1 0.01 INCH OR MORE: 14 MAX 90 OR ABOVE: 0 0.10 INCH OR MORE: 13 MIN 32 OR BELOW: 11 0.50 INCH OR MORE: 6 MIN 0 OR BELOW: 0 1.00 INCH OR MORE: 3 [HDD (BASE 65) ] TOTAL THIS MO. 584 CLEAR (SCALE 0-3) 15 DPTR FM NORMAL -3 PTCLDY (SCALE 4-7) 4 TOTAL FM JUL 1 3292 CLOUDY (SCALE 8-10) 12 DPTR FM NORMAL -542 [CDD (BASE 65) ] TOTAL THIS MO. 13 DPTR FM NORMAL +13 [PRESSURE DATA] TOTAL FM JAN 1 13 HIGHEST SLP 30.68 ON 5 DPTR FM NORMAL +13 LOWEST SLP 28.97 ON 3 [/code]
-
u are some pro forecaster man
-
Kinda looks like 50/50. Eyeballing it, but I don't see skill here. I would put money they are right this year, however given the screaming signal.
-
Low 52, high 68. Perfect weather except for the wind.
-
-
-
Looks like you were on the wrong side of the stationary front all month.
-
I noticed last week it’s spectacular from Greenfield to your area and then starts to tail off in brightness once you got beyond Fitchburg.
-
I thought the foliage season around the Pioneer Valley has been better than average this year.
-
I come from the future. STATION: LYNCHBURG VA MONTH: DECEMBER YEAR: 2026 LATITUDE: 37 19 N LONGITUDE: 79 12 W TEMPERATURE IN F: :PCPN: SNOW: WIND :SUNSHINE: SKY :PK WND ================================================================================ 1 2 3 4 5 6A 6B 7 8 9 10 11 12 13 14 15 16 17 18 12Z AVG MX 2MIN DY MAX MIN AVG DEP HDD CDD WTR SNW DPTH SPD SPD DIR MIN PSBL S-S WX SPD DR ================================================================================ 1 73 45 59 17 6 0 0.00 0.0 0 6.0 15 300 M M 1 1 25 310 2 52 42 47 5 18 0 1.18 0.0 0 6.9 13 50 M M 10 18 50 3 49 37 43 1 22 0 0.95 0.0 0 2.5 10 40 M M 10 1 13 40 4 60 37 49 7 16 0 0.00 0.0 0 4.0 10 200 M M 3 12 15 210 5 69 42 56 15 9 0 0.00 0.0 0 5.7 17 190 M M 1 12 25 190 6 73 49 61 20 4 0 0.00 0.0 0 4.5 15 40 M M 2 20 40 7 70 51 61 20 4 0 0.00 0.0 0 8.7 26 200 M M 6 39 200 8 62 49 56 15 9 0 0.64 0.0 0 4.6 13 270 M M 9 1 22 280 9 66 43 55 14 10 0 0.00 0.0 0 3.1 15 260 M M 2 12 23 280 10 73 53 63 23 2 0 0.00 0.0 0 4.9 15 190 M M 1 22 190 11 77 56 67 27 0 2 0.00 0.0 0 8.6 23 190 M M 1 32 210 12 63 39 51 11 14 0 1.48 0.0 0 5.0 16 10 M M 10 12 30 20 13 58 34 46 6 19 0 0.00 0.0 0 11.3 30 200 M M 0 43 200 14 67 32 50 10 15 0 0.00 0.0 0 3.9 12 310 M M 0 20 310 15 76 50 63 24 2 0 0.07 0.0 0 6.9 14 40 M M 7 1 20 40 16 66 42 54 15 11 0 2.16 0.0 0 13.6 30 220 M M 10 3 48 220 17 51 33 42 3 23 0 0.00 0.0 0 7.4 16 260 M M 3 28 270 18 64 45 55 16 10 0 0.20 0.0 0 4.8 14 190 M M 8 19 200 19 70 48 59 20 6 0 0.00 0.0 0 2.3 9 220 M M 3 14 350 20 74 51 63 25 2 0 T 0.0 0 7.5 22 190 M M 6 36 180 21 68 53 61 23 4 0 0.01 0.0 0 2.5 12 360 M M 6 21 340 22 77 44 61 23 4 0 0.00 0.0 0 5.5 17 200 M M 0 29 270 23 74 43 59 21 6 0 0.03 0.0 0 7.0 21 300 M M 6 36 320 24 63 44 54 16 11 0 0.00 0.0 0 4.6 14 70 M M 0 24 40 25 73 43 58 21 7 0 0.00 0.0 0 4.9 17 190 M M 0 23 140 26 80 54 67 30 0 2 0.10 0.0 0 8.8 18 200 M M 7 3 28 210 27 69 47 58 21 7 0 2.31 0.0 0 7.4 17 40 M M 10 13 26 30 28 55 34 45 8 20 0 0.00 0.0 0 4.6 14 310 M M 1 30 0 29 42 37 40 3 25 0 0.62 0.0 0 8.2 22 190 M M 10 32 200 30 61 44 53 17 12 0 0.16 0.0 0 6.8 16 210 M M 8 22 210 31 62 50 56 20 9 0 3.70 0.0 0 11.7 23 190 M M 10 3 30 200 ================================================================================ SM 2037 1371 307 4 13.61 0.0 194.2 M 86 ================================================================================ AV 65.7 44.2 6.3 FASTST M M 5 MAX(MPH) MISC ----> # 30 200 48 220 ================================================================================ NOTES: # LAST OF SEVERAL OCCURRENCES COLUMN 17 PEAK WIND IN M.P.H. PRELIMINARY LOCAL CLIMATOLOGICAL DATA (WS FORM: F-6) , PAGE 2 STATION: LYNCHBURG VA MONTH: DECEMBER YEAR: 2026 LATITUDE: 37 19 N LONGITUDE: 79 12 W [TEMPERATURE DATA] [PRECIPITATION DATA] SYMBOLS USED IN COLUMN 16 AVERAGE MONTHLY: 55.2 TOTAL FOR MONTH: 13.61 1 = FOG OR MIST DPTR FM NORMAL: 16.0 DPTR FM NORMAL: +10.11 2 = FOG REDUCING VISIBILITY 3 = THUNDER
-
2026-2027 Record-breaking El Nino
EasternLI replied to Stormchaserchuck1's topic in Weather Forecasting and Discussion
Judah Cohen or no Judah Cohen. If el nino wishes to terminate the wave train by rebuilding these Ural Blocks like this, the PV will keep taking future shots... Looks entirely possible if not probable and it's been a mainstay feature on ensembles too. What does that ultimately mean for this year? Up for debate. Just noticing, but it's not meaningless. -
He might be looking at the Cfs2 for that December comment. It's been coming in for the past week AN, but not by a whole lot. Idk. We'd have to get pretty lucky for December to deliver anything of consequence. Otoh, the exception is 12/82 when BWI was +3.4 and still had a little over 7" thanks to a 1/2" event and a Sunday night surprise of almost 7".
- Yesterday
-
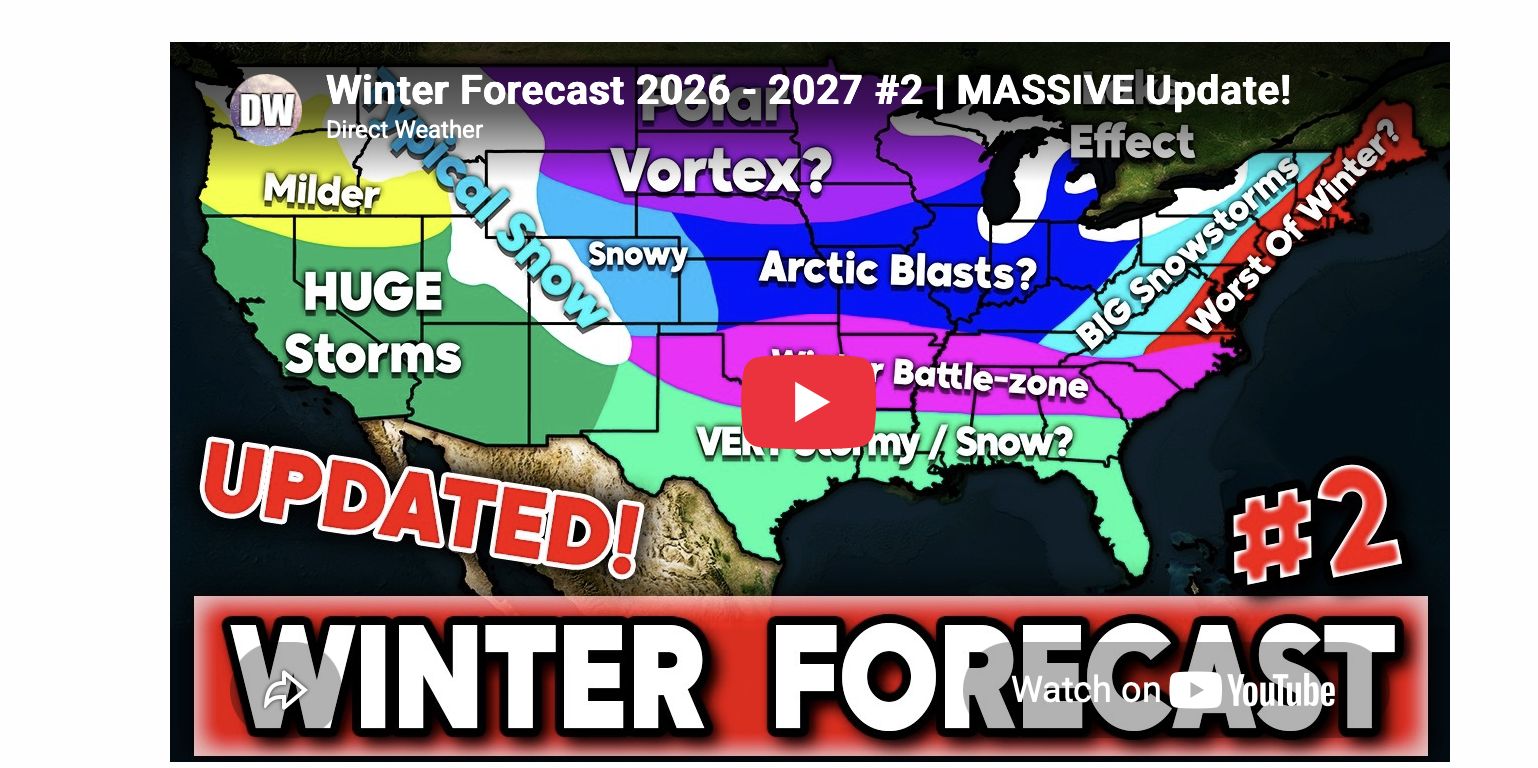
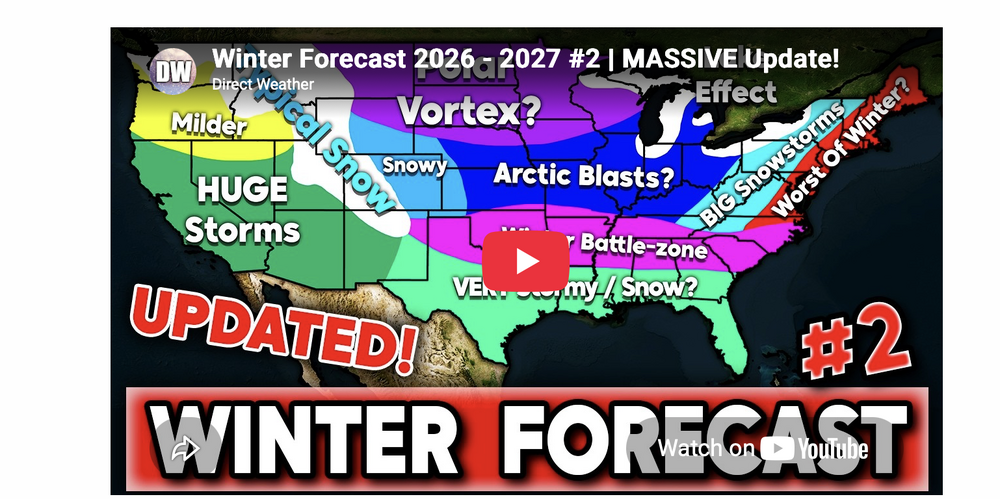
I don’t even pay attention to their winter outlooks. They just put climo Nina or Nino up and use that. They shouldn’t even waste their time if they do no other research. Like we saw the last couple winters there are plenty of other factors that can override ENSO.
-

E PA/NJ/DE Autumn 2026 Obs/Discussion
Hurricane Agnes replied to PhiEaglesfan712's topic in Philadelphia Region
Bottomed out at 38 this morning and had a high of 65. Definitely fall weather! Currently 50 with dp 46. -
Yeah pretty mid foliage overall. Better than last year, but nothing jaw dropping
-
-
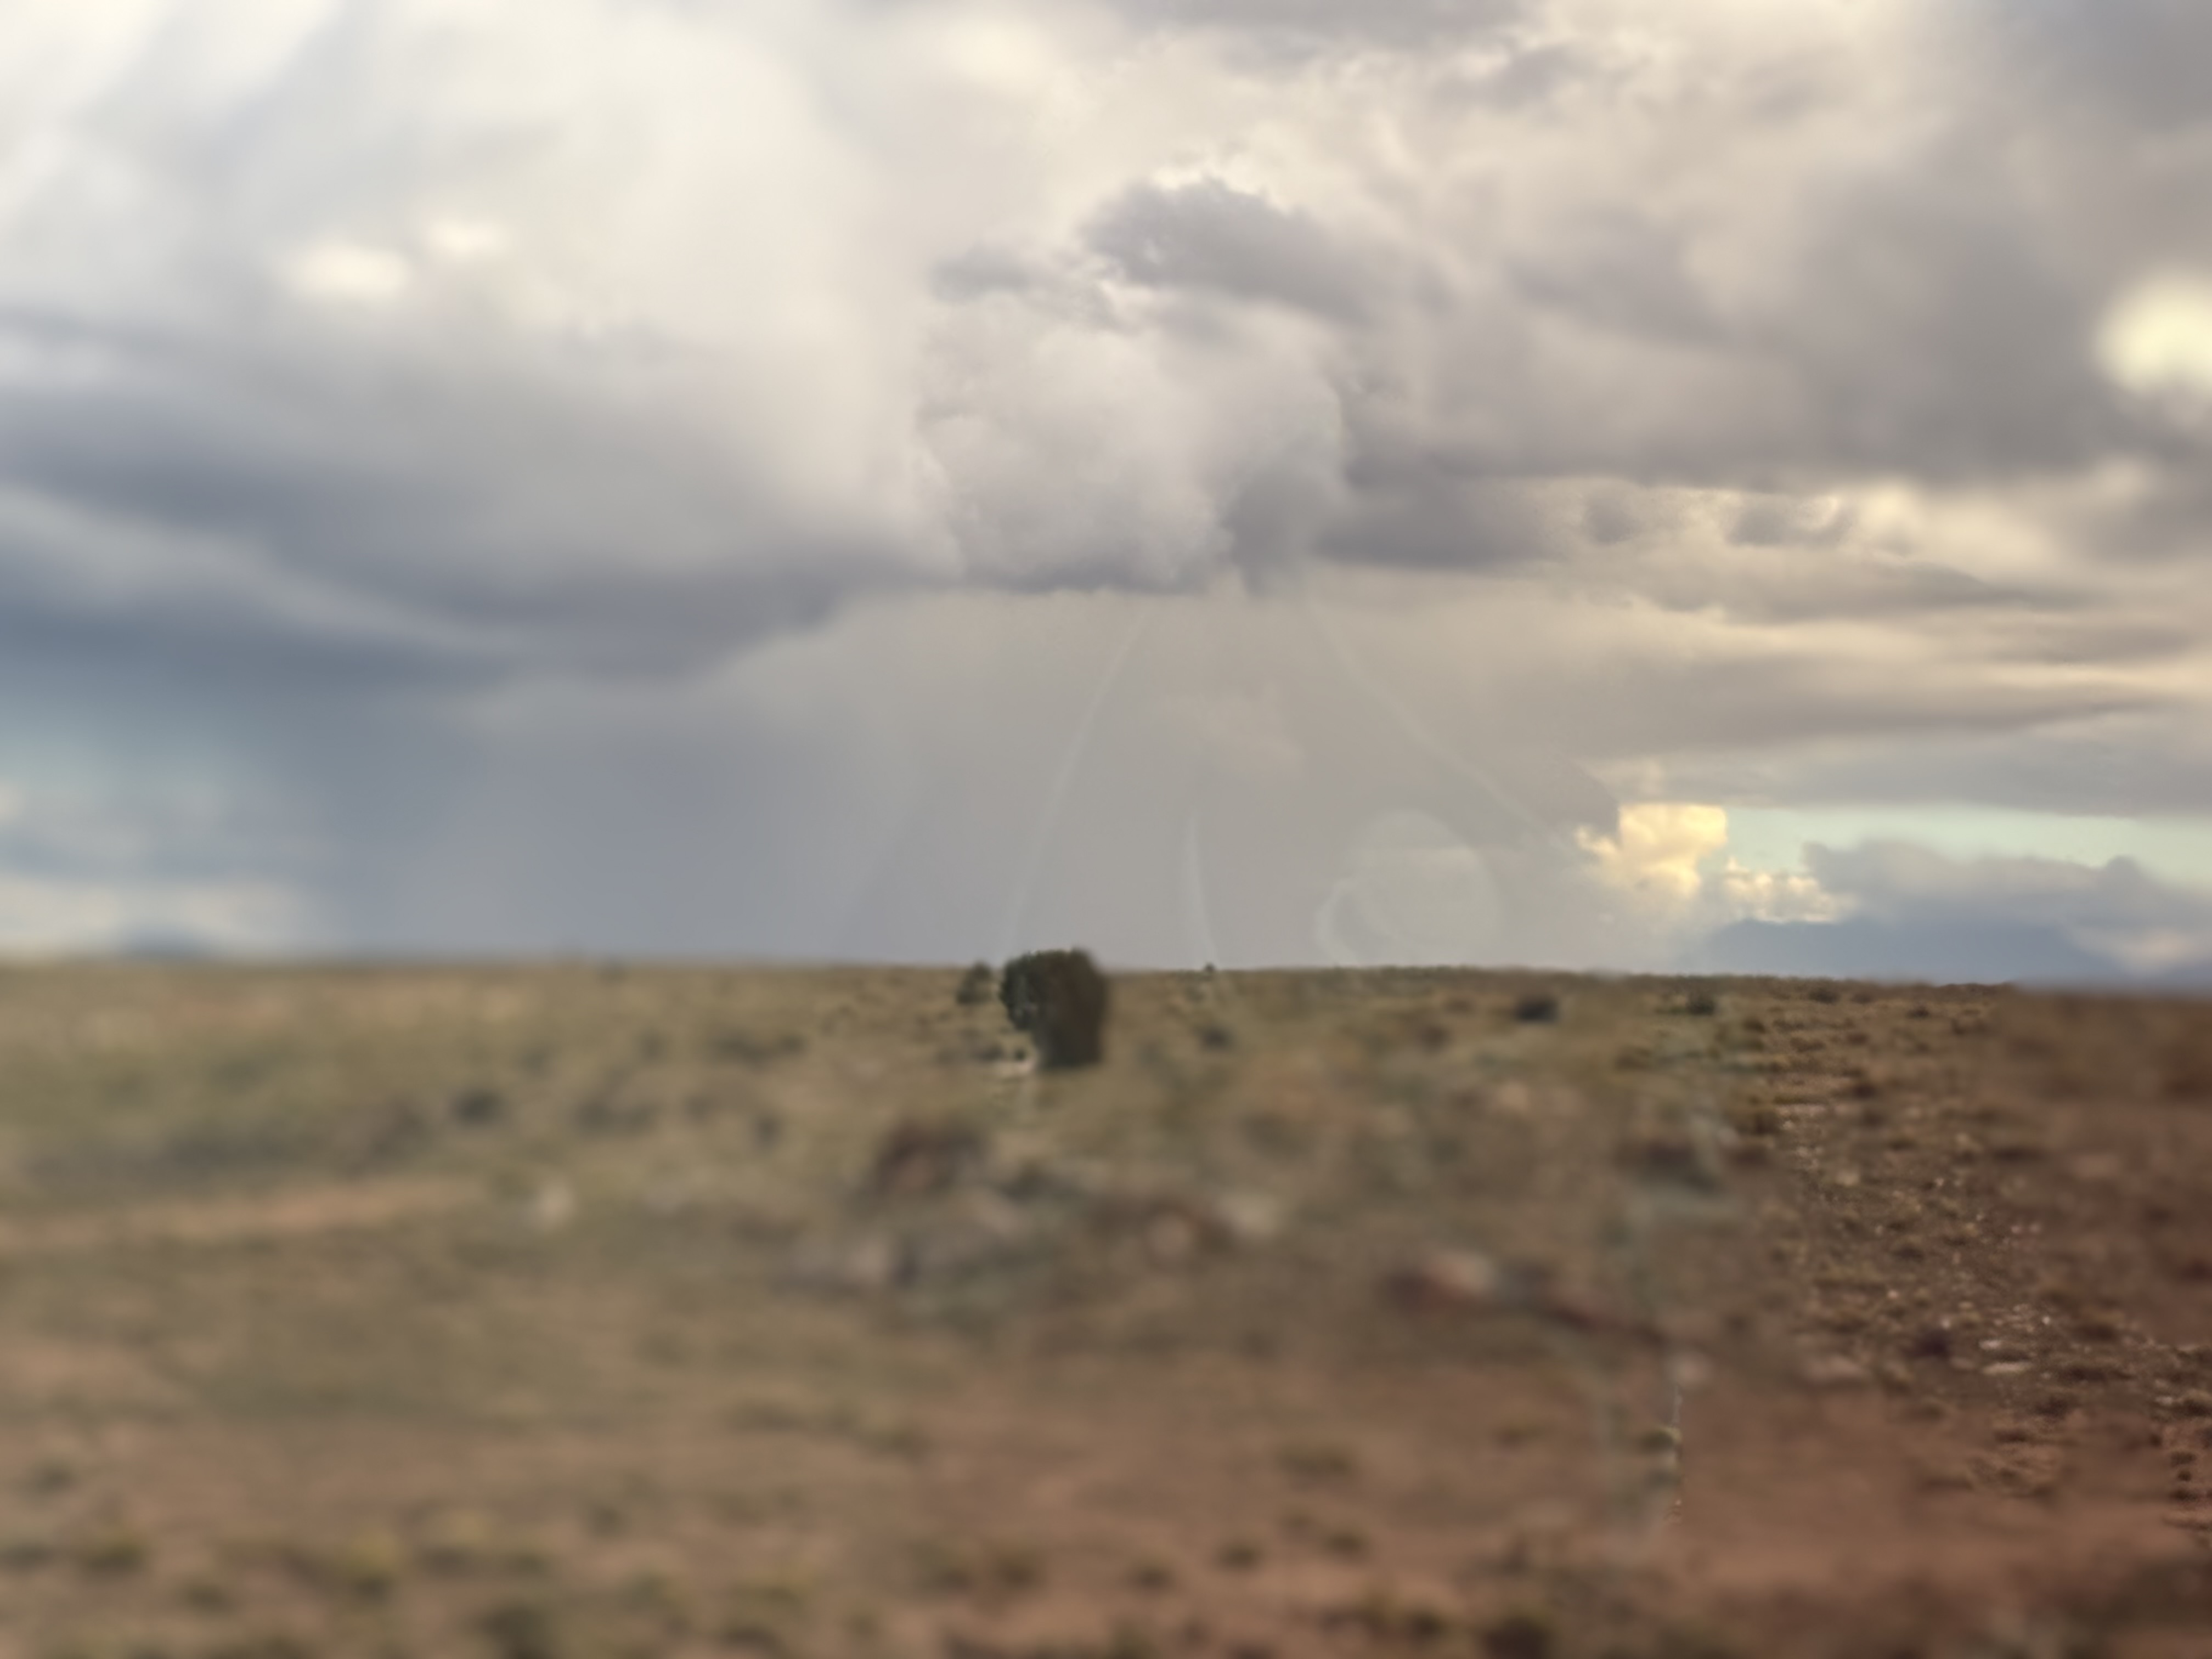
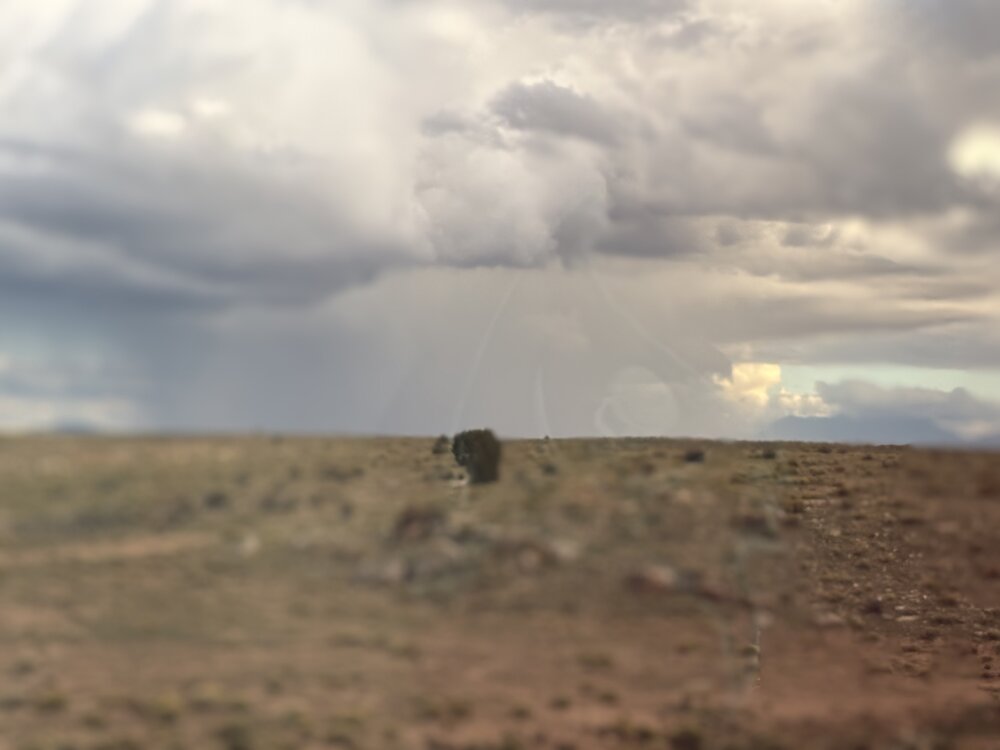
Sedona is where we are based. And I’m headed back to Williams on that same train now (the Maria something) Enjoying watching a thunderstorm way off in the distance. Love it. And can’t agree more regarding the climate zones.
-
JB used to be good at forecasting like 10+ years ago. He’s pretty much a hypecaster and says nonsense nowadays.
-
small rain/snow shower looks amazing with the sunlight
-
Noaa Predictions VS. Actual Results
-
You mean consensus on that OPINION. JB is a hypster and not necessarily associated with disseminating facts.
-
It was very good 2 weeks ago on some species agreed. But it went to hell in a hand basket in CT over the last week or so other than patches here and there
-
You always make it out better than it is and that’s ok . There hasn’t been spectacular color this season and the posters here backing that. Enjoy the blinding colors there I guess and wear appropriate eye protection
-
Interesting. Around here it has actually been stunning. Best in a long time. Fading now but it has been incredible