All Activity
- Past hour
-
February 2018 begs to differ I agree no 80s in January though
-
DCA officially hit 90
-
I wouldn't be too surprised if LWX calls DCA/IAD/BWI as 89/89/87 as the highs of the day appear to have just missed 90/90/88. Still daily records, though.
-
Will there be a second wind to this torch or will it be more of a muted warmup after the cold snap?
-
It’s not like we have a perfect kicker…oh.
-
We are so back
-
The 12Z UKMET, Euro, Euro AIFS, and Icon all have a storm of some sort have a storm off the E coast next week. I’m noting this because there’s a strong correlation between very strong El Niños and having one significant to historic U.S. E coast storm in Oct as ALL 9 of the other very strong El Niño Octobers had one: -1877: Hatteras had 1002 mb on 10/27 along with significant rainfall and strong NE winds caused by gradient between a sub 1000 mb low offshore and a 1022 mb high over Quebec. Norfolk got 2.71” of rain. The low was TS #7 then to the S moving OTS: -1888: TS #7 went up the coast 10/11-12: -1957: a strong nor’easter (995 mb) went up the coast 10/5-6 giving Hatteras 4.62” of rain: https://library.oarcloud.noaa.gov/docs.lib/htdocs/rescue/dwm/1957/19571006.pdf -1965: TS # 9 formed 10/16 NW Bahamas and hit NE FL 10/19 producing 8.3” on rain at CHS: -1972: very strong nor’easter went up coast NC-NE 10/5-8 with strong winds and heavy rains (>4” NYC, nearly 4” Hatteras): https://library.oarcloud.noaa.gov/docs.lib/htdocs/rescue/dwm/1972/19721002-19721008.pdf -1982: strong winds/heavy rain (3.64” of rain Hatteras) from nor’easter 10/23-26 due to strong gradient between 1004 mb low Hatteras and 1030 mb high NE US. I experienced this in DC and still clearly recall the unusual combo of continuous rain, wind, and cold: https://library.oarcloud.noaa.gov/docs.lib/htdocs/rescue/dwm/1982/19821018-19821024.pdf https://library.oarcloud.noaa.gov/docs.lib/htdocs/rescue/dwm/1982/19821025-19821031.pdf -1991: “Perfect Storm” 10/30-11/1 H #8 (Boston 2.69” of rain): 1997: nor’easter 10/18-20 (Hatteras 1.4” of rain): https://library.oarcloud.noaa.gov/docs.lib/htdocs/rescue/dwm/1997/19971013-19971019.pdf https://library.oarcloud.noaa.gov/docs.lib/htdocs/rescue/dwm/1997/19971020-19971026.pdf 2015: strong front pushed by 1045 mb SE Canadian high gets hung up along E coast with ~stationary upper low SE US and MH Joaquin ~stationary Bahamas interacting in a way few have ever seen resulting in >17”/historic flooding CHS Oct 1-4: https://www.wpc.ncep.noaa.gov/dailywxmap/dwm_stnplot_20151002.html —————— So, all 9 very strong El Niño had one impactful to historic US E coast storm in Oct! Are the 12Z UKMET, Euro, Euro-AIFS, and Icon sniffing out something real for 2026’s turn? Based on the history noted above, I wouldn’t at this point discount at least the possibility of something notable happening near the E coast next week.
-

2026-2027 Record-breaking El Nino
LakePaste25 replied to Stormchaserchuck1's topic in Weather Forecasting and Discussion
It definitely is more influential than the PDO. The PDO is a cumulative reflection of the base ENSO state over the years, it is an extratropical oceanic index that has little to no effect on the long wave pattern. -
Well to be fair…we have nonsense talk for mid October already. So I kind of get where he’s coming from. It’s starting earlier and earlier.
-
Its not hitting 80 during the winter..70 yea but 80? I dont care how strong el nino is.
-

October 2026 OBS
WinstonSalemArlington replied to WinstonSalemArlington's topic in Southeastern States
-
Excited to set the latest 80 on record on Xmas day!
-
Mid-Long Range Discussion 2026
WinstonSalemArlington replied to BooneWX's topic in Southeastern States
Save the NAM! -
The disturbance on the models that develop down south in the long range might have a chance.
-
thanks captain obvious
-
latest 90 on record.
- Today
-
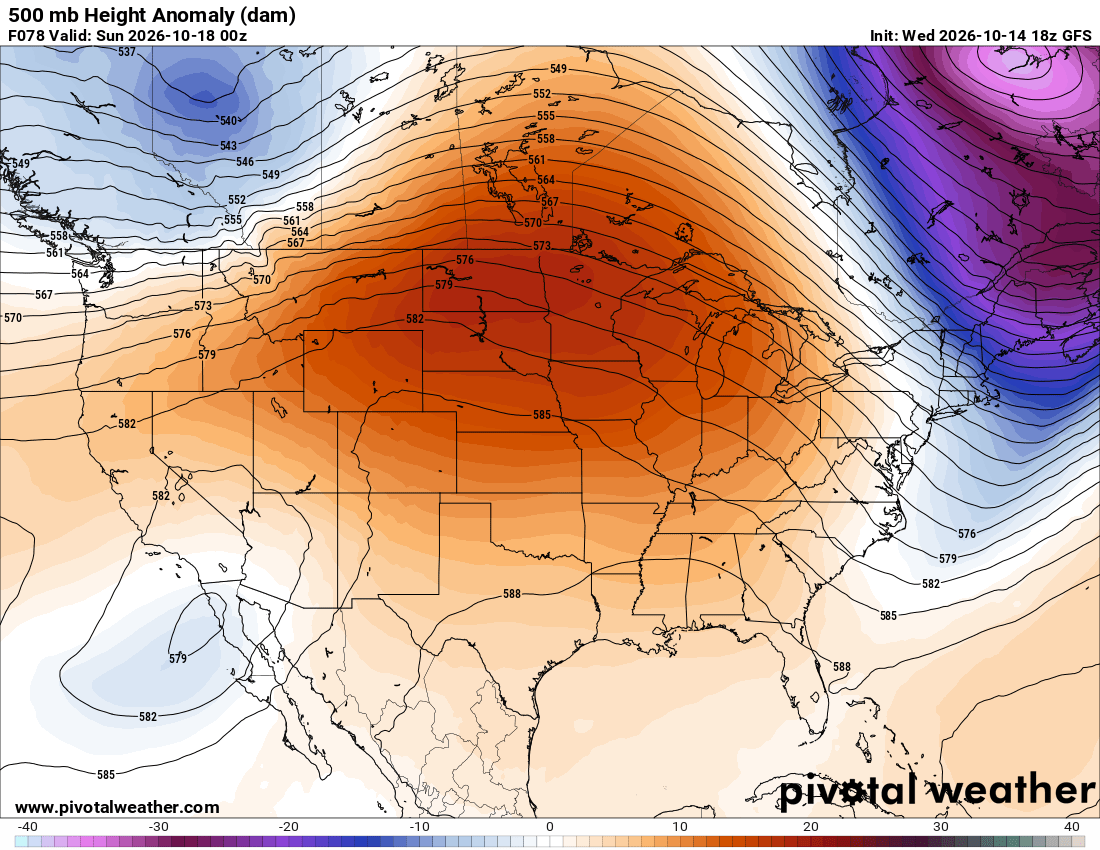
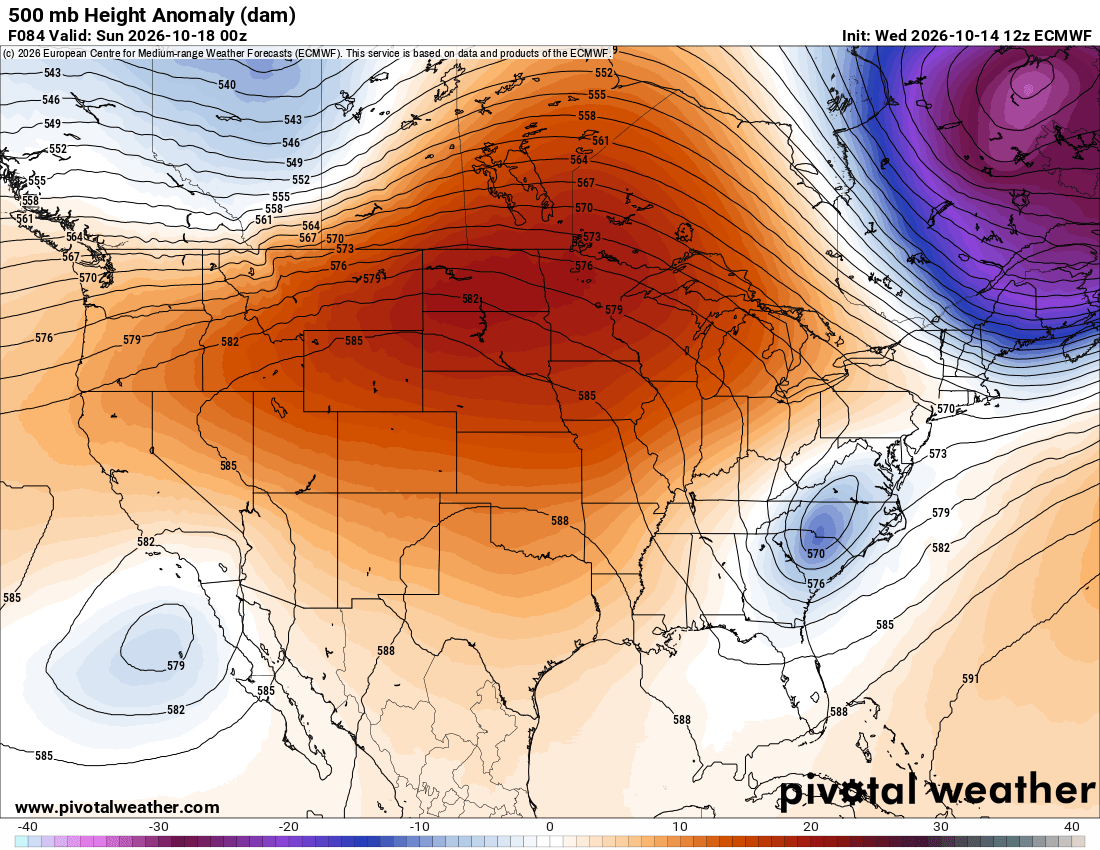
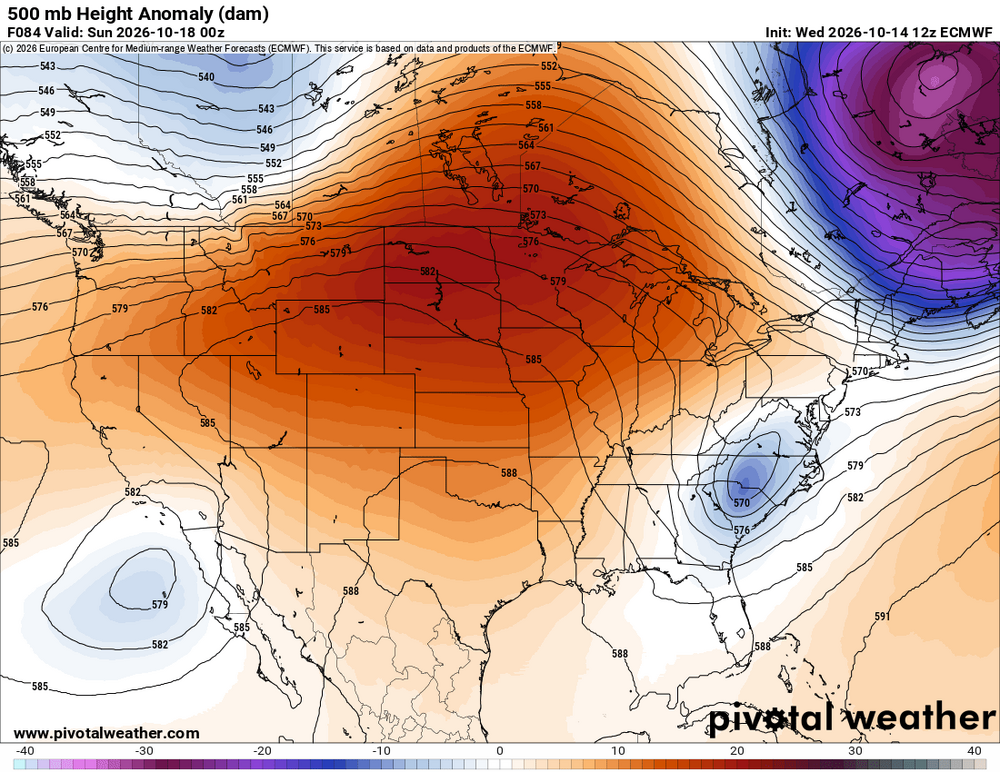
Oh yeah, crazy differences for ~4 days out. Bodes well for winter tracking!
-
Some people here need to consider moving to the deep south...
-
Hit 90 down in DC today
-
 Negative PDO is the opposite of what they have. It's not a cooler north pacific. Where they have a Low pressure is really a High pressure.
 -
Yeah the cold and freezes literally vanished . Started noticing it Monday . Just a slight BN day now
-
I don't know why you've taken on the stance that everything is normal with the El Nino and H. Hemisphere pattern. It clearly is not. We have not seen more than 4 consecutive N. Pacific low days since the El Nino began in April. Oct-Nov.. -0.38 max Dec.. -0.32 max To say that too much on the correlations and then post QBO correlation is ridiculous! I know the QBO is not anything different from random. It's not a practical surface level indicator perhaps beyond the AO effects.
-

Central PA Autumn 2026
Itstrainingtime replied to canderson's topic in Upstate New York/Pennsylvania
I went to ALCS games in Baltimore on weekday afternoons in 1979 and 1983. I miss afternoon postseason baseball. -
2026 C and E Pacific tropical activity
SnowenOutThere replied to GaWx's topic in Tropical Headquarters
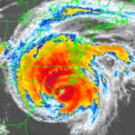
Currently it has one of the weirdest look's I've seen a hurricane take on.