All Activity
- Past hour
-
If Chicago ever fixes housing affordability I'll be back sooner than later
-
Fish says .. Nah
-

2026-2027 Strong/Super El Nino
roardog replied to Stormchaserchuck1's topic in Weather Forecasting and Discussion
So we have a model temperature forecast for 7 months into the future and it's against an 1880-1920 mean. lol -
sad to lose a local, glad you're staying in the sub
-

2026-2027 Strong/Super El Nino
Stormchaserchuck1 replied to Stormchaserchuck1's topic in Weather Forecasting and Discussion
AO and NAO are usually about 0.85 correlated, but they are running apart this year: AO is -1.0 for 2026 so far, NAO is +4.4. March AO was +2 though. It has basically exactly neutral correlation April to May, and March to May (1948-2020). There is a slight -EPO correlation actually March +AO to May. May is a little cooler temp wise in the CONUS after +AO March, which we have seen at least in the 1st half. -

2026-2027 Strong/Super El Nino
GaWx replied to Stormchaserchuck1's topic in Weather Forecasting and Discussion
Thanks, Chuck. Does it say anything about the May AO, That’s projected right now to be +AO. -
Some news on my front if anyone cares lol. Moving to Milwaukee next month. I'll be bringing my magnet to pull some Winter Storms and warm fronts further north.
-

2026-2027 Strong/Super El Nino
qg_omega replied to Stormchaserchuck1's topic in Weather Forecasting and Discussion
https://x.com/peakaustria/status/2056315272852648378?s=46&t=m4Eqkekadb-JCXTm7k-Txg -
88 here at 12:20. Not a cloud in the sky
-
IAD up to 91F. 91/65. An @87storms trademark day. Patiently awaiting the next @wxdude64 trademark day.
-
Ninja'd was just commenting on the NAM/mlvl lapse rates. The NAM is definitely pretty intriguing. Would actually see a pretty solid line drift south and it occurrs during peak heating
-
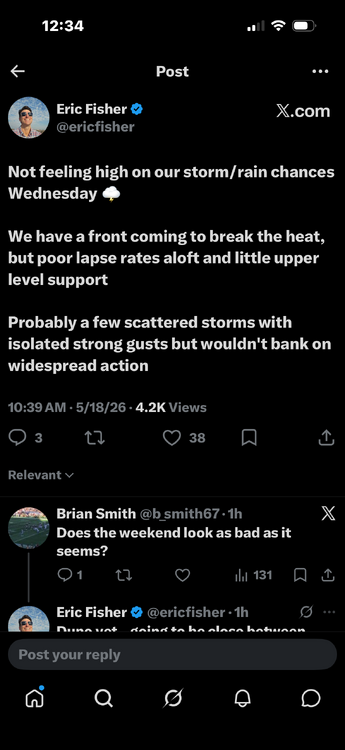
The NAM is actually pretty interesting for Wednesday. Would suggest a threat for scattered damaging wind gusts, particularly south of the Pike. The NAM has a large area of steeper mid-level lapse rates overhead, shunting south during the day (hence south of the Pike favored). Not sure I totally buy this though...the NAM seems to have a tendency for having these areas of steeper lapse rates...but a big player in this is whether the airmass over the OV is convectively overturned tomorrow night into Wednesday morning. Shear is pretty decent along with height falls and looks like we get enough heating to drive up the llvl lapse rates
-
Well 12z GFS shows what I was talking about. A big soaking Saturday into Saturday night to help with the drought, but it gets it out of the way for Sunday and would be fine for Sunday afternoon cookouts. Hopefully it'll work out that way.
-
Wednesday's severe threat looks decent to me. Lapse rates are pretty good (6.5c/km) on the NAM and deep layer effective shear around 40 knots. Should be able to get a decent QLCS with some embedded supercells. I think the GFS is mixing out the boundary layer a bit too much.
-
upper 80s at DCA already, temp steadily climbing on a south wind. Ominous for the upcoming summer.
-
banged p good blessed
-
Would be par for the course if we watch most of this go west of apps and around us but at a minimum it looks like a return to at least scattered afternoon storms across NC most days
-
Storm means business. Really strong winds and momentarily lost power.
-
looks like you're probs getting 70 mph gusts rn
-

2026-2027 Strong/Super El Nino
forkyfork replied to Stormchaserchuck1's topic in Weather Forecasting and Discussion
can we have a separate thread for winter talk? -
2026-2027 Strong/Super El Nino
Stormchaserchuck1 replied to Stormchaserchuck1's topic in Weather Forecasting and Discussion
Nino 1+2 was close to 0.0 in 09-10. It was also the #1 most -NAO Winter on record, going back to the mid-1800s. Kind of interesting that we are batting 0-22 on Winter NAO months > +1.11 starting after just 1 year after that. -
That's my concern. Some models are pushing those heavier totals west with this strong Bermuda High. TN Valley looks inundated for sure but how much makes it east of the Apps?
-

2026-2027 Strong/Super El Nino
PhiEaglesfan712 replied to Stormchaserchuck1's topic in Weather Forecasting and Discussion
09-10 showed that we can get a good winter out of a strong modoki el nino. We just need a good blocking pattern. -

E PA/NJ/DE Spring 2026 Obs/Discussion
JTA66 replied to PhiEaglesfan712's topic in Philadelphia Region
87F at noon with a DP of 70F -
(002).thumb.png.6e3d9d46bca5fe41aab7a74871dd8af8.png)
Central PA Spring 2026 Discussion/Obs Thread
ChescoWx replied to Voyager's topic in Upstate New York/Pennsylvania
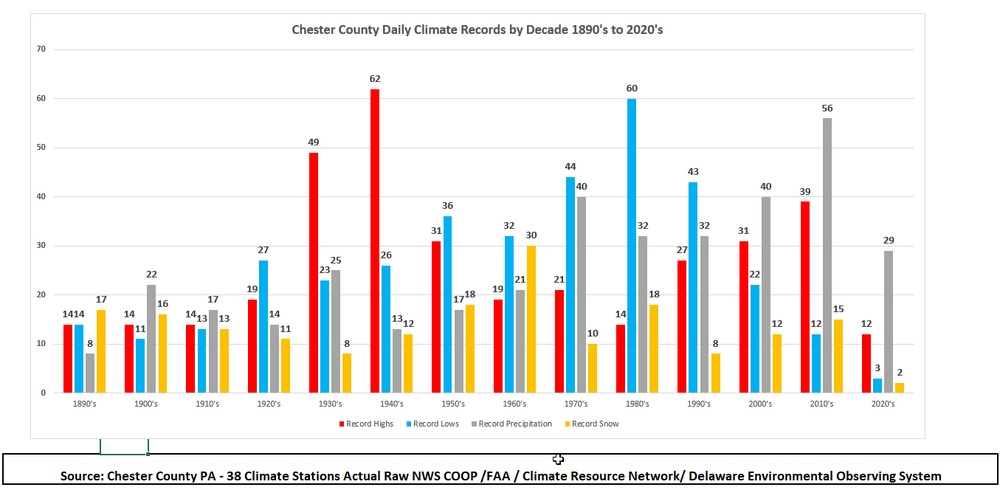
Below is an analysis of when our daily climate records have occurred here in Chester County PA. Temperature, Precipitation and Snow daily records. Of note the decades of the 1930's through the 1950's accounted for 39% of our record high temperature records. The most daily record highs were recorded during the 1940's. The decades of the 1970's through 1990's recorded 40% of all of our daily record low temperatures across the county. With the 1980's recording the most daily record low temperatures. Precipitation wise the 2010's saw the most daily record precipitation records while the 1960's saw the greatest number of daily snow records.