All Activity
- Past hour
-
 I suspect I know what his source/reasoning therefrom is ... or was rather - you never give that information when you repost so we have no idea... But the problem I have with it is that there is a whopper +PNA between the 19th and ~ the 24th... unusually big numerical values for summer. Showing up in the chart layouts ( ens mean of all three majors - ), too SO, assuming that happens.. these longer range heat signal have to survive modeling our way through these nearer term index walls. It makes it less than trust-able what's happening on the other side of those. Having said that... yeah, there's 'bounce back method that's valid. The +PNA is a cool anomaly that isn't really supported well given the background...so if the pattern goes that way, the recoil - for lack of better word - could imagine an equally handsome -PNA expression ... which ^ certainly is
 -
90/69 at the cmu wx station now, maybe signs of dews starting to mix lower? Ticked down over the last half hour, need to see that pick up for a run at 100
-
 *Unintelligible moose noises*
 -
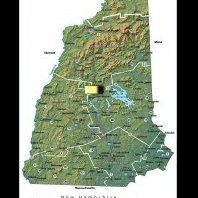 As of 11:45 here in Central NH we have a very thick smoke layer above us. The whole landscape is yellowish and the sun disc is sharp but so dim you can look at it directly. A very eerie situation. It is only 74.7F. I have no idea how this will impact the severe threat later but it is the densest smoke layer above us that I have ever seen. Meanwhile at near ground level I can see mountain ridges 30 miles distant.
 -
 In 2023 in NJ it was like the apocalypse arrived
 -
 Wow I have never seen it so yellow before. This must be what the “yellow day” was like. 74.9°
 -
 Back in college I said the exact same thing to a prof...he said in my case it wasn't helpful for me to ask questions..
 -
SOI Dashboard Latest Southern Oscillation Index values SOI values for 14 Jul, 2026 Average SOI for last 30 days -23.53 Average SOI for last 90 days -17.62 Daily contribution to SOI calculation -36.56 Monthly average SOI values Apr -9.88 May -13.22 Jun -22.69 Date Tahiti (hPa) Darwin (hPa) Daily Contribution 30 day Av. SOI 90 day Av. SOI 14 Jul 2026 1011.36 1016.35 -36.56 -23.53 -17.62 13 Jul 2026 1010.44 1015.10 -34.53 -23.20 -17.20 12 Jul 2026 1009.89 1015.20 -38.53 -23.21 -16.92 11 Jul 2026 1011.77 1015.80 -30.66 -23.06 -16.66 10 Jul 2026 1013.16 1015.45 -19.94 -22.84 -16.52 9 Jul 2026 1011.59 1014.45 -23.45 -22.68 -16.60 8 Jul 2026 1008.90 1015.20 -44.63 -22.32 -16.71 7 Jul 2026 1009.02 1015.35 -44.81 -21.68 -16.58 6 Jul 2026 1011.31 1015.45 -31.33 -21.34 -16.28 5 Jul 2026 1010.44 1015.25 -35.46 -21.21 -16.03 4 Jul 2026 1010.84 1015.20 -32.69 -21.02 -15.72 3 Jul 2026 1012.59 1014.20 -15.76 -21.11 -15.44 2 Jul 2026 1012.97 1013.80 -10.96 -21.75 -15.38 1 Jul 2026 1013.06 1012.90 -4.86 -22.28 -15.31 30 Jun 2026 1012.34 1013.05 -14.06 -22.69 -15.35 29 Jun 2026 1012.32 1013.40 -16.66 -22.71 -15.25 28 Jun 2026 1012.24 1013.25 -16.17 -23.03 -15.20 27 Jun 2026 1011.64 1014.05 -26.01 -23.61 -15.12 26 Jun 2026 1012.48 1015.20 -28.19 -23.51 -14.93 25 Jun 2026 1012.84 1015.15 -25.31 -22.78 -14.75 24 Jun 2026 1011.76 1015.15 -32.90 -22.11 -14.60 23 Jun 2026 1011.31 1015.45 -38.17 -21.86 -14.34 22 Jun 2026 1012.65 1016.30 -34.73 -21.65 -14.02 21 Jun 2026 1014.99 1017.00 -23.20 -21.10 -13.63 20 Jun 2026 1015.10 1016.25 -17.15 -20.98 -13.17 19 Jun 2026 1014.90 1014.50 -6.26 -21.36 -12.93 18 Jun 2026 1015.57 1014.80 -3.66 -21.66 -12.87 17 Jun 2026 1016.03 1015.35 -4.29 -21.73 -12.88 16 Jun 2026 1015.83 1014.90 -2.53 -21.79 -12.82 15 Jun 2026 1014.24 1014.70 -12.30 -22.62 -12.75
-
 That’s why it’s helpful to ask questions lol
 -
MCS/Derecho chances on the rise for this weekend in the northwest flow around the heat dome- winds in those things can reach 100 mph ...........last one to hit central NJ was Labor Day 1998
-
Yes it does...
-
If an EF3 hits a forest and nobody is around, does it make a sound?
-
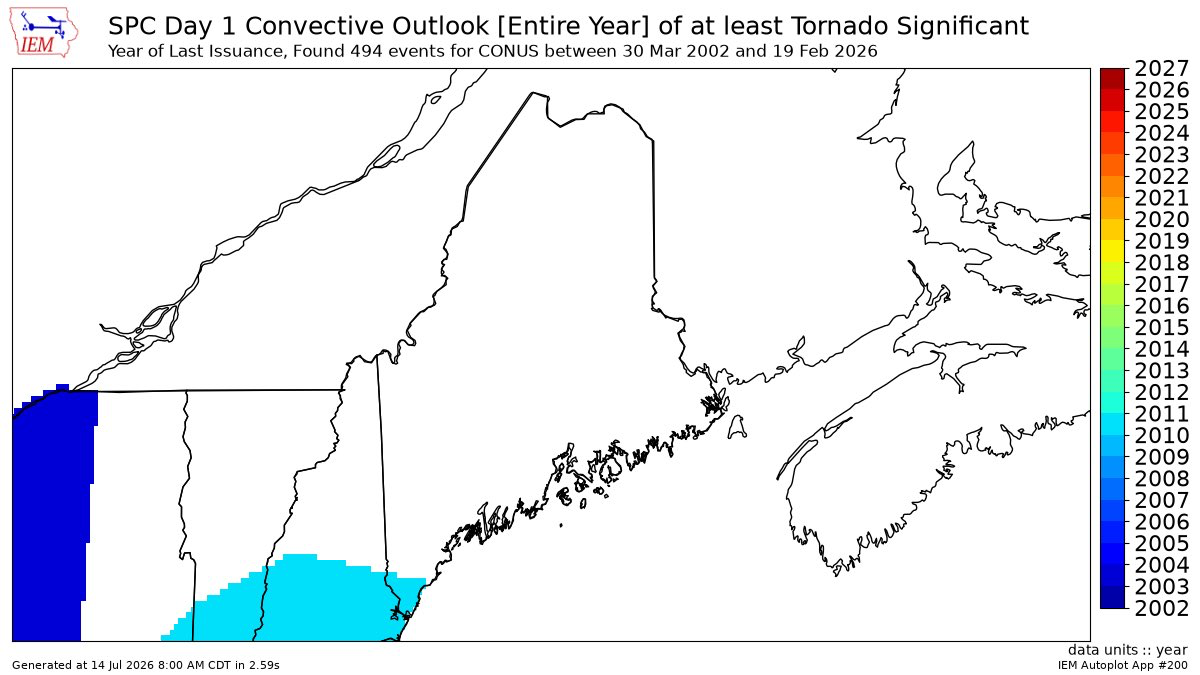
 The 10% hatching is not unprecedented in New England but has not occurred in that region before.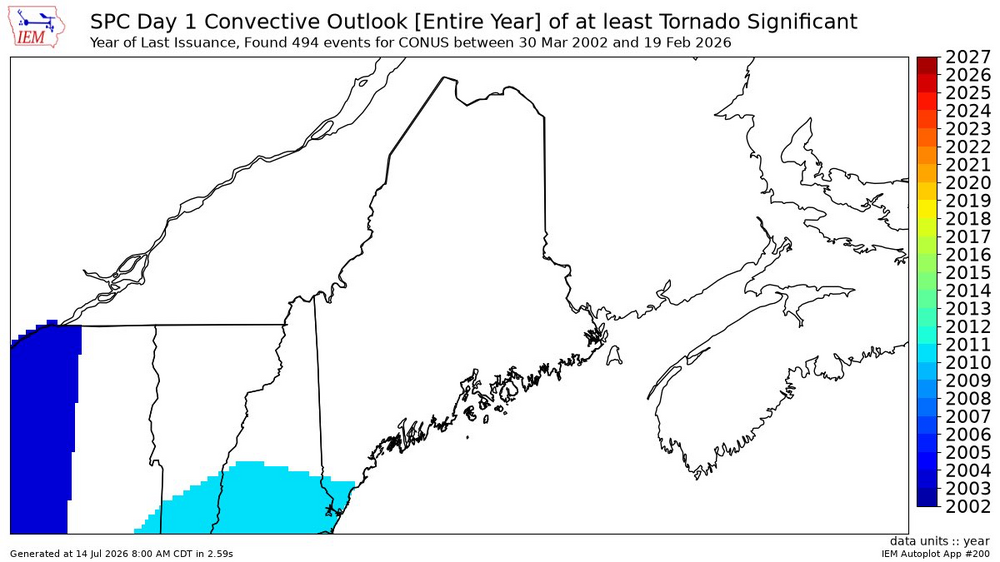
-
 77/64 pretty meh considering today was supposed to be oppressive
 -

2026-2027 Super El Nino
mitchnick replied to Stormchaserchuck1's topic in Weather Forecasting and Discussion
5 day average https://www.tropicaltidbits.com/analysis/models/?model=eps®ion=us&pkg=z500aMean&runtime=2026071400&fh=264 -
As of 11:15am an extremely thick smoke layer has moved overhead. I can look up at the sun and see it very clearly. No cirrus but an erry yellow glow like NYC had several years ago. I have never seen a smoke layer as dense as this while ground visibility is over 25 miles 75/64
-
Nope. Of course the whole week (and most of summer to this point) is dry too, which is so annoying. We will make the best of it, but rain would just add to the stress levels. New ICON is pretty rainy
-
2026-2027 Super El Nino
mitchnick replied to Stormchaserchuck1's topic in Weather Forecasting and Discussion
Eps says it's coming to a N. Hemisphere near you. https://www.tropicaltidbits.com/analysis/models/?model=eps®ion=us&pkg=z500a&runtime=2026071400&fh=210 -
Never easy is it? That will be us next year. Would be a mess here with rain
-
 About as useless as today’s event then. An EF3 will probably rip up a few million trees and no one will know.
 -
 Scientist tackles James Joyceian stream of consciousness. Fascinating!
 -
Fingers crossed for you. Been there done that. It does suck.
-
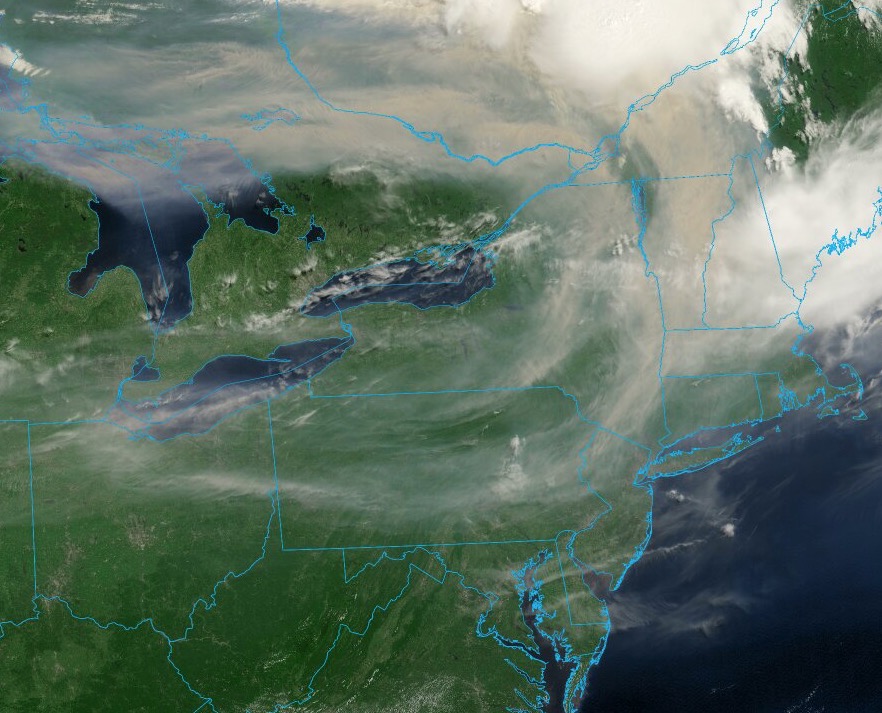
Current satellite of smoke plume. Surprised more air quality alerts are not being issued, at least for Upstate NY and New England?
-
Will take the morning or the night. My girls' grad party on Sat and will have nearly 100 people over. I'll have 2 large tents, but rain would still suck. ugh
-
It's actually normal for nocturnally driven MCS to decay after sun rise. Granted, that one did have a weak perturbation in the flow that helped ignite it way up there overnight, but once that happened... part and parcel to the vitality of the S part of the M C S ( mesoscale convective system) is what's known as "radiative cloud top cooling" ...this factor destabilizes the region over the MCS at mid and high levels; a smaller quotient of what is needed for the overall instability/machinery for the embedded cyclonic cycling to keep going. Sun rises; that factor disappears. poof. Anyway not sure what happened last month but just sayn'
.thumb.jpg.ad3a2e31d30aff035044689b311a0540.jpg)