All Activity
- Past hour
-
Worst gardening season in a long time. Depleted soils, not many bees and pollinators and not nearly enough sun leading to slow growth is pretty depressing. I had 2 good straws so far but the birds got them before I did
-
A peculiar aspect has been going on between the teleconnection prognostics ( from all sources), vs the operational counter parts of those sources. Those being ECMWF, GFS, CMC The telecons spread has been correlated to warmer than normal since early April The operational runs have been routinely/predominatingly low-balling, with modeled outlooks having a predominating tendency to materialize along the bottom margin of the correlation fields. They're doing it again now ... they are unrelenting keeping a N-stream anachronistic to the season, and this is suppressing real heat, as well as making flow unusually progressive along 40N across the continent ( not sure if this is a hemispheric plague but I suspect it's just N/A where this has been/is still the modeled case). And they have been winning.. We've had one or two hot days, everything else has been pedestrian.
-
Too much easterly flow .
-
Have yep. Even if it were partly sunny it’s definitely not a warm look.
-
Once again, western PA is favored. We in the east get the crap, but not the excitement.
-
Very moist morning. Touch of drizzle. Overcast 68f.
-
December, when for most, a pattern like this would be most desirable...lol
-
Oh the models are buckin' for a winter pattern analog - just doing it aoa 564 thickness instead of 534 - Take the depth of the thickness out, if you saw these synoptic features set up this way ( as the 00z Euro below), on Dec 10, you'd giddy for mood snows and holiday vibes...

-
At this point prepare for the worst, and reality will deliver even worse
-
The main thing with the few cooler summer intervals since 2010 like we saw in 2023, 2017, and 2014, has been that none of them have been really cool like 2009 was. Going forward we’ll have to see if we dry out later in the month into July allowing the more typical 90° heat. But the lack of 90° heat in May was singnaling that a high end summer for 90° days like 2022 and 2010 when Newark had close to 50 days wasn’t as likely. Since all our warmest summers have been preceded by heat in May.
-
People's expectations are also too high. I think our average is still below 80F. We shouldn't be seeing 90+ daily weather. In fact we're averaging AN after first 8 days of June.
-
Seems like summer to me...
-
The persistence of cloud cover the last several months is almost annoying as the high winds of the last several months, although that seems to be diminishing.
-
If averages are 80 then having highs in the 70s are not exactly jacket weather. It's still summer weather, just not 90 and humid.
-
-
I am still not seeing any signs of true summer on the models. Now looks more average to just below average moving through June. Forecast for ticks and mosquitoes looks to remain extra abundant!
-
Loop the models, it’s a weak low going well south. But any clouds and rain at this point will piss us off lol.
-
I don’t see a coastal on any model.
-
I dunno, the AFD is calling for a coastal.....
-
Which models are better at this?
-
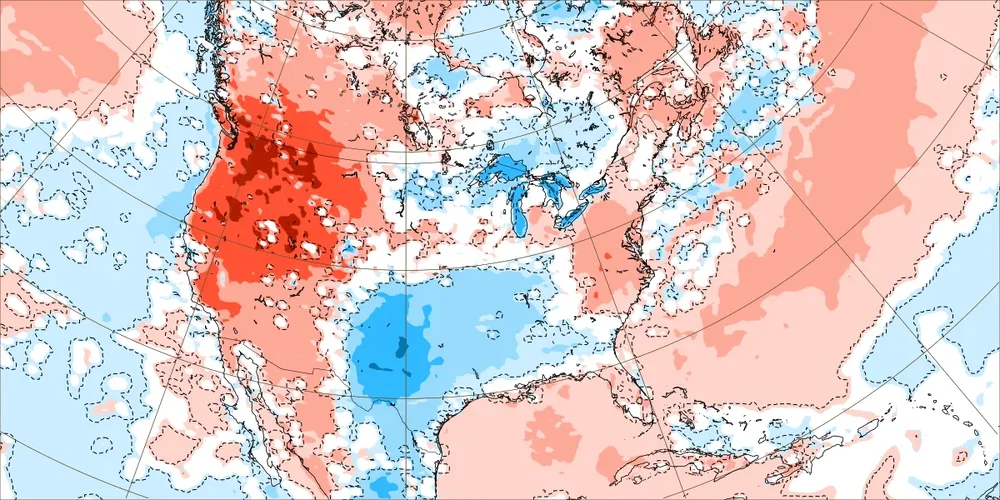
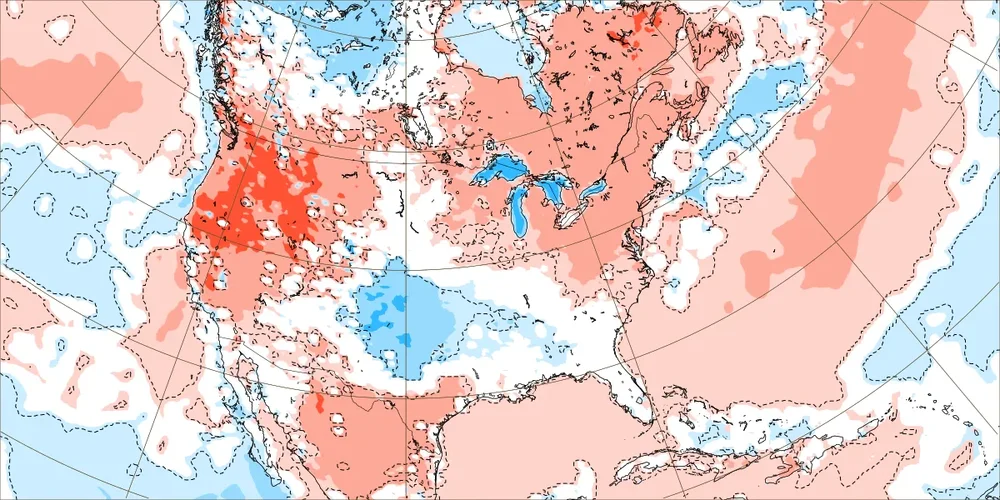
Rainy patterns have been the only way that we have avoided heat during the summers since 2010. Closer to average summer temperatures have been associated with wet onshore flow patterns. So it’s no surprise that the models have less heat going forward than earlier runs. But this introduces the risk of flooding when the systems or storms stall out. We have been seeing this pattern to our north since the start of May with 10”+. The real risk is that some spot gets 10”+ of rain in a few hours rather than spread out over a month during the summer into fall. This is when the severe flooding occurs like Southern CT and Suffolk County saw last August. June 9 to 16 more onshore flow and showers than originally forecast leading to very comfortable June temperatures. New run Old run
- Today
-
Nope, I was just matching the years when you claimed the Philadelphia Airport was having a big heat island effect. I am happy to go further back. I extended my chart back to 1941, the origin of temperature data collection at the Philadelphia airport. The Philadelphia airport matches Coatesville fairly well until the big Coatesville station moves in 1946 and 1947, whose effect is clearly seen. Before the station moves, the Coatesville station was located in a built up section of the City of Coatesville. Roughly as warm as the Philadelphia Airport. Not representative of Chester County. The big heat island effect on this chart is in Chester County not Philadelphia. The reverse heat island due to the Coatesville station move to a more rural location. The West Chester station experienced a similar move to a cooler, less built-up, location in 1970. The 1970s are cool in your chart because of faulty analysis. If you correct for the station moves and other network siting changes over the years, like NOAA does, the 1970s don't stand out as a cool decade. Funny that you complain about heat island effects in Philadelphia but ignore them in Chester County.

-
It’s basically a WNW to ESE moving system with the low well to the SW. This time of year you don’t have the baroclinic processes to force precip well north and east. We’ll see. Maybe it’s a ribbon of clouds and some showers, but I could see many areas staying dry the further north and east you go.
-
Yeah, I have read that the ECMWF has been working on that. Use AI to bias correct the NWP OP and ENS model runs. But they say that it takes an enormous amount of computing power. I adjust the models manually after recognizing the biases. A stronger Southeast Ridge or Western Atlantic Ridge has been a regular model bias in the East than original forecasts. So systems which initially start out further south and end up more north. So we have to manually adjust for that when doing longer range outlooks. This was the main model bias during February 2025. On the Pacific side the Northern Stream has been verifying much stronger. This has lead to the long range models being too strong with the -EPO. So the ridge in that region usually ends up weaker than originally forecast. This was the case last December when the models missed the record +EPO vortex later in December.
-
"I am continuing to watch the chance for showers, once again poorly timed for the weekend - along with below average temps. This would make the 13th Saturday in a row across SNE with at least some rain. All the models show that chance for showers. I wouldn’t call it a washout yet…the Euro has an ensemble mean rainfall around 0.25”….the GFS is closer to 0.15”…the Canadian is wettest closer to 0.50”. "