All Activity
- Past hour
-
2026 Atlantic Hurricane Season
NorthHillsWx replied to Stormchaserchuck1's topic in Tropical Headquarters
I know it’s always overzealous with the tropics but the recent GFS run shows 4 separate MDR systems in a row including 94L and 92L, the current invests. While Caribbean shear and the TUTT over SW Atlantic persists this active wave could really boost season numbers tho I doubt any get far west or very strong -
Continued improvement for our area with drought expansion for the rest of the CONUS.
-

Occasional Thoughts on Climate Change
Typhoon Tip replied to donsutherland1's topic in Climate Change
I don't know why we are expending energy with this denier BS - they're not going to get it. Cows would understand this by now; they are too predisposed in their myopic agenda. They spin around in these tiny little realms that are insular and insulating them from seeing/understand the holistic perspective. That kind of fallacy of approach to reality can only be explained by one or two causes: irreparable stupidity, or amoral lying. That's it. There's no point in arguing with them. The objective reality is: CC is real, humans are causing it. The amount of that role is causing debate? so what! It doesn't change the fact that the species is at minimum exacerbating (then), which still makes them just as responsible. In either scenario we cause our demise. It kind of reminds me of the Samuel Clemens quip, paraphrasing 'never argue with a stupid person; in order to do so requires bringing you down to their level where they are masters of the craft' -

2026-2027 Record-breaking El Nino
PhiEaglesfan712 replied to Stormchaserchuck1's topic in Weather Forecasting and Discussion
That composite almost looks like 2009-10 in North America. That was the one that produced record warmth in Western Canada, which had an effect on the 2010 Winter Olympics in Vancouver. -

Augdewst 2026: Summer's Last Stand
weatherwiz replied to Prismshine Productions's topic in New England
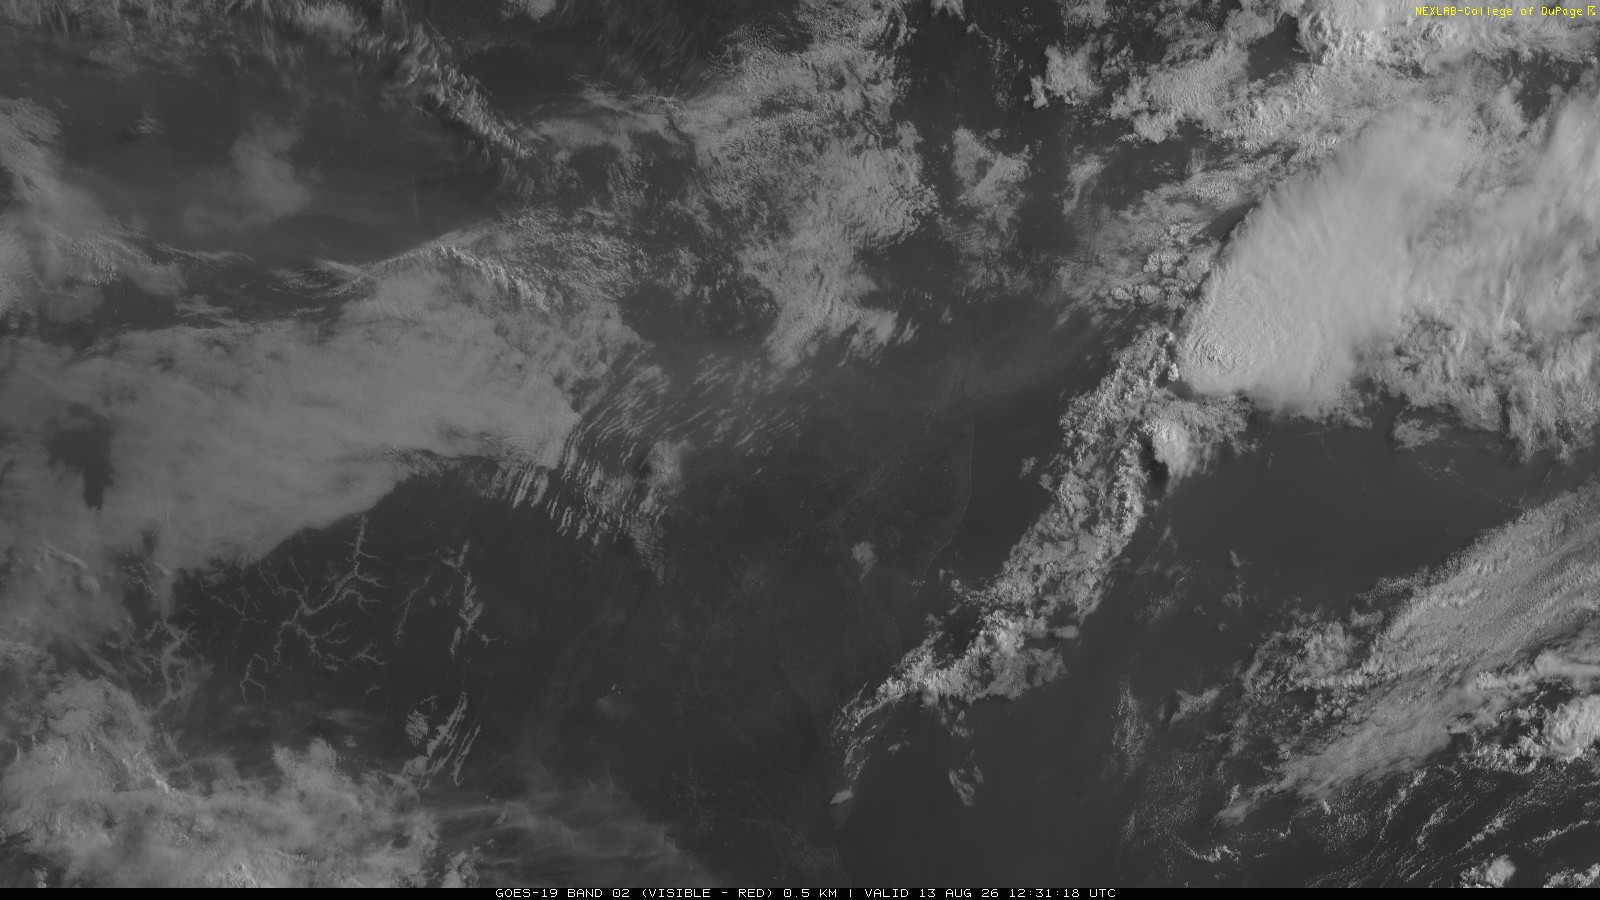
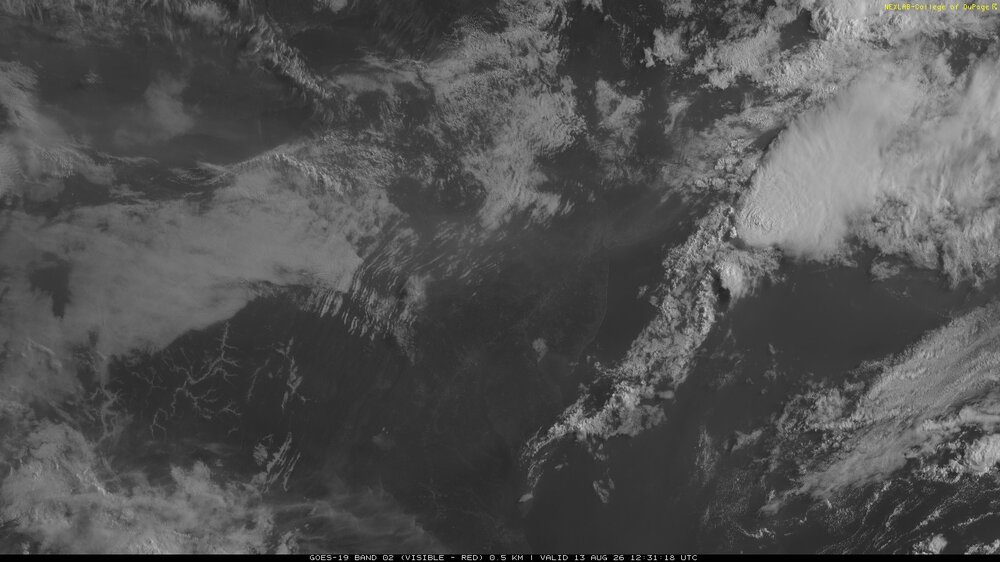
Going to pull up radar data from this morning -
Thankfully not too thick and mostly elevated, but a noticeable band of smoke is moving through the area today from western wildfires HRRR for 2pm today:
-

Augdewst 2026: Summer's Last Stand
OrangeCTWX replied to Prismshine Productions's topic in New England
Not sure how this happened but there was a partial building collapse in town as well from the storm .
-
hey I’ve seen this one before
-
Augdewst 2026: Summer's Last Stand
OrangeCTWX replied to Prismshine Productions's topic in New England
Ya worse of it was like a mile at most to the south of me. Got lucky there. There was an interesting velocity scan around that time, I should have taken a screenshot but I was just pissed at the time that I lost power and that I was woken up lol -
Augdewst 2026: Summer's Last Stand
weatherwiz replied to Prismshine Productions's topic in New England
So glad we got to use Cristobal for a name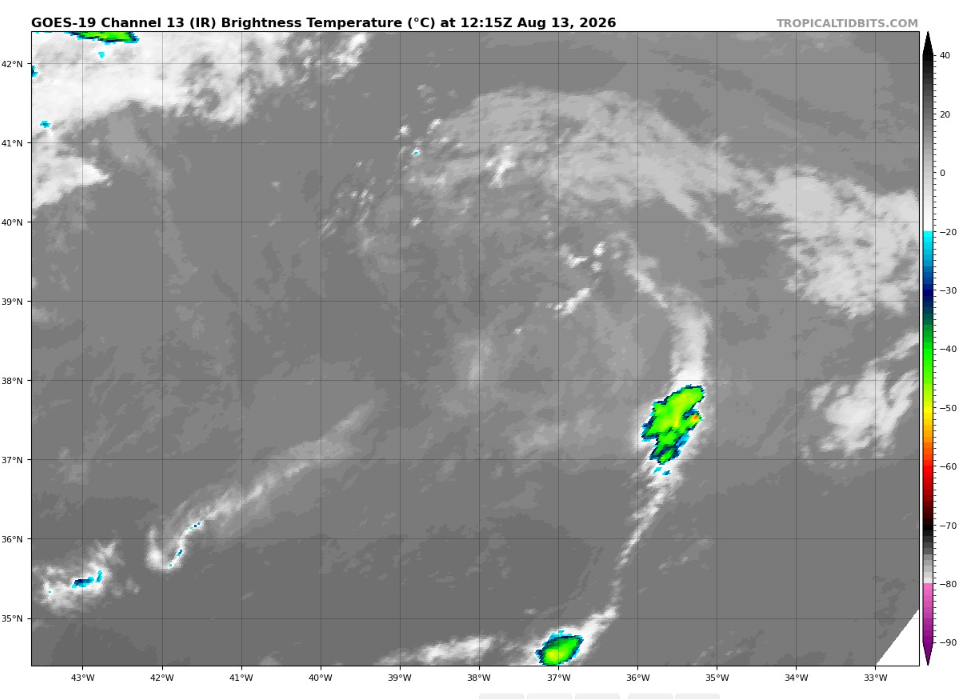
-
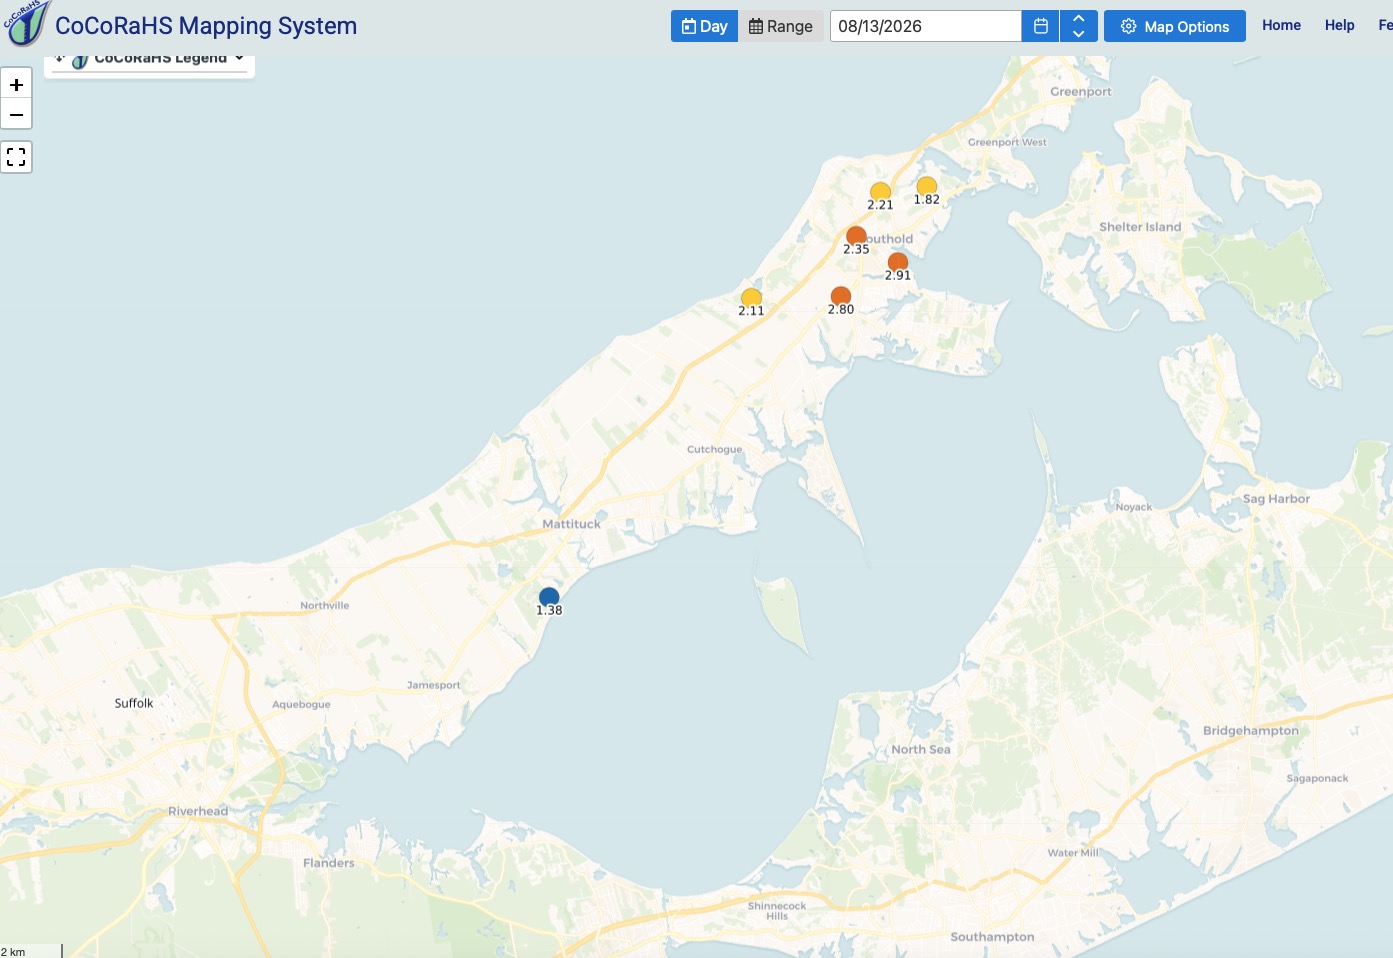
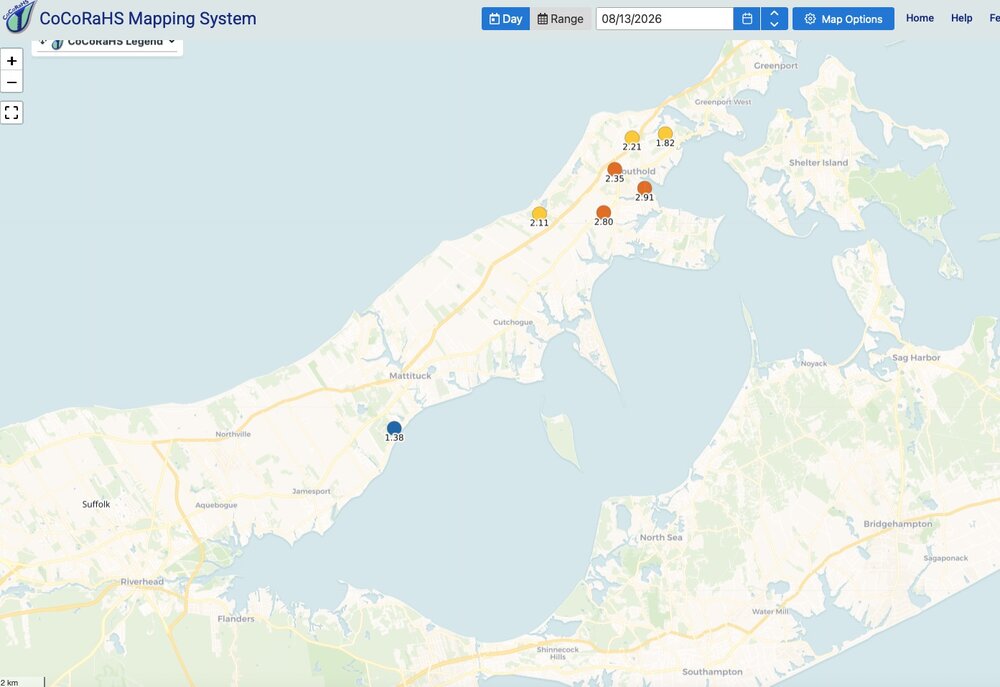
North Fork of L.I. got a local drenching last night.
-
Augdewst 2026: Summer's Last Stand
weatherwiz replied to Prismshine Productions's topic in New England
Looks like a big severe day for PA on Sunday...shocker -
Augdewst 2026: Summer's Last Stand
weatherwiz replied to Prismshine Productions's topic in New England
It hasn't rained here since overnight DROUGHT!!!! -
Augdewst 2026: Summer's Last Stand
weatherwiz replied to Prismshine Productions's topic in New England
I think my friend may have gone after that. I briefly saw some video/time lapse he got...assuming that is the cell. I'll have to ask him -
Picked up another .42" of rainfall from an overnight T-Shower. Loud thunder and a burst of heavy rain. No wind and just a flash or two of lightning. Total rainfall month so far: 4.98".
-

Augdewst 2026: Summer's Last Stand
dendrite replied to Prismshine Productions's topic in New England
Steiiiiiiiiiiiiiiiin, why you punish me? -

Occasional Thoughts on Climate Change
TheClimateChanger replied to donsutherland1's topic in Climate Change
I wanted to take a closer look at the claim that NOAA/NCEI’s July 2026 temperature ranking is largely the product of “tampering” or adjustments to the historical temperature record. Tony Heller has advanced this claim on X/Twitter, and we've seen similar claims made by members here (cough, cough, ChescoWx). So I downloaded the raw USHCN Tmax and Tmin monthly data directly from NOAA, without applying NOAA’s homogenization adjustments, and tried to see how far one can get using the raw observations alone. The results were pretty illuminating. The first issue is that simply averaging the absolute temperatures of all available USHCN stations each year is not a very good way to construct a national temperature series. Although USHCN contains 1,218 designated stations, nowhere near 1,218 stations report in every July. The number of stations with both Tmax and Tmin data increased from only about 528 in 1895 to roughly 1,200 by the 1930s–1960s, then began declining sharply in recent decades: 1990: 1,180 2000: 1,115 2010: 980 2020: 779 2025: 730 2026: 458 so far in the August 12 archive That creates a compositional problem. If the stations disappearing from the network are climatologically warmer or cooler than those remaining, the simple national average can change even if temperatures at every individual station do not. Note that 2026 data is provisional, as a lot of stations are not yet reported in the dataset file. Step 1: Calculate station anomalies To deal with this, I calculated a 1951–1980 July climatology for each individual USHCN station. This was a particularly useful reference period because station coverage was near its peak; 1,217 of the 1,218 stations had sufficient data to calculate a usable climatology. For every station and every July, I then calculated: July anomaly = observed July temperature − that station’s own 1951–1980 July mean This removes most of the changing-station-composition problem, because a hot station disappearing from the network no longer mechanically lowers the national average merely because its absolute climatological temperature was higher. That made a surprisingly large difference in recent decades. For July Tmax from 1990–2025: simple raw station-average trend: +0.35°F/decade station-anomaly trend: +0.55°F/decade composition effect: about −0.20°F/decade From 2000–2025: simple raw Tmax trend: only +0.09°F/decade station-anomaly trend: +0.34°F/decade composition effect: about −0.25°F/decade Why? Because the climatological July Tmax of the stations actually reporting has declined substantially: Year Mean July climatology of reporting Tmax stations 1990 87.39°F 2000 87.43°F 2010 87.31°F 2020 86.96°F 2025 86.88°F In other words, the modern USHCN reporting network has increasingly become composed of cooler stations. Simply averaging their absolute temperatures therefore introduces an artificial cooling tendency. The same phenomenon appears in Tmin. Using an equal-station anomaly calculation, July 2026 came out approximately: Tmax: +1.66°F Tmin: +3.71°F Tavg: +2.68°F On that basis, 2026 ranked roughly: 14th warmest Tmax 1st warmest Tmin 5th warmest Tavg But there was still another problem. Step 2: Geographic weighting A station in a densely sampled part of Ohio should not carry the same national weight as a station representing a huge area of Nevada, Montana, or Wyoming. So I took the raw USHCN station anomalies and placed them on a fixed 0.25° CONUS land grid. Each grid cell was assigned the anomaly of its nearest reporting USHCN station, and the resulting cells were area-weighted using the cosine of latitude. This is essentially a simple Voronoi-style geographic weighting. Importantly, it does not use NOAA homogenization. It does not alter the raw station observations. It merely prevents regions containing many stations from receiving disproportionately large weight in the national average. The effect was substantial. After rebasing our resulting national series to the same 1901–2000 reference used by NCEI, several important Julys looked like this: Year Equal-weight raw USHCN Area-weighted raw USHCN NCEI 1901 +3.25°F +2.55°F +2.60°F 1934 +2.99°F +2.87°F +2.72°F 1936 +3.32°F +3.29°F +3.14°F 1980 +2.02°F +2.12°F +2.09°F 2000 −0.59°F +0.02°F +0.22°F 2006 +2.32°F +2.59°F +2.76°F 2012 +3.15°F +2.95°F +3.10°F 2022 +2.02°F +2.56°F +2.76°F 2023 +1.25°F +1.76°F +2.02°F 2024 +1.47°F +1.77°F +2.07°F 2026 +2.67°F +3.15°F +3.26°F The 1901 result is especially revealing. Under a naïve equal-station average, 1901 appeared about 0.65°F warmer relative to NCEI. Once the raw observations were geographically weighted, the discrepancy collapsed to about 0.05°F. The same thing happened at the other end of the record. Our equal-station calculation put 2026 at only about +2.67°F, compared with NCEI’s +3.26°F. Geographic weighting alone moved the raw-USHCN result to +3.15°F. No homogenization adjustment was necessary to explain most of that gap. Final raw-USHCN ranking Using the geographically weighted raw station anomalies, the leading Julys were: 1936: +3.29°F 2026: +3.15°F 2012: +2.95°F 1934: +2.87°F 2006: +2.59°F 2022: +2.56°F 1901: +2.55°F NCEI places 2026 slightly ahead of 1936 instead: 2026: +3.26°F 1936: +3.14°F So after controlling for station composition and geographic weighting, the difference between our deliberately simple raw-data-only method and NCEI is not some enormous discrepancy. Our raw calculation has 1936 about 0.15°F warmer than 2026. NCEI has 2026 about 0.12°F warmer than 1936. That leaves only about a 0.27°F swing in their relative difference between our raw-data method and the full NCEI analysis. Now compare the entire records This was perhaps the most surprising result. Once the raw USHCN observations are converted to station anomalies and geographically weighted, the resulting curve lies almost directly on top of the official NCEI series. Across 1895–2026, the mean absolute difference between the two annual July anomaly series is only about 0.11°F. And remember what went into our series: raw USHCN observations individual station climatologies geographic weighting That's it. No NOAA homogenization adjustments were applied. What does this actually tell us? This certainly does not demonstrate that every NOAA adjustment is perfect, nor does our simple experiment precisely reproduce NOAA’s methodology. NOAA uses a larger station network, homogenization, and substantially more sophisticated spatial interpolation. But it does demonstrate something important. Most of the apparent disagreement between a naïve “raw USHCN” calculation and NOAA/NCEI can be reproduced without changing a single thermometer observation. Two mundane methodological problems explain an enormous portion of it: Changing station composition Unequal geographic station density The raw USHCN network has lost hundreds of reporting stations in recent decades, and the stations disappearing have, on average, been climatologically warmer than those remaining. That artificially suppresses recent temperatures if one simply averages absolute station readings. Meanwhile, equal station weighting gives densely sampled portions of the country far too much influence. Correcting that spatial bias pushes recent hot years upward and, in some cases, early hot years downward. The transformation of 1901 is particularly instructive: Naïve raw USHCN: +3.25°F Geographically weighted raw USHCN: +2.55°F NCEI: +2.60°F And for 2026: Naïve raw USHCN: +2.67°F Geographically weighted raw USHCN: +3.15°F NCEI: +3.26°F So when someone produces a graph of “raw USHCN temperatures” and argues that the difference from NOAA must therefore have been manufactured through data adjustments, there is a very large omitted variable: how the raw data are aggregated in the first place. A simple station-anomaly calculation plus basic geographic weighting — using the unaltered raw observations themselves — gets astonishingly close to the official NCEI record. -

Augdewst 2026: Summer's Last Stand
Damage In Tolland replied to Prismshine Productions's topic in New England
-
Gotta keep an eye on this. Depending on synoptic setup could be local drenchers which many places don't need or want. Local flooding threat.
-
.thumb.gif.f92b16c631a1d15d405ed77b33f0710d.gif)
Augdewst 2026: Summer's Last Stand
Torch Tiger replied to Prismshine Productions's topic in New England
Steined again. He's really hitting home locally -
 Sometimes I think my life is not always that exciting. Then I come here to see that this weird ass discussion is still going on after more than 2 years.
 -
High Dewpoints also returning by Sunday - Flooding rains on the table ???
-
Augdewst 2026: Summer's Last Stand
Damage In Tolland replied to Prismshine Productions's topic in New England
Sunday night / Monday seems to be congrats north of pike to Dendy -
Central PA Summer 2026 Discussion/Obs Thread
Mount Joy Snowman replied to Voyager's topic in Upstate New York/Pennsylvania
Yeah it seems there is a very light density layer hanging around the area but should be spotty and looks like it should clear out for the weekend. -
I downloaded a really cool app yesterday called RainDrop. I see where your area got exactly what you said. It was a small area that got rain last night. RainDrop= Super cool app