All Activity
- Past hour
-
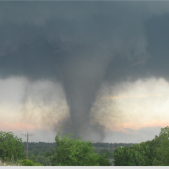
Can confirm. The warm season is ready to come in like a banshee
-
Records: Highs: EWR: 92 (1956) NYC: 89 (1956) LGA: 89 (1956) JFK: 82 (2004) Lows: EWR: 37 (1938) NYC: 39 (1895) LGA: 42 (2019) JFK: 41 (2020) Historical: 1866: A tornado destroyed a toll bridge near Barnet, VT. (Ref. Wilson Wx. History) 1878: Record low temperature for Washington, DC for the date is 39 °F. (Ref. Washington Weather Records - KDCA) 1881: Record maximum temperature for Washington, DC for the date is 95 °F. (Ref. Washington Weather Records - KDCA) 1922: A mid-afternoon hailstorm dropped hailstones 0.5 inches in diameter at Montpelier, VT. Along the 550 yard wide and 3 to 4 mile long hail swath, ice laid 4 inches deep with local piles up to two feet deep. (Ref. Wilson Wx. History) 1930 - A man was killed when caught in an open field during a hailstorm northwest of Lubbock TX. It was the first, and perhaps the only, authentic death by hail in U.S. weather records. (David Ludlum) 1961: A late season storm covered Cheyenne, WY with 10.3 inches of snow. (Ref. Wilson Wx. History) 1975: Severe thunderstorm winds lasting 20-30 minutes damaged over 90 of the 600 planes based at the Ft. Lauderdale International Airport. The FAA tower measured winds gusting to 101 mph. Tied down aircraft were ripped from their moorings. The roof of the terminal was slightly damaged, hail was reported and two inches of rain fell in an hour. Tennis-ball size hail fell at Wernersville, PA. Hail accumulated to a depth of 10 inches. (Ref. Wilson Wx. History) 1980: An F3 tornado ripped directly through the center of Kalamazoo, Michigan, killing five people, injuring 79, leaving 1,200 homeless and causing $50 million in damage. The tornado passed directly over the American Bank, where a barograph reported a pressure drop of 0.59 inches. 1981 - A tornado 450 yards in width destroyed ninety percent of Emberson TX. People did not see a tornado, but rather a wall of debris. Homes were leveled, a man in a bathtub was hurled a quarter of a mile, and a 1500 pound recreational vehicle was hurled 500 yards. Miraculously no deaths occurred in the tornado. (The Weather Channel) 1987 - A cold front brought an end to the early season warm spell in the north central U.S., but not before the temperature at Sioux City IA soared to a record warm 95 degrees. Strong southwesterly winds ahead of the cold front gusted to 52 mph at Marais MI. Evening thunderstorms produced golf ball size hail at Rockford MN, and wind gusts to 75 mph at Belmond IA. (Storm Data) (The National Weather Summary) 1988 - Strong winds along a cold front ushering cold air into the northwestern U.S. gusted to 69 mph at Myton UT. Temperatures warmed into the 80s ahead of the cold front, as far north as Montana. (The National Weather Summary) (Storm Data) 1989 - Thunderstorms developing along a warm front produced severe weather in the Southern Plains Region during the afternoon and night. A thunderstorm at Killeen TX produced wind gusts to 95 mph damaging 200 helicopters at Fort Hood causing nearly 500 million dollars damage. Another thunderstorm produced softball size hail at Hodges TX. (The National Weather Summary) (Storm Data) 1990 - Thunderstorms developing ahead of a cold front spawned ten tornadoes from eastern Wyoming to northern Kansas, including seven in western Nebraska. Thunderstorms forming ahead of a cold front in the eastern U.S. spawned five tornadoes from northeastern North Carolina to southern Pennsylvania. Thunderstorms over southeast Louisiana deluged the New Orleans area with four to eight inches of rain between 7 AM and Noon. (The National Weather Summary) (Storm Data) 1995: This outbreak produced tornadoes extending from the Mississippi River near Burlington, Iowa, to the west of Bloomington, Illinois. Two violent tornadoes, each ranked at F4 intensity, were reported. The first tornado traveled 60 miles from near Fort Madison, Iowa, to the southeast of Galesburg, Illinois producing over $10 million damage. The town of Raritan, Illinois was hit the hardest. The second violent tornado traveled 7 miles across Fulton County from Ipava to Lewistown, Illinois producing $6 million damage. Another strong tornado took a 25-mile path across parts of Fulton, Mason, and Tazewell Counties. The storms also produced softball-size hail south and northwest of Macomb in Illinois. Five men were injured in Lawrence County, Indiana when lightning struck one of them and traveled to the other four. There were 184 reports of severe weather, including over three dozen tornadoes. 2001: Two brothers hiking with their family in the Zion National Park in Utah were swept away when flash flooding suddenly struck after a burst of heavy rain. The youngsters were ahead of the rest of their family when they came to a part of the trail that was underwater. They were swept away as they attempted the cross the flooded part of the trail. 2002: (12th-13th) flash flooding occurred on almost every watercourse in MO’s Iron County; $5.5 million damage. Many people trapped in cars by flood waters. Near Ironton, a man crossing Stouts Creek by foot to rescue his dogs was swept away/drowned. (Ref. Weather Guide Calendar with Phenomenal Weather Events 2011 Accord Pub. 2010, USA) 2008: Shreveport-Bossier, Louisiana: Torrential rainfall breaks several records, including the most rain to fall in a 20-minute interval and the most rainfall in a 180-minute period. More than 10 inches of rain deluged the Shreveport area, flooding at least 125 homes. The National Weather Service reports 4.43 inches fell in one hour braking the old record of 3.16 inches. (Ref. WxDoctor)
-
63 / 48 clouds and showers shunted north for now. Clouds coming in maybe some stray showers/light rain later. Wet Thursday 0.25 - 0.50. The cut off trough ull slowly moves through and out Friday with late clearing but cool. Moderation quickly to a much warmer pattern Sat (5/16) - beyond. >80s Sat - Wed for many and perhaps some 90 degree readings on Mon/Tue. After a transient front , ridge rebuilds and outside of onshore tenedency an overall warm to very warm period ensuing through the Memorial day weekend and the the week of may 26th.
-

2026-2027 Strong/Super El Nino
snowman19 replied to Stormchaserchuck1's topic in Weather Forecasting and Discussion
If this traditional ONI projection is correct, we would not only set a record for the traditional ONI since 1950, it would also set a record for the new RONI. If we assume the RONI lags the ONI by .05C to 0.6C and the traditional ONI peaks at that level, it would very easily beat the highest RONI on record since 1950, which was 1982-83 at +2.5C ^ “Well, after looking through the climate reanalysis on SST anomalies dating back to 1980. If the Preliminary SSTs get confirmed. We are now ahead of the 3 most famous El Niños on record. 1982-1983, 1997-1998 & 2015-2016. Again, I'm not kidding, we are running about 0.18 °C higher. This El Niño has a very high ceiling with a possible peak in November & December of this year of 3.5-3.9 °C above average. Not only that, there is a slim possibility that SST in the Niño 3.4 region may hit a new all-time record of 29.9-30.0 °C, which is 85-87 F.” -
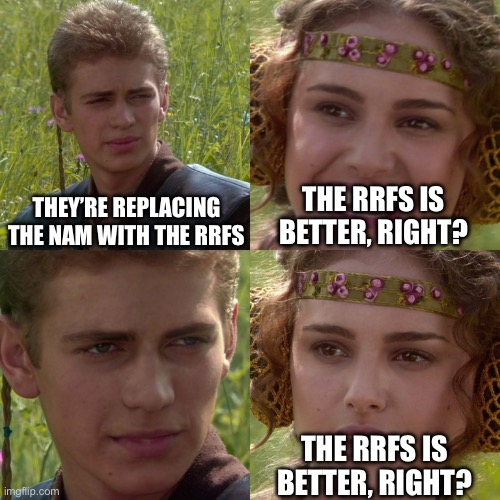
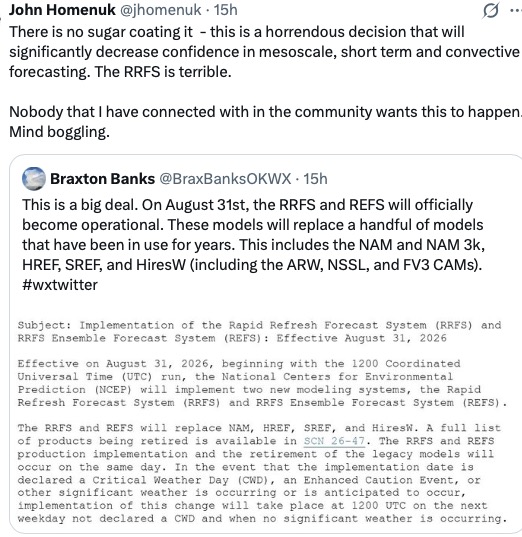
Not a popular move. I feel the same way...see above.
-
I'd rather they all hung around. I personally don't think the RRFS is quite ready to solo in prime time. At least we knew the inherent short comings in the existing soon to leave us models and could use them as tools. NAM always seemed superior to other guidance (most of the time) in nailing CAD and speed of mid level warming in snow to mix/rain scenarios. Will miss that.
-
NBMv5 became operational last week. Curious to see how this performs.
-
Summer/Deep Spring starts Saturday good riddance to the extended late winter/early Spring meh
-
The RRFS is good right?
- Today
-
Euro / NAM are relative Steins east of River . Both 25-.40 or so . Only gfs has significant rains there
-
If everyone thinks its dry now just wait until we move into Fall and Winter. With a super, super, super strong EL Nino coming the Walker Circulation is going to get so expansive and swallow the entire U.S. There will be no storm track...just a massive high pressure from coast to coast. We'll be seeing highs in the 80's into November and highs in the 50's and 60's through the winter. No precip
-
I thought hard about that . But we’ve mainly lost good winters ( I know we just had one). But they are so rare anymore that I’d rather HHH and storms and possible canes if a rifle is as pointed at my knee.
-
And the summer months above the winter months. We old now.
-
Wow Feb above Dec despite the holiday and low sun angle? Winter wise…does anything beat a snowy Dec?
-
The spring months are the worst. Just a terrible season . Julorch Augdewst Junorch January February December Septorcher November Octornace Mayorch Morch Napril
-
Growing consensus for 1-3” S NH/ME into NE MA…euro, gfs, 3k. The soaker I’ve been waiting for?
-

Central PA Spring 2026 Discussion/Obs Thread
Superstorm replied to Voyager's topic in Upstate New York/Pennsylvania
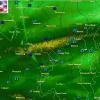
I did hear on channel 16 weather that this was the coldest May to date on record for northern PA. . -
(002).thumb.png.6e3d9d46bca5fe41aab7a74871dd8af8.png)
Central PA Spring 2026 Discussion/Obs Thread
ChescoWx replied to Voyager's topic in Upstate New York/Pennsylvania
Mostly cloudy today with highs not too far from average near 70 degrees. Some rain showers and maybe a thunderstorm late tonight ending toward rush hour tomorrow. We fall back to below normal temperatures both tomorrow and Friday before a big warm up with temperatures across the county reaching around 80 degrees on Saturday and the mid to upper 80’s on Sunday and Monday. Next Tuesday should be the hottest day with temperatures especially in lower valley locations possibly touching 90 degrees. We will get cooler again by the middle of next week.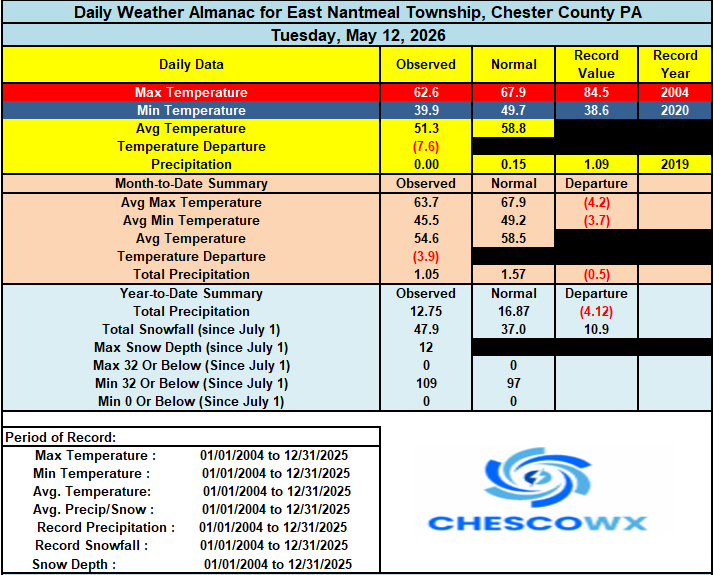
-
E PA/NJ/DE Spring 2026 Obs/Discussion
ChescoWx replied to PhiEaglesfan712's topic in Philadelphia Region
Mostly cloudy today with highs not too far from average near 70 degrees. Some rain showers and maybe a thunderstorm late tonight ending toward rush hour tomorrow. We fall back to below normal temperatures both tomorrow and Friday before a big warm up with temperatures across the county reaching around 80 degrees on Saturday and the mid to upper 80’s on Sunday and Monday. Next Tuesday should be the hottest day with temperatures especially in lower valley locations possibly touching 90 degrees. We will get cooler again by the middle of next week.
-
Per radar estimates some areas in the exceptional drought north of Jacksonville got 4-7”+ from this system too but like you said a large area of 1-3” was seen across that area south of you in the worst of the worst drought area
-

2026-2027 Strong/Super El Nino
40/70 Benchmark replied to Stormchaserchuck1's topic in Weather Forecasting and Discussion
Man, the ERA 5 dataset doesn't have velocity potential...I hate that. @bluewave Do you know of any resources to plot VP? -
Min 35° Maybe the last of the 30s here? Climo says no, but there’s none in the extended currently. I’m sure we’ll sneak some upper 30s in somewhere even if it’s early June. Euro is pushing 100° in Philly for a couple of days next week.
-
Big Euro and AI upgrade. https://www.ecmwf.int/en/about/media-centre/news/2026/ifs-cycle-50r1-aifsv2-live A significant upgrade to ECMWF's Integrated Forecasting System (IFS), Cycle 50r1, has gone live today (12 May 2026) alongside an update to the Artificial Intelligence Forecasting System (AIFS v2). Cycle 50r1 introduces a more consistent and integrated approach to forecasting the atmosphere’s interactions with the ocean through fully coupled data assimilation, and improvements to known issues with accurately forecasting sudden, heavy, localised rain. It also brings more advanced representation of waves and sea ice. The update to the AIFS introduces, among other features, ECMWF’s first data-driven wave and snow cover forecasts. Florian Pappenberger, Director-General of ECMWF, said: “This is an important upgrade for ECMWF and for everyone who relies on our forecasts. IFS Cycle 50r1 strengthens our physics-based forecasting system, including through fully coupled atmosphere–ocean–sea-ice assimilation and new ocean and sea-ice capabilities. "With AIFS v2, we are expanding its performance, bringing a new generation of AI forecasting into operation, building on ECMWF’s technical competence, operational expertise and data infrastructure. Together, these advances reflect ECMWF’s commitment to innovation and close co-development with our Member and Co-operating States in delivering better forecasts, increasing the value to society.” Matthieu Chevallier, ECMWF’s Head of Forecast Evaluation, added: “The updates to these systems, being formally announced today, will together provide numerous benefits to users of our forecasts. Alongside the scientific and technical advances in coupled modelling and data assimilation, and innovation with AI techniques, we have responded to users’ feedback, for example, with new products. We look forward to hearing their reaction to the quality and accuracy of our forecasts, and on how it impacts their applications.” Forecasting improvements One of the most significant changes to the IFS introduced with Cycle 50r1 is a better representation of convective precipitation, which causes heavy rainfall and violent thunderstorms but is hard to predict because it occurs at smaller scales. The revised convection and cloud-microphysics scheme will reduce excessive stationary rainfall and, instead, represent more realistically how it moves from the ocean across the land. IFS users will also see the introduction of the new NEMO4-SI³ ocean and sea-ice model, bringing substantial improvements in forecasts and analysis over the marine areas, as well as over 40 new ocean and sea ice-related variables. Key improvements include a more accurate representation of how sea ice affects the power of waves and the interactions between waves and ocean currents, often at play in rougher seas. Other improvements for IFS include improved tropical upper-air temperature and wind forecasts, and improvements to temperature and humidity forecasts around the tropopause. For the Copernicus Atmosphere Monitoring Service (CAMS), one of two Copernicus services operated by ECMWF on behalf of the European Commission, the IFS update will enhance the atmospheric composition and greenhouse gas forecasts. The improvements range from the assimilated observations to aerosols and reactive gases, as well as enhanced input data on human-driven emissions. For AIFS, both the Single and Ensemble versions of the system are being upgraded to version two, with each introducing a new wave component. Eleven wave-related variables are being made available to users, enabling predictions, for example, of when we will experience rougher seas. In addition, the AIFS Single v2 wave component shows substantial improvement in the medium-range skill of wave forecasts compared to the physical model, IFS Cycle 50r1. ECMWF’s first data-driven snow cover forecasts are also being introduced with this upgrade. Again, the AIFS Single v2 forecasts show improved performance compared to IFS Cycle 50r1 forecasts, with the predicted snow cover fraction closer to observations. Victoria Bennett, ECMWF's Head of User Services Section, said: “These new cycles bring improvements to the models and introduce new products that address requests from users. In addition, with IFS, we have now removed the duplication between the old “HRES” single forecast and the Ensemble control and introduced other minor technical updates to reduce complexity. We have worked closely with users during the testing period, and with their positive feedback, we are excited to be making the switch.” All the upgrades to our systems are live with immediate effect.