mreaves Posted September 7 Share Posted September 7 2 hours ago, Baroclinic Zone said: I speculate there will be lot of wish casting, meltdowns, and season cancellations. So a normal winter? 3 4 1 Link to comment Share on other sites More sharing options...
JACKASS Posted September 7 Share Posted September 7 2 hours ago, mreaves said: So a normal winter? In here anyway. Link to comment Share on other sites More sharing options...
MJO812 Posted September 8 Share Posted September 8 1 Link to comment Share on other sites More sharing options...
MJO812 Posted September 8 Share Posted September 8 Mike Masco THE EARLY WINTER MODEL SIGNALS ARE GETTING VERY INTERESTING... I know, I know... WAY too early! But we've reached the point in the forecast calendar where I start looking at the broader trends in the CFSv2 to see what type of atmospheric configuration the models are beginning to latch onto. This is NOT the time to start predicting snowfall totals or declaring the winter warm or cold. Instead, I'm watching three major players at the 500mb and 1000mb levels that could eventually shape how this winter unfolds: GREENLAND BLOCKING — OR LACK THEREOF Where does blocking develop, and is it focused west or east of Greenland? This is one of the biggest variables for the East Coast. A favorable blocking pattern can slow storms near the coast while helping cold Canadian air press south. This signal often isn't fully realized until we're already entering or exiting a blocking cycle, and its impact will be closely tied to the strength and behavior of the Polar Vortex. This becomes especially important from late December through mid-February. THE ALEUTIAN / NORTH PACIFIC PATTERN I'm watching whether the height field near the Aleutian Islands trends stronger or weaker. This signal should become much clearer by late November and can have major implications for how much Pacific air floods into the country. A stronger Pacific influence could overwhelm the northern half of the U.S. with milder-than-normal air — something I'll be watching VERY closely. THE SUBTROPICAL JET — THE BIG ONE So far, this has been the most compelling signal and exactly the type of feature you'd expect during an El Niño winter. You can have all the cold air in the world, but you can't get a snowstorm without moisture. A juiced-up subtropical jet could provide plenty of storm opportunities this winter. Right now, I think this is the major wildcard for producing some BIG storms, potentially favoring the Ohio Valley into western Pennsylvania, with the strongest signal across the southern U.S. The million-dollar question for the Northeast: Can the cold air meet the moisture at the right time? That's where Greenland blocking, the Polar Vortex and the Canadian pattern become incredibly important. Again — this is NOT a winter forecast. It's an early look at the atmospheric players I'm watching as the pieces slowly begin to come together. Plenty will change between now and December... but the early signals are certainly worth watching. 1 2 1 1 Link to comment Share on other sites More sharing options...
CoastalWx Posted September 8 Share Posted September 8 Can anyone other than Ray post realistic non-fantasy discussions about weather vs having their hands glide across the keyboard directed by their weenie? Good God. 1 2 2 Link to comment Share on other sites More sharing options...
FXWX Posted September 8 Share Posted September 8 2 minutes ago, CoastalWx said: Can anyone other than Ray post realistic non-fantasy discussions about weather vs having their hands glide across the keyboard directed by their weenie? Good God. Ain't that the sad truth!!! 2 2 Link to comment Share on other sites More sharing options...
CoastalWx Posted September 8 Share Posted September 8 I guess the NYC on south peeps probably have 15-16 and 82-83 visions dancing in their heads and sure there is some truth to that. But you can’t rule out a 97-98 either. I saw Mike’s graphics from that post and you could also go the other way and say how that’s not good. I just wish people would give arguments as to why both things can occur vs all snow all the time. 1 Link to comment Share on other sites More sharing options...
Damage In Tolland Posted September 8 Share Posted September 8 33 minutes ago, CoastalWx said: I guess the NYC on south peeps probably have 15-16 and 82-83 visions dancing in their heads and sure there is some truth to that. But you can’t rule out a 97-98 either. I saw Mike’s graphics from that post and you could also go the other way and say how that’s not good. I just wish people would give arguments as to why both things can occur vs all snow all the time. I’ve been posting maps and reasons why it will not be a good winter and why folks should expect an abysmal season 1 Link to comment Share on other sites More sharing options...
stadiumwave Posted September 8 Share Posted September 8 Just a freaking nutty look!! Paul Roundy's 100 day low pass analog constructed analog for end of JAN Link to comment Share on other sites More sharing options...
CoastalWx Posted September 8 Share Posted September 8 2 minutes ago, stadiumwave said: Just a freaking nutty look!! Paul Roundy's 100 day low pass analog constructed analog for end of JAN That 200mb? Kind of a noisy graphic there. 1 Link to comment Share on other sites More sharing options...
stadiumwave Posted September 8 Share Posted September 8 26 minutes ago, CoastalWx said: That 200mb? Kind of a noisy graphic there. Yes https://www.atmos.albany.edu/facstaff/roundy/waves/analogs/analogslp.html Link to comment Share on other sites More sharing options...
40/70 Benchmark Posted September 9 Author Share Posted September 9 7 hours ago, stadiumwave said: Yes https://www.atmos.albany.edu/facstaff/roundy/waves/analogs/analogslp.html Why isn't it H5? 200mb is somewhat less helpful. 1 Link to comment Share on other sites More sharing options...
40/70 Benchmark Posted September 9 Author Share Posted September 9 Pretty nice look for a time in mid January, as that ridge lists northward for a bit. 1 1 Link to comment Share on other sites More sharing options...
CoastalWx Posted September 9 Share Posted September 9 55 minutes ago, 40/70 Benchmark said: Why isn't it H5? 200mb is somewhat less helpful. Yeah agree. You can’t tell a whole lot there. Link to comment Share on other sites More sharing options...
40/70 Benchmark Posted September 9 Author Share Posted September 9 11 minutes ago, CoastalWx said: Yeah agree. You can’t tell a whole lot there. That is so odd...I mean, it can help to determine how favorable the set up is for a phase, and/or to come up the coast...but need H5. Link to comment Share on other sites More sharing options...
Go Kart Mozart Posted September 9 Share Posted September 9 It seems that AI has solved Navier-Stokes. Will this have practical implications for forecasting? Link to comment Share on other sites More sharing options...
40/70 Benchmark Posted September 9 Author Share Posted September 9 30 minutes ago, Go Kart Mozart said: It seems that AI generated content has caused me to Stroke it. Will this have practical implications for forecasting? I would say not, but perhaps a bit around P Town. Link to comment Share on other sites More sharing options...
forkyfork Posted September 9 Share Posted September 9 warm and rainy 1 Link to comment Share on other sites More sharing options...
forkyfork Posted September 9 Share Posted September 9 many people are calling this the easiest long range forecast of all time Link to comment Share on other sites More sharing options...
40/70 Benchmark Posted September 9 Author Share Posted September 9 18 hours ago, Newman said: I haven't been active in this thread so apologize if it's already been shared before, but Dr. Jonathan Wall has a great project developed on his website at https://snow.wall.cloud/ You can dive really deep into and compare statistical significance of various teleconnections for a few different snowfall criteria (i.e. trace of snow at 10% or more of stations, 25% of stations measuring 0.1" or more snow, total event coverage or magnitude of snow totals, etc), and all of this broken down by NWS CWAs. But what's neat is you can also break it down further with these various teleconnections during El Nino, neutral, and La Nina. Here is an example between BOX and PHL CWAs in an El Nino winter for the PNA. The PHL CWA leans towards/favors +PNA for number of qualifying days with at least 25% of stations measuring snow. Meanwhile, BOX weakly leans towards/favors -PNA. The numbers on the maps are all absolute differences between percentages. Of course, the caveat is that there are some outliers in both situations and it's not consistent amongst all measurable snowfall days. In fact (and you can find this on the website) the most statistically significant teleconnection is a -EPO across both CWAs (most significant when selecting "all winters" and not just separating out ENSO): Here is another example but with QBO during El Nino just for shits and giggles. PHL actually leans towards +QBO for number of qualifying days with measurable snow at 25% of eligible stations (I'll have to look into the details of the data here, I wonder if there's some bias from big dogs that formed during +QBO/+ENSO seasons) and eastern BOX leans towards -QBO but western BOX leans towards +QBO. Again, very very important to note this is not gospel and there are outliers that prove snowstorms can happen in either phase of QBO. Either way, cool website and wanted to share. All of the details should be there on the site. From the site: "This is a descriptive historical phase comparison: each DJF winter is grouped by its mean index phase. Red favors positive phase, blue negative. The shading estimates the station-rate pattern between qualified stations." @ORH_wxman @CoastalWx Check this site out....nice site for a quick and easy guide on pattern diagnostics. Nothing new to us, but it helps to illustrate when you feel like a pattern is good, bad or ugly. Link to comment Share on other sites More sharing options...
40/70 Benchmark Posted September 9 Author Share Posted September 9 46 minutes ago, forkyfork said: warm and rainy 45 minutes ago, forkyfork said: many people are calling this the easiest long range forecast of all time You are 100% right as it pertains to the seasonal mean, but I think the trick is to try and focus on when the pattern may stray from said mean. I think that is where the more skilled forecasters have a chance to distinguish themselves. Same thing as if it we have a fall of 2009 type regime....that was a an obvious snow-season for the mid atl leading in, but when are the thaws?? Link to comment Share on other sites More sharing options...
Cobalt Posted September 9 Share Posted September 9 35 minutes ago, forkyfork said: many people are calling this the easiest long range forecast of all time What've you got for the individual months DJF? Link to comment Share on other sites More sharing options...
SethWx Posted September 9 Share Posted September 9 1 hour ago, forkyfork said: warm and rainy 1 hour ago, forkyfork said: many people are calling this the easiest long range forecast of all time gas up the snowblowers folks 2 2 Link to comment Share on other sites More sharing options...
forkyfork Posted September 9 Share Posted September 9 i am so powerful people make whole new accounts just to respond to me 1 1 1 Link to comment Share on other sites More sharing options...
40/70 Benchmark Posted September 9 Author Share Posted September 9 11 minutes ago, forkyfork said: i am so powerful people make whole new accounts just to respond to me Any insight as to potential windows that are less hostile for the east coast? 1 Link to comment Share on other sites More sharing options...
weatherwiz Posted September 9 Share Posted September 9 On 9/7/2026 at 1:40 PM, bristolri_wx said: Any analogs show up with strong El Nino’s with extraordinarily low Atlantic ACE’s the preceding tropical season? I mean all you have to do is look at previous strong EL Nino episodes...they all (I'd presume) had very low ACE seasons. The EL Nino's of 1982-1983 and 1997-1998 only had seasonal numbers in the single digits. 2015-2016 I think was a bit higher but still below the climatological average Link to comment Share on other sites More sharing options...
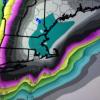
40/70 Benchmark Posted September 9 Author Share Posted September 9 Time to start compiling a sensible weather analog composite....last one prior to the outlook. Link to comment Share on other sites More sharing options...
40/70 Benchmark Posted September 9 Author Share Posted September 9 2018 looks like the early leader in the clubhouse. Link to comment Share on other sites More sharing options...
40/70 Benchmark Posted September 9 Author Share Posted September 9 Use of sensible weather analogs will pose a unique challenge this year given the rapid state of flux throughout the hemisphere....you can't take them at face value. -EPO predominated Winter 2018-2019, so given that this season should have a +EPO, flipping the anomalies may provide some value. Coolest se, warmest high plains. 1 Link to comment Share on other sites More sharing options...
40/70 Benchmark Posted September 9 Author Share Posted September 9 That season may represent a decent proxy for what next year would look like with a weak El Nino. Link to comment Share on other sites More sharing options...


Recommended Posts
Create an account or sign in to comment
You need to be a member in order to leave a comment
Create an account
Sign up for a new account in our community. It's easy!
Register a new accountSign in
Already have an account? Sign in here.
Sign In Now