

donsutherland1
-
Posts
23,987 -
Joined
Content Type
Profiles
Blogs
Forums
American Weather
Media Demo
Store
Gallery
Everything posted by donsutherland1
-
For those who are interested in checking out New York City area records, I created a GPT that can be queried using ChatGPT. That GPT an be found at here.
-
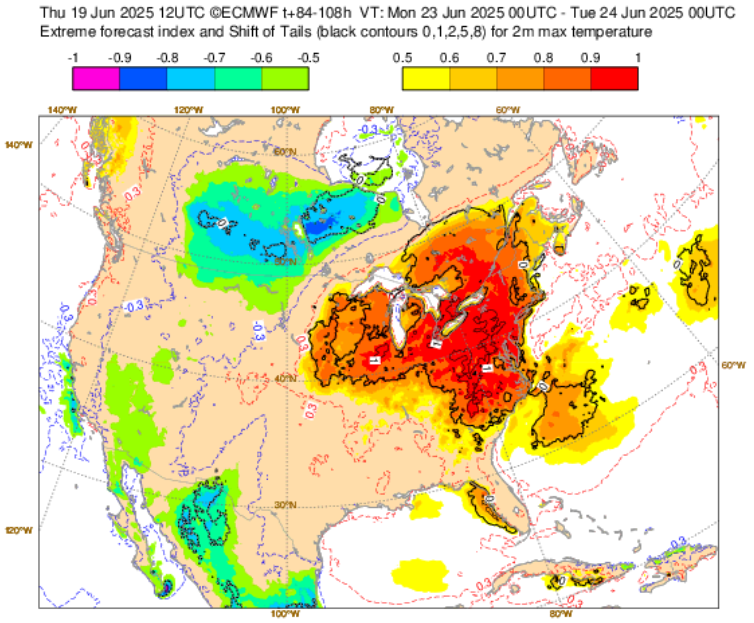
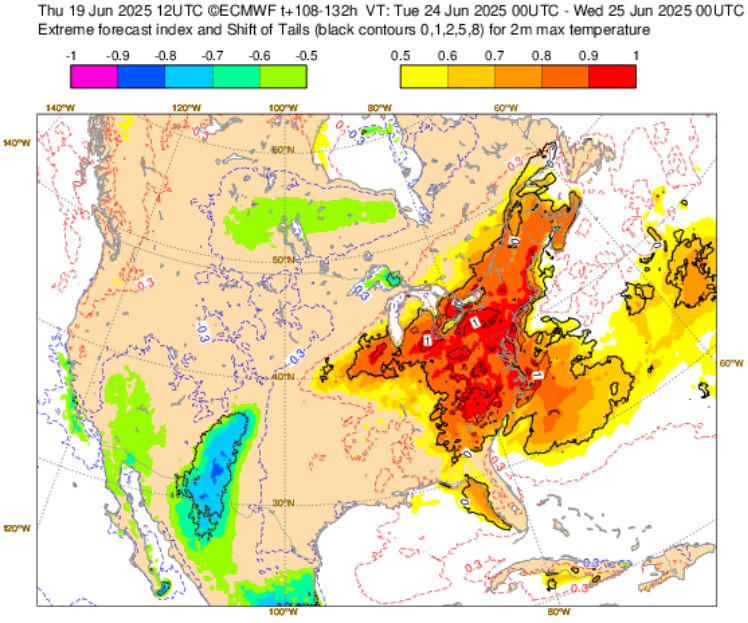
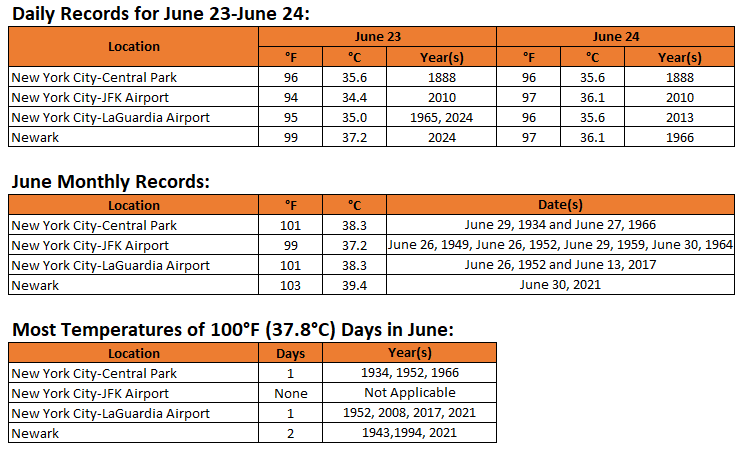
The operational ECMWF and GFS are now in good agreement that daily record temperatures will likely be challenged or broken during June 23-24 across the New York City region. June monthly records could be challenged, as well. EFI for June 23: EFI for June 24: Select Data:
-
A sustained period of above normal temperatures is now underway. Although temperatures will be somewhat cooler than they were today tomorrow and Saturday, the heat will likely come roaring back on Sunday. Excessive heat is likely Monday, Tuesday, and possibly Wednesday Temperatures will likely top out in the lower and middle 90s in the New York City area and upper 90s to lower 100s in the hot spots in New Jersey. There remains some uncertainty about the magnitude of the heat. The ECMWF is showing potential June monthly record heat for parts of the region. The ENSO Region 1+2 anomaly was +0.5°C and the Region 3.4 anomaly was 0.0°C for the week centered around June 11. For the past six weeks, the ENSO Region 1+2 anomaly has averaged +0.30°C and the ENSO Region 3.4 anomaly has averaged -0.05°C. Neutral ENSO conditions will likely continue through at least late summer. The SOI was -13.36 yesterday. The preliminary Arctic Oscillation (AO) was +0.764 today. Based on sensitivity analysis applied to the latest guidance, there is an implied 81% probability that New York City will have a warmer than normal June (1991-2020 normal). June will likely finish with a mean temperature near 73.7° (1.7° above normal).
-
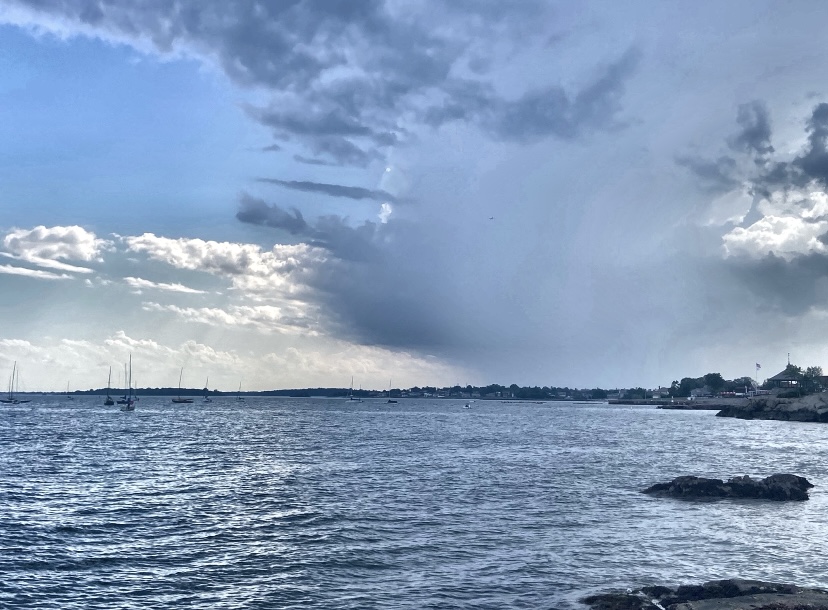
Approaching thunderstorm a short time ago. It was rapidly falling apart.
-
Unfortunately, I don't have such details and I am not aware of their being published. Given where things currently stand, I think its solution is probably somewhat more likely than that on the operational AI. Nevertheless, even at this timeframe, it is subject to errors, so one can't fully rule out more widespread heat.
-
I don't have much expectation that partial privatization or private partnerships would address the structural modeling issue. A model that would be publicly available wouldn't produce high profit margins. Only sustainable competitive advantages requiring exclusivity or near exclusivity in solutions, would command such profit margins. Thus, investments wouldn't be devoted to models per se.
-
Part of the issue lies in the initialization scheme. The top models (ECMWF, GGEM, and UKMET) all use the 4dVar initialization. Some have used it for more than a decade. Despite its demonstrated benefits, it was never integrated in any of the GFS upgrades perhaps because the U.S. lacks sufficient computing capacity. All other things being equal, that puts the model at a disadvantage. Its resolution is also more coarse than that for the leading models. With the disinvestment in the NWS and NOAA now underway, that won't change anytime soon.
-
Assuming things dry out, there could be another opportunity.
-
I expect July and August will both be warmer than normal. The pattern that is now evolving will likely be the dominant pattern this summer. I don't think next week's excessive heat will be the last such outbreak this season.
-
Warmer air began to overspread the region today. This week's warmth will peak tomorrow with temperatures reaching the upper 80s across the region. A few areas could reach or exceed 90°. The arrival of this warmth will mark the start of a sustained period of above normal temperatures. No exceptional heat appears likely through the first three weeks of June. However, that will likely change shortly afterward. Excessive heat is possible starting early next week. Temperatures will likely top out in the lower and middle 90s in the New York City area and upper 90s to lower 100s in the hot spots in New Jersey. There remains some uncertainty about the magnitude of the heat. The ENSO Region 1+2 anomaly was +0.5°C and the Region 3.4 anomaly was 0.0°C for the week centered around June 11. For the past six weeks, the ENSO Region 1+2 anomaly has averaged +0.30°C and the ENSO Region 3.4 anomaly has averaged -0.05°C. Neutral ENSO conditions will likely continue through at least late summer. The SOI was -4.36 yesterday. The preliminary Arctic Oscillation (AO) was +1.248 today. Based on sensitivity analysis applied to the latest guidance, there is an implied 71% probability that New York City will have a warmer than normal June (1991-2020 normal). June will likely finish with a mean temperature near 73.5° (1.5° above normal).
-
At present, I suspect that the most plausible outcome is lower to middle 90s in NYC and upper 90s/near 100 in the hot spots in NJ. Some onshore flow will probably keep the truly extreme heat at bay.
-
Warmer air will move into the region for tomorrow. The temperature will apporach or reach 80° in New York City. This week's warmth will peak on Thursday with temperatures reaching the upper 80s across the region. A few areas could reach or exceed 90°. The arrival of this warmth will mark the start of a sustained period of above normal temperatures. No exceptional heat appears likely through the first three weeks of June. However, that will likely change shortly afterward. Excessive heat is possible starting early next week. The magnitude of the heat remains to be resolved among the guidance. The ENSO Region 1+2 anomaly was +0.5°C and the Region 3.4 anomaly was 0.0°C for the week centered around June 11. For the past six weeks, the ENSO Region 1+2 anomaly has averaged +0.30°C and the ENSO Region 3.4 anomaly has averaged -0.05°C. Neutral ENSO conditions will likely continue through at least late summer. The SOI was -7.94 yesterday. The preliminary Arctic Oscillation (AO) was +1.216 today. Based on sensitivity analysis applied to the latest guidance, there is an implied 77% probability that New York City will have a warmer than normal June (1991-2020 normal). June will likely finish with a mean temperature near 73.7° (1.7° above normal).
-
It will become somewhat warmer tomorrow with highs reaching the lower 70s. By Wednesday, the mercury will likely reach 80°. A sustained period of above normal temperatures will then develop by midweek. No exceptional heat appears likely through the first three weeks of June. However, that could change shortly afterward if some of the extended range guidance is correct. Excessive heat is possible starting early next week. The ENSO Region 1+2 anomaly was +0.5°C and the Region 3.4 anomaly was 0.0°C for the week centered around June 11. For the past six weeks, the ENSO Region 1+2 anomaly has averaged +0.30°C and the ENSO Region 3.4 anomaly has averaged -0.05°C. Neutral ENSO conditions will likely continue through at least late summer. The SOI was -12.72 yesterday. The preliminary Arctic Oscillation (AO) was +0.731 today. Based on sensitivity analysis applied to the latest guidance, there is an implied 69% probability that New York City will have a warmer than normal June (1991-2020 normal). June will likely finish with a mean temperature near 73.5° (1.5° above normal).
-
106.
-
Tomorrow will be another cool day for the season. The temperature top out in the upper 60s to around 70°. It will be somewhat warmer on Tuesday with highs reaching the lower 70s. By Wednesday, the mercury will likely reach 80°. A sustained period of above normal temperatures will likely develop by midweek. No exceptional heat appears likely through the first three weeks of June. However, that could change shortly afterward if some of the extended range guidance is correct. The ENSO Region 1+2 anomaly was +0.4°C and the Region 3.4 anomaly was 0.0°C for the week centered around June 4. For the past six weeks, the ENSO Region 1+2 anomaly has averaged +0.23°C and the ENSO Region 3.4 anomaly has averaged -0.07°C. Neutral ENSO conditions will likely continue through at least mid summer. The SOI was -3.16 yesterday. The preliminary Arctic Oscillation (AO) was +0.402 today. Based on sensitivity analysis applied to the latest guidance, there is an implied 66% probability that New York City will have a warmer than normal June (1991-2020 normal). June will likely finish with a mean temperature near 73.3° (1.3° above normal).
-
Tomorrow will be another very cool day for the season. The temperature will top out in the middle and upper 60s. It will gradually warm up on Monday and Tuesday. By Wednesday, the mercury could reach 80°. No exceptional heat appears likely through the first three weeks of June. However, a sustained peirod of above normal temperatures could develop starting late next week. The ENSO Region 1+2 anomaly was +0.4°C and the Region 3.4 anomaly was 0.0°C for the week centered around June 4. For the past six weeks, the ENSO Region 1+2 anomaly has averaged +0.23°C and the ENSO Region 3.4 anomaly has averaged -0.07°C. Neutral ENSO conditions will likely continue through at least mid summer. The SOI was +0.42 yesterday. The preliminary Arctic Oscillation (AO) was -0.149 today. Based on sensitivity analysis applied to the latest guidance, there is an implied 60% probability that New York City will have a warmer than normal June (1991-2020 normal). June will likely finish with a mean temperature near 73.0° (1.0° above normal).
-
It should become drier.
-
It will turn noticeably cooler for the weekend with temperatures reaching only the upper 60s in New York City. Showers and periods of rain are also likely during the weekend, especially Saturday afternoon and Sunday. Rainfall amounts will generally be light with most of the region seeing 0.25" or less rainfall. A few of the wetter spots could see around 0.50" of rain. No exceptional heat appears likely through the first three weeks of June. However, a sustained peirod of above normal temperatures could develop starting late next week. The ENSO Region 1+2 anomaly was +0.4°C and the Region 3.4 anomaly was 0.0°C for the week centered around June 4. For the past six weeks, the ENSO Region 1+2 anomaly has averaged +0.23°C and the ENSO Region 3.4 anomaly has averaged -0.07°C. Neutral ENSO conditions will likely continue through at least mid summer. The SOI was -0.77 yesterday. The preliminary Arctic Oscillation (AO) was -0.528 today. Based on sensitivity analysis applied to the latest guidance, there is an implied 56% probability that New York City will have a warmer than normal June (1991-2020 normal). June will likely finish with a mean temperature near 72.9° (0.9° above normal).
-
Not this weekend but probably not far off. Maybe the following weekend or the last weekend in June. That assumes the pattern will evolve as I expect.
-
Following today's warmth, tomorrow will be somewhat cooler. Temperatures will top out near 80°. It will turn noticeably cooler for the weekend with temperatures reaching only the upper 60s and lower 70s in New York City. Showers and periods of rain are also likely during the weekend, especially Saturday afternoon and Sunday. Rainfall amounts will generally be light with most of the region seeing 0.25" or less rainfall. No exceptional heat appears likely through the first three weeks of June. However, a sustained peirod of above normal temperatures could develop starting late next week. The ENSO Region 1+2 anomaly was +0.4°C and the Region 3.4 anomaly was 0.0°C for the week centered around June 4. For the past six weeks, the ENSO Region 1+2 anomaly has averaged +0.23°C and the ENSO Region 3.4 anomaly has averaged -0.07°C. Neutral ENSO conditions will likely continue through at least mid summer. The SOI was -5.27 yesterday. The preliminary Arctic Oscillation (AO) was -0.172 today. Based on sensitivity analysis applied to the latest guidance, there is an implied 61% probability that New York City will have a warmer than normal June (1991-2020 normal). June will likely finish with a mean temperature near 73.1° (1.1° above normal).
-
Tomorrow will be the warmest day of the week with the mercury rising into the upper 80s across much of the region. The warmest spots will likely reach or exceed 90°. Friday will see temperatures top out near 80°, but it will turn cooler for the weekend. Shower and periods of rain are also likely during the weekend, especially Saturday afternoon and Sunday. Sunday will likely be particularly cool with the high temperature struggling to reach 70° in New York City and many areas around the City staying in the upper 60s. Rainfall amounts will generally be light with most of the region seeing 0.25"-0.50" of rain. No exceptional heat appears likely through the first three weeks of June. The ENSO Region 1+2 anomaly was +0.4°C and the Region 3.4 anomaly was 0.0°C for the week centered around June 4. For the past six weeks, the ENSO Region 1+2 anomaly has averaged +0.23°C and the ENSO Region 3.4 anomaly has averaged -0.07°C. Neutral ENSO conditions will likely continue through at least mid summer. The SOI was -7.59 yesterday. The preliminary Arctic Oscillation (AO) was +0.658 today. Based on sensitivity analysis applied to the latest guidance, there is an implied 59% probability that New York City will have a warmer than normal June (1991-2020 normal). June will likely finish with a mean temperature near 73.0° (1.0° above normal).
-
It will turn noticeably warmer tomorrow with temperatures rising into the lower and middle 80s across the region. Thursday will be the warmest day of the week with the mercury rising into at least the upper 80s. A few of the warmer spots could reach 90°. Friday will see temperatures top out near 80°, but it will turn cooler for the weekend. No exceptional heat appears likely through mid-month. The ENSO Region 1+2 anomaly was +0.4°C and the Region 3.4 anomaly was 0.0°C for the week centered around June 4. For the past six weeks, the ENSO Region 1+2 anomaly has averaged +0.23°C and the ENSO Region 3.4 anomaly has averaged -0.07°C. Neutral ENSO conditions will likely continue through at least mid summer. The SOI was -7.59 today. The preliminary Arctic Oscillation (AO) was +1.276 today. Based on sensitivity analysis applied to the latest guidance, there is an implied 61% probability that New York City will have a warmer than normal June (1991-2020 normal). June will likely finish with a mean temperature near 73.2° (1.2° above normal).
-
I agree. I expect above normal rainfall.
-
I think it will be warmer than normal. The predominant pattern will likely develop in late June and then lock into place with some brief cooler periods.
-
Tomorrow will be variably cloudy and warmer. Temperatures will top out in the middle 70s. Some showers or a thundershower are possible, especially during tomorrow afternoon or tomorrow night as a warm front moves across the region. Some of the thunderstorms have the potential to bring heavy downpours. Afterward, it will turn warmer for several days with temperatures rising into the 80s. Thursday will likely be the warmest day of the week with the mercury rising into at least the middle 80s. It will turn cooler for the weekend. No exceptional heat appears likely through mid-month. The ENSO Region 1+2 anomaly was +0.8°C and the Region 3.4 anomaly was -0.1°C for the week centered around May 28. For the past six weeks, the ENSO Region 1+2 anomaly has averaged +0.17°C and the ENSO Region 3.4 anomaly has averaged -0.07°C. Neutral ENSO conditions will likely continue through at least mid summer. The SOI was -5.62 today. The preliminary Arctic Oscillation (AO) was +1.466 today. Based on sensitivity analysis applied to the latest guidance, there is an implied 61% probability that New York City will have a warmer than normal June (1991-2020 normal). June will likely finish with a mean temperature near 73.2° (1.2° above normal).

