donsutherland1
-
Posts
23,987 -
Joined
Content Type
Profiles
Blogs
Forums
American Weather
Media Demo
Store
Gallery
Everything posted by donsutherland1
-
Tthe two consecutive 102° highs at JFK Airport (June 24-25, 2025) is only the second such streak on record there. The only other streak occurred during July 22-23, 2011.
-
JFK: 100
-
New Haven has reached 95°. June 24-25, 2025 is the only case where New Haven has seen 2 consecutive such days. The June monthly record is 96°, which was set June 17, 1957 and tied yesterday.
-
It will be a close call. Some of the guidance keeps the low at or above 80.
-
Following yesterday's June monthly record-tying 96F (35.6C) high, New Haven has reached 90F (32.2C) for the 4th consecutive day, breaking the June mark of 3 days from June 20-22, 2012 & June 28-30, 2021. The prior earliest such streak occurred during July 4-7, 2010.
-
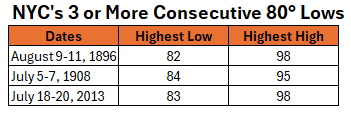
Historical tidbit while temperatures climb. Since 1869, Central Park has had 39 days with low temperatures of 81° or above. All 39 days had highs of 90° or above. The lowest high occurred on July 3, 1876 when the low was 81° and the high was 90°.
-
Islip has reached 90F (32.2C) for the 4th consecutive day. That ties the record for the longest June heatwave. That record was set during June 24-27, 2003. The current heatwave is the earliest 4-day one on record.
-
June 25-28 was in 1963. I typed the wrong date.
-
Yes. EWR, JFK, and LGA all hit 100 or above. Central Park didn't.
-
No. It was 1984. The highs on June 8-11, 1984 were 90, 96, 93, 93.
-
There was no air conditioning back then and some of the nights were brutally warm, too.
-
JFK Airport has reached 90F (32.2C) for the 4th consecutive day. That ties the record for the longest June heatwave. The record was set during June 25-28, 1963 and tied during June 8-11, 1984 and June 24-27, 2003.
-
None of the three prior streaks had a 100° or above high.
-
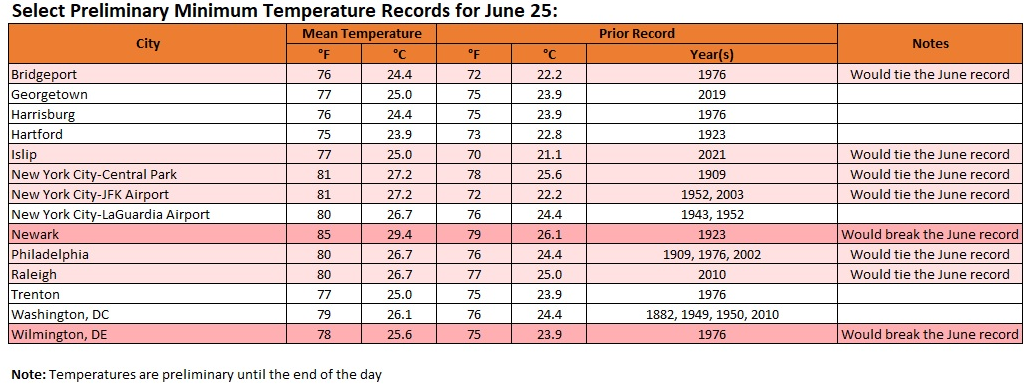
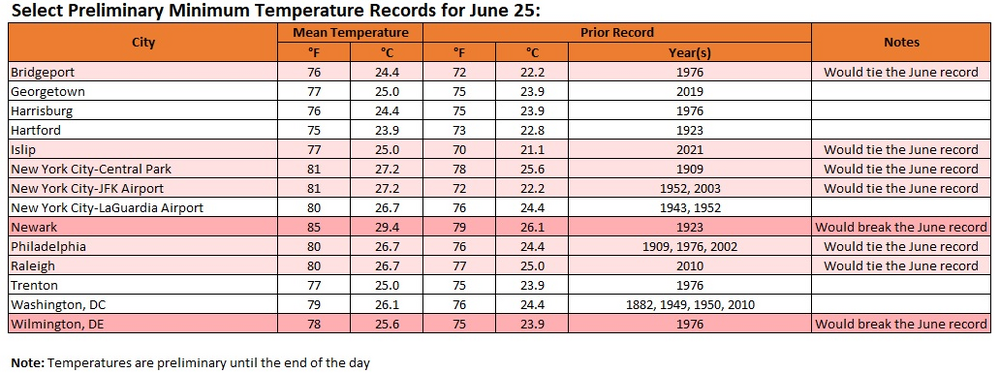
Preliminary overnight lows for June 25:
-
Newark is on track to have its earliest stretch of 3 consecutive 80F (26.7C) or above lows on record. The existing record was set during July 8-10, 1993.
-
New York City (Central Park) is on track to have its earliest stretch of 3 consecutive 80F (26.7C) or above lows on record. The existing record was set during July 5-8, 1908.
-
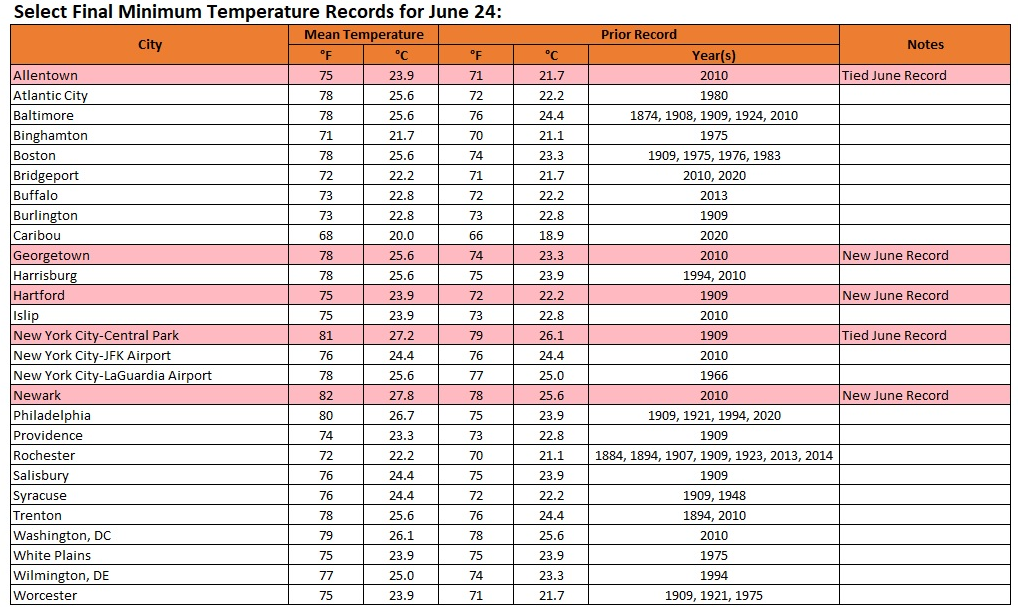
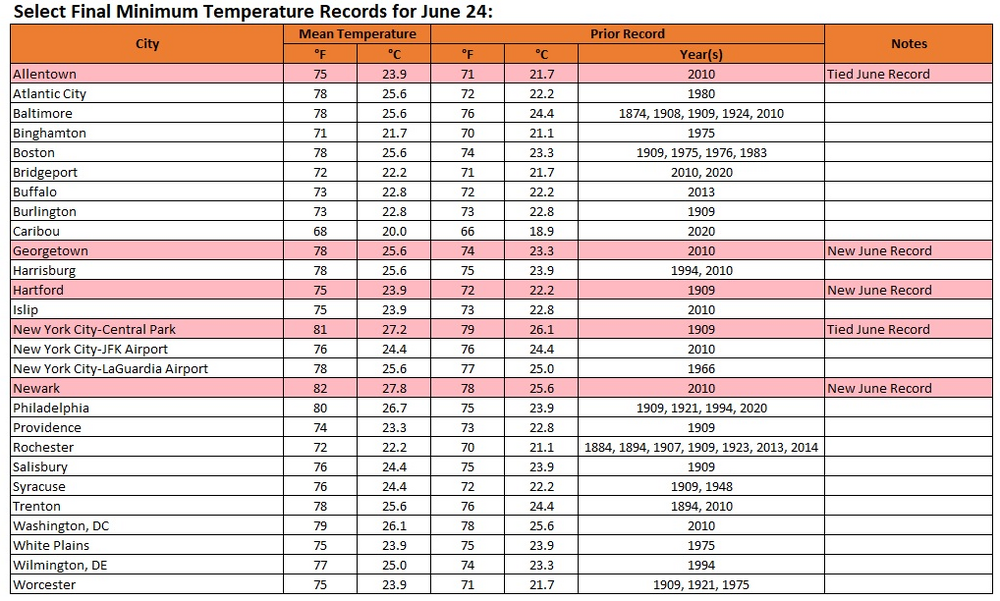
Yesterday's final low temperatures:
-
Today’s mean of 90.0 was the earliest such mean on record at Central Park. The old record was June 26, 1952. In addition, the low of 81 was the highest on record for a 99 high. The old mark of 80 was set on August 14, 1988 and tied on August 13, 2005.
-
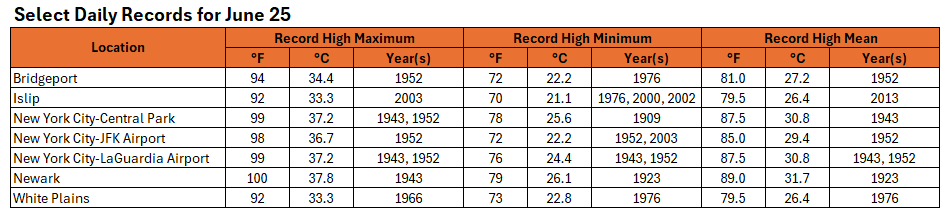
Tomorrow's records. Some areas could approach or set daily record highs.
-
This was unprecedented heat for June.
-
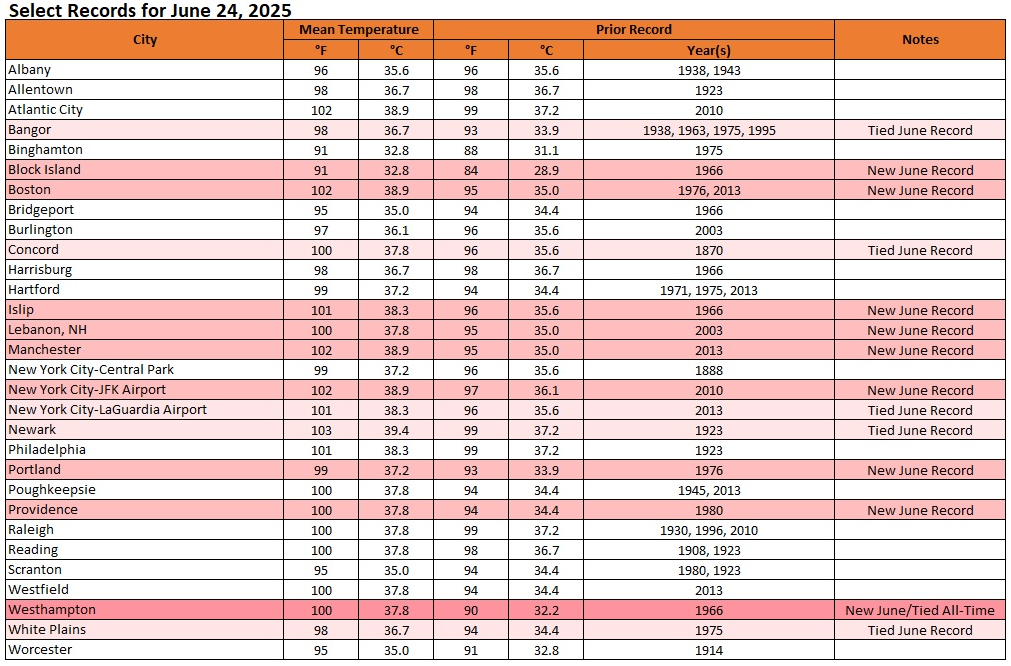
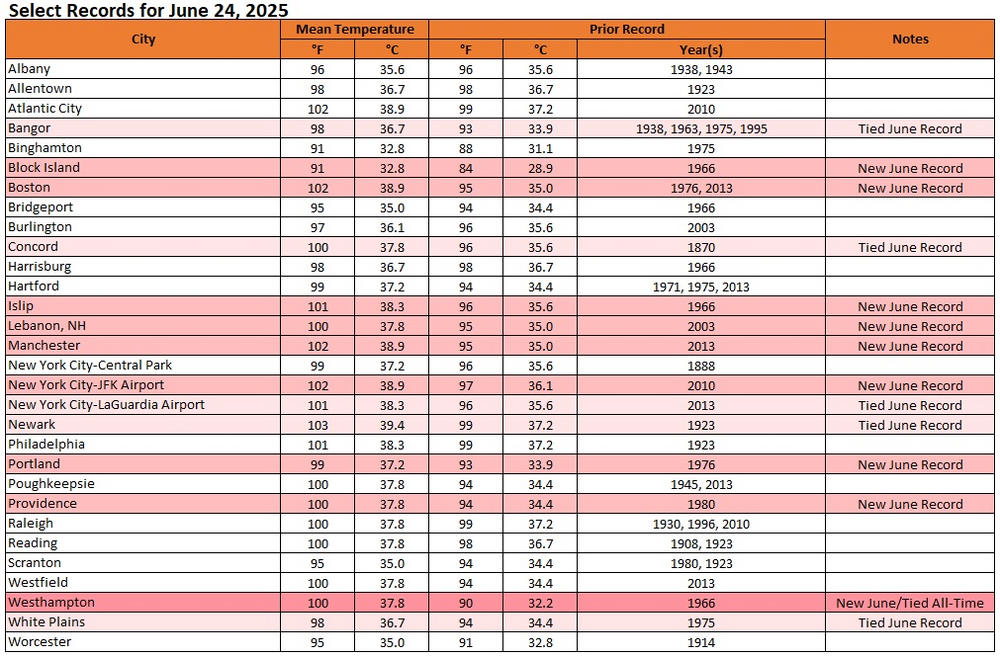
The hottest June day on record in the Northeastern U.S. is now concluding. Numerous monthly records were tied or broken. Select records from today:
-
The final high was 98.
-
Perhaps. All other 8 cases were before that.
-
Today was the 10th time Newark, LaGuardia, and JFK reached 100 or above. Today was just the second time Central Park did not reach 100 or above on those days. The first such occurrence was July 18, 2013.
-
We should have the final figure around 8 pm.