donsutherland1
-
Posts
24,327 -
Joined
Content Type
Profiles
Blogs
Forums
American Weather
Media Demo
Store
Gallery
Everything posted by donsutherland1
-
2025-2026 ENSO
donsutherland1 replied to 40/70 Benchmark's topic in Weather Forecasting and Discussion
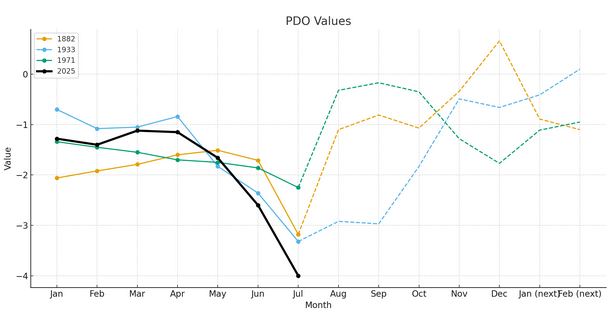
At some point, rising minimum temperatures matter. Here's the data for NYC: At present, I don't believe cities such as Caribou, Boston, Detroit, Montreal, Ottawa, and Toronto are in transition to structurally lower seasonal snowfall. That's probably one or more decades down the road, with the longest delay of any transition for Caribou, Montreal, Ottawa, and Toronto unless precipitation patterns change significantly e.g., winters become much drier (not shown on the climate modeling). In the meantime, back to the focus of the thread, I suspect that we'll see a weak La Niña that fades fairly quickly (weak-to-moderate RONI), PDO-, QBO-. Statistically, 1882, 1933, and 1971 are good PDO matches. The general idea is that the PDO would be negative for the winter but not as severely negative as at present. Statistically, 2014 might be the best QBO analog.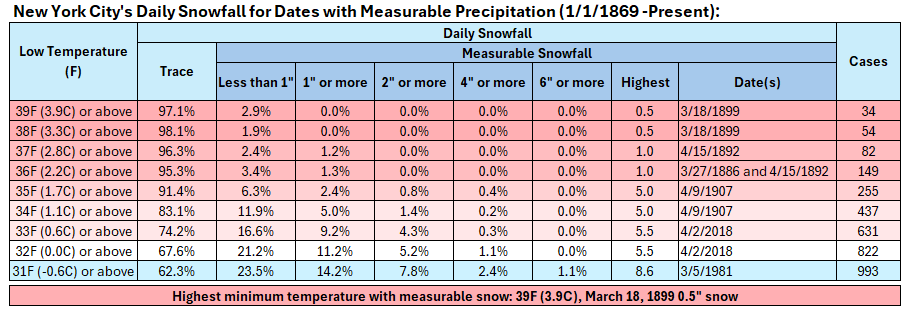
-
2025-2026 ENSO
donsutherland1 replied to 40/70 Benchmark's topic in Weather Forecasting and Discussion
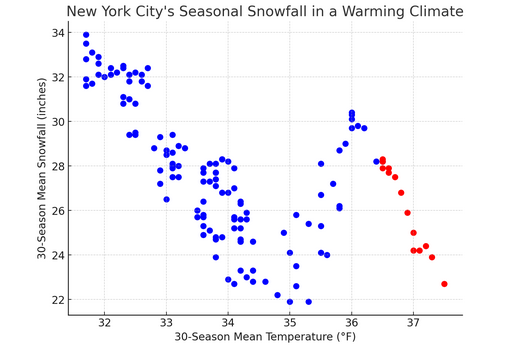
The persisent La Niña state is an important factor. Statistically, the odds of sufficiently cold winters have declined quite a bit. Even with last winter, the warmth was sufficiently great the the historic probability of a 50" season was very low. By the 2040s (maybe earlier if warming is greater than expected) it's possible that 50" winters will be all but gone with 40" winters becoming as rare as 50" winters. I suspect part of the explosive rise in snowfall during the early 2000s through 2015-16 had as much to do with the benefits of increased moisture temporarily exceeding the impact of warming winters. However, my guess is that NYC has now passed the point where the impact of additional warming now exceeds the benefits of increased moisture. That pattern was present in Washington, DC, which has experienced a structural decline in seasonal snowfall. Given New York City's higher latitude (closer proximity to cold air sources), a sharper initial rise makes sense. But this is how things might play out, if the City is in the early stages of a structural decline in seasonal snowfall under slow winter warming (where 40° winters remain relatively uncommon until around 2040). Red dots are the 30-season averages for 2025-26 through 2039-40. Stronger winter warming could bring the 30-season average near or below 20" by the mid-2030s. Internal variability will exist, so there will still be snowy winters. There will also be more frequent duds with less than 10" seasonal snowfall. The back-to-back < 10" winters of 2022-23 and 2023-24 were perhaps a "warning shot" from a future warmer winter climate.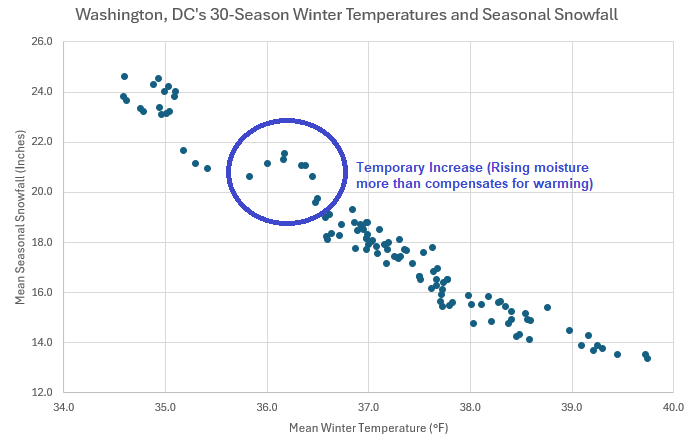
-
September 2025 OBS-Discussion centered NYC subforum
donsutherland1 replied to wdrag's topic in New York City Metro
At this lead time, August looked warmer than normal and the number of lows in the 50s that we've seen was almost inconceivable. There's no guarantee that the temperature will fall into the 40s next month, but even a short but sharp push of cold air that wouldn't necessarily show up in the weeklies, can't be ruled out during the second half of the month. Weekly forecasts lose skill beyond two weeks. Daily forecasts are unreliable beyond even 7-10 days. It would be interesting to examine how the daily numbers for September fare vs. climatology. -
The coolest air mass so far this season will move into the region tonight. As a result, this weekend will see low temperatures fall into the 50s in New York City with some 40s in the colder suburbs. Highs will generally reach the middle and upper 70s. Generally cool and dry conditions will persist into next week. A system could bring at least some rain during or after the middle of next week. The ENSO Region 1+2 anomaly was -0.1°C and the Region 3.4 anomaly was -0.4°C for the week centered around August 20. For the past six weeks, the ENSO Region 1+2 anomaly has averaged +0.45°C and the ENSO Region 3.4 anomaly has averaged -0.28°C. Neutral ENSO conditions will likely continue into early autumn. The SOI was +19.60 today. The preliminary Arctic Oscillation (AO) was +0.815 today. Based on sensitivity analysis applied to the latest guidance, there is an implied near 100% probability that New York City will have a cooler than normal August (1991-2020 normal). August will likely finish with a mean temperature near 73.6° (2.5° below normal). That would make August 2005 the coolest August since 2000. Supplemental Information: The projected mean would be 1.6° below the 1981-2010 normal monthly value.
-
2025-2026 ENSO
donsutherland1 replied to 40/70 Benchmark's topic in Weather Forecasting and Discussion
In terms of 50" or more seasonal snowfall at New York City, one would typically need a winter colder than last winter was in order to have a reasonable shot. I looked at NYC (Central Park) 50" or above winters and winters from a larger set of sites from Washington, DC to Bridgeport. Only a single winter had a mean temperature at or above last winter's figure (Winter 2009-10 in Washington, DC). Below is the distribution of winters with 50" or more season,al snowfall and mean winter temperatures, along with the coldest and warmest such winters.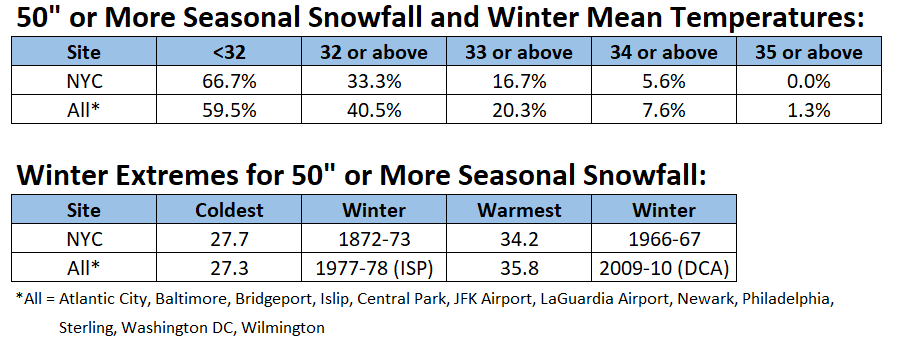
-
2025-2026 ENSO
donsutherland1 replied to 40/70 Benchmark's topic in Weather Forecasting and Discussion
While I suspect that a transition toward structurally lower snowfall is underway from a warming climate, there is a lot of internal variability involved with seasonal snowfall. By the mid-2030s, if the structural decline is underway, Central Park would likely see its 30-season moving average reach or fall below 20" per year. In the meantime, here are some records for seasonal snowfall droughts: Most consecutive seasons with < 10": 2, 2022-23 through 2023-24 Most consecutive seasons with < 20": 6, 1949-50 through 1954-55 Most consecutive seasons with < 30": 15, 1978-79 through 1992-93 Note: There were some big storms during the 15-season snow drought, i.e., the 1979 President's Day snowstorm, the 1983 Megalopolis Blizzard, and the 1993 superstorm. Finally, although they are not common, there have been some very cold winters with low snowfall. Winter 1900-01 had a mean temperature of 31.9° with seasonal snowfall of just 9.1". Winter 1871-72 had a mean temperature of 29.4° with seasonal snowfall of 14.4". Overall, there have been five winters with a winter mean temperature < 32° with less than 20" of snow. Below is a scatter diagram of all winters. Cold/Dry winters are highlighted in red. Winters 2021-22 through 2024-25 are highlighted in brown.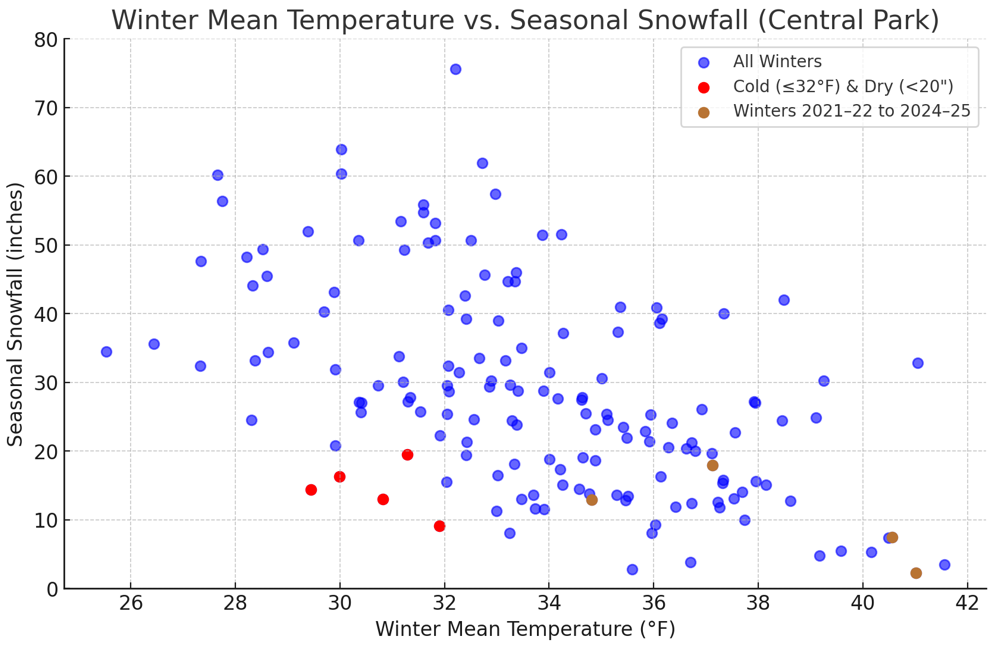
-
2025-2026 ENSO
donsutherland1 replied to 40/70 Benchmark's topic in Weather Forecasting and Discussion
For purposes of analysis, I compared the Winter 2009-10 through 2014-15 period to the Winter 2021-22 through 2024-25 period on a standardized basis. In terms of average deviation, the snowier set was 0.95 standard deviations above the historic winter 1869-70 through 2024-25 baseline. The latter set was an average of 1.20 standard deviations below the baseline. Winter 2011-12 was the culprit that reduced the average deviation from normal for the snowy winters. Excluding that winter, the average deviation would have been 1.41 standard deviations from the historic baseline. Note: These are Central Park figures. -
September 2025 OBS-Discussion centered NYC subforum
donsutherland1 replied to wdrag's topic in New York City Metro
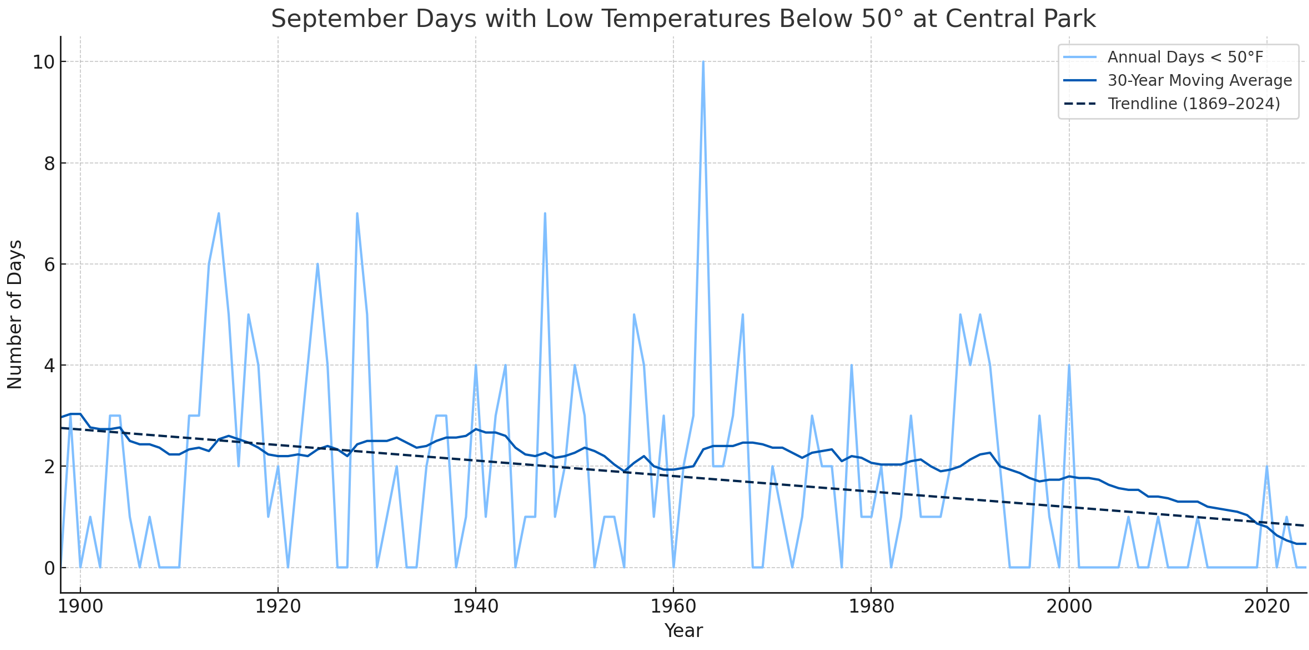
As September increasingly becomes an extension of summer, New York City has been experiencing a long-term decline in cases where September's coldest temperatures have fallen into the 40s. During 1961-1990, 83.3% of Septembers saw one or more lows in the 40s. September averaged 2.1 such days. During the current 1991-2020 baseline, just 33.3% of Septembers have seen lows in the 40s and the annual September average has plunged to 0.8 days per year. The last time the temperature fell below 50° in September was September 24, 2022 when the mercury dipped to 49°. A strong argument can be made that September 2025 could buck that trend and experience one or more lows in the 40s. Based on the 8/29 12z NBM, August 20-31 will finish with five days with low temperatures falling below 60° at New York City's Central Park. The forecast lows for August 30 and 31 are 57° and 59° respectively. That would be the most such days since there were five days in 1987. The last time there were more was in 1946 when there were six. The record of eight days was set during August 20-31, 1940. Since record-keeping began in 1869, there were 16 cases when August 20-31 had five or more lows in the 50s and 81.3% of those cases saw one or more lows in the 40s during September. The figure for all other years was 65.7% of cases. Both cases with five or more days since 1980 (1986 and 1987) saw the lowest September temperatures fall into the 40s. The most recent year when August 20–31 had five or more lows in the 50s, but no September lows in the 40s, was 1934 when the monthly minimum temperature was 51°. In a city where concrete holds the heat and the climate grows steadily warmer, the return of a truly crisp September morning has become an increasingly uncommon and fleeting gift. Yet all signs suggest that September 2025 may break from recent tradition and deliver a breath from a vanishing earlier New York climate.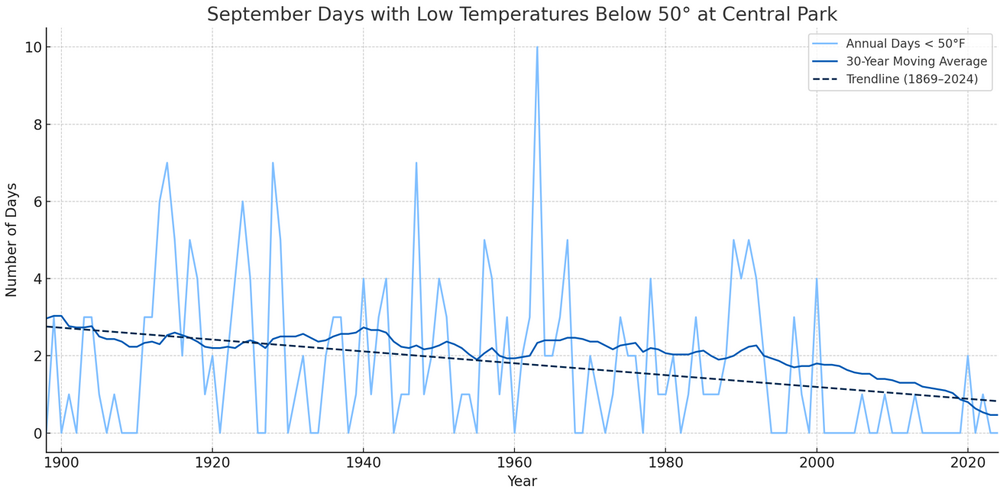
-
Occasional Thoughts on Climate Change
donsutherland1 replied to donsutherland1's topic in Climate Change
Wildfires in Turkey, Greece, and Cyprus this summer scorched more than a million hectares, displaced tens of thousands, and claimed at least 20 lives. Researchers with the World Weather Attribution group determined that climate change made the blazes 13 times more likely and up to 22 percent more intense than they would have been in pre-industrial conditions. Prolonged heat, parched soils, and shifting winds created a tinderbox environment, pushing fire behavior well beyond historical norms. Specifically, the attribution study found: To determine the role of climate change in this observed trend we combine the observation-based estimates with climate models. For both indices the models on average show a stronger increase in likelihood and intensity than observed. This leads to an overall increase in VPD7x of a factor of about 13 and an increase in intensity of about 18% attributable to human-induced climate change. For DSR the overarching increase in likelihood due to climate change is a factor 10 and an increase in intensity of about 22%. -
It was. It would be great to have a winter similar to it in the midst of our ongoing seasonal snowfall drought.
-
Most Recent Year when June was Warmer than August: 2008: Bridgeport, Islip, New York City-Central Park, New York City-LaGuardia Airport, White Plains 2024: Newark Largest Margin when June was Warmer than August: Bridgeport: 1.6°, 1957 (June: 71.6°; August: 70.0°) Islip: 0.8°, 1994 (June: 71.3°; August: 70.5°) New York City-Central Park: 3.5°, 1883 (June: 73.4°; August: 69.9°) New York City-LaGuardia Airport: 0.7°, 2008 (June: 75.7°; August: 75.0°) Newark: 2.3°, 1934 (June: 72.5°; August: 70.2°) White Plains: 2.0°, 1957 (June: 71.3°; August: 69.3°) No Cases: New York City-JFK Airport
-
High temperatures will top out mainly in the upper 70s and lows will fall to lower 60s in New York City through tomorrow. Outside the City, lows in the 50s will be widespread. During the weekend, lows could fall into the 50s even in New York City. Highs will generally reach the middle and upper 70s. Dry conditions will persist into next week. A system could bring at least some rain during or after the middle of next week. The ENSO Region 1+2 anomaly was -0.1°C and the Region 3.4 anomaly was -0.4°C for the week centered around August 20. For the past six weeks, the ENSO Region 1+2 anomaly has averaged +0.45°C and the ENSO Region 3.4 anomaly has averaged -0.28°C. Neutral ENSO conditions will likely continue into early autumn. The SOI was +24.64 today. The preliminary Arctic Oscillation (AO) was +0.969 today. Based on sensitivity analysis applied to the latest guidance, there is an implied near 100% probability that New York City will have a cooler than normal August (1991-2020 normal). August will likely finish with a mean temperature near 73.6° (2.5° below normal). That would make August 2005 the coolest August since 2000. Supplemental Information: The projected mean would be 1.6° below the 1981-2010 normal monthly value.
-
Occasional Thoughts on Climate Change
donsutherland1 replied to donsutherland1's topic in Climate Change
If one ever needed additional demonstration that some of the loudest social media influencers who deny climate change lack critical reasoning skills, below is one example: Look closely at the Time story's date: August 18, 2025. Now look closely at the influencer's counterargument: "Banana production reached an all-time record high in 2023." Yes, he's arguing that because banana production hit a record some two years earlier, there could not possibly be a shortage today. In other words, the situation could not have changed. There is nothing to support the assumption at the heart of his flawed conclusion. Let's take a look at how flawed this reasoning actually is using a weather example. In spring 1985, New York City was in the midst of a drought emergency. Applying the same logic, the social media influencer would have declared, 'I cannot spot a drought. Can you? Precipitation reached an all-time record high in 1983." 1983 Rainfall: 80.56" 1985: Drought Emergency As noted previously, social media influencers are bad sources of weather or climate information. In fact, in many cases, they are bad sources of information (no attributive nouns required). In this particular example, one can see how a lack of critical reasoning capacity impairs the social media influencer's ability to reach a sound judgment regarding bananas. The social media influencer is blind to the reality that dramatic changes can occur over even short periods of time rendering past data irrelevant to a current situation. Indeed, I suspect that it is often that inability to reason critically coupled with cognitive biases (with or without motivated reasoning) that plays a crucial role in making it impossible for social media influencers and many others who deny climate change to reach sound conclusions based on the evidence. Hence, there is no level of sufficient evidence that can alter their positions. They will reject the evidence that diverges from their preferred position regardless of how overwhelming it is. On the other hand, they will eagerly embrace conspiracy theories e.g., claims of data manipulation, that support their positions. One saw an example of this in furious efforts among climate change denial circles to discredit Phoenix's 118° August monthly record high that was set earlier this month. Back to the Time article, it does not say that there is an immediate shortage. It is forward looking, which makes 2023 data irrelevant to the future scenario covered in the article. Past or present abundance does not guarantee future resilience, a concept that the social media influencer could not grasp. Critical reasoning empowers individuals to distinguish essential data from distractions, filtering out irrelevant details and concentrating on the information that directly shapes and influences the issue at hand. The article states: Affordable and nutritious, bananas have long been a supermarket staple for consumers around the globe. But that could soon change, as climate change is contributing to a global shortage of the world’s most consumed fruit... Two known diseases, Black Sigatoka and Tropical Race 4, are already present in key growing regions around the world, including Colombia and Peru, and experts expect that further spread of disease will have a large impact on supply over time.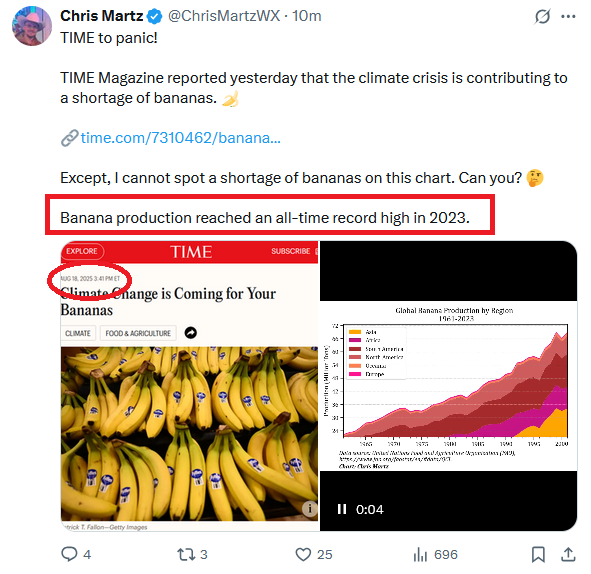
-
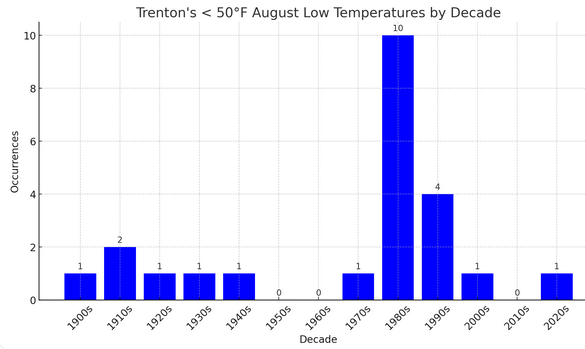
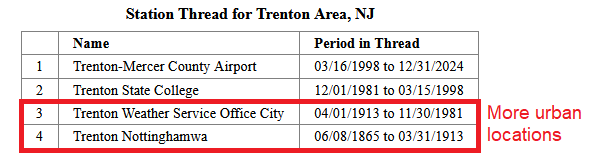
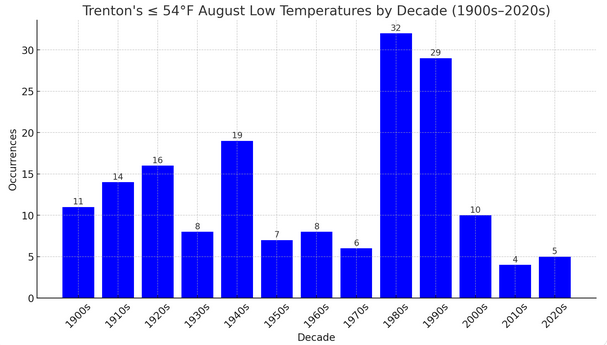
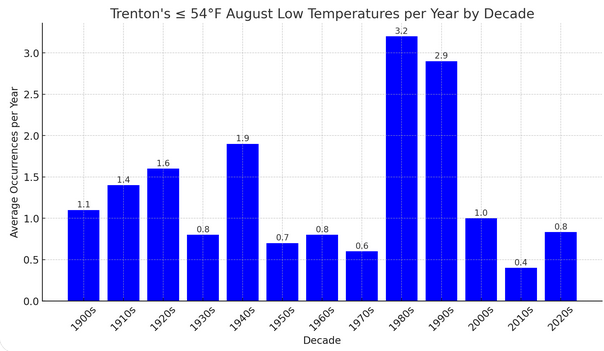
Station locations may have played some role in influencing the numbers. But the 1980s and 1990s were still unique.
-
Occasional Thoughts on Climate Change
donsutherland1 replied to donsutherland1's topic in Climate Change
New AMOC update: https://iopscience.iop.org/article/10.1088/1748-9326/adfa3b The latest update using the most up-to-date climate models does not present good news. The study used advanced climate models to look beyond the 21st century. Under high-pollution scenarios, the models showed the AMOC weakening throughout the 21st century before eventually shutting down in the 22nd century. Even under more moderate scenarios, the circulation sometimes collapsed, suggesting the risk is greater than scientists previously believed. The paper's chart depicting the scenarios is below: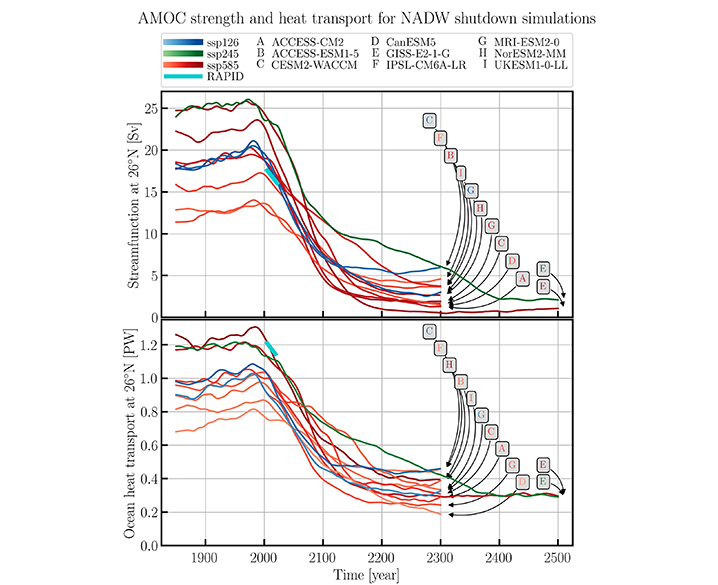
-
Here's the same chart for lower 50s (54° or below):
-
Yes. Before the 1900s, too much data was missing, so I excluded them. The 1980s and 1990s were unique.
-
September 2025 OBS-Discussion centered NYC subforum
donsutherland1 replied to wdrag's topic in New York City Metro
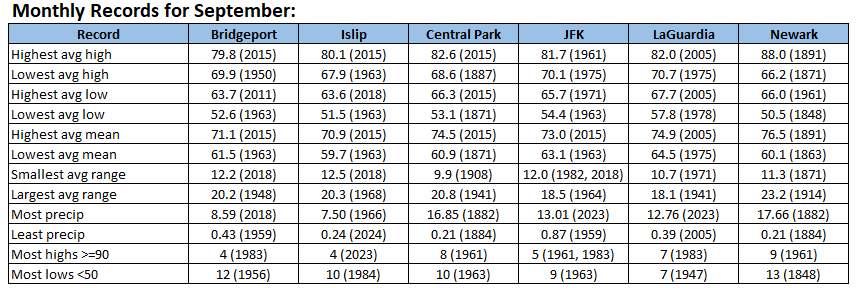
Miscellaneous: New York City's two highest hourly rainfall amounts occurred in September. 3.15" fell from 8 pm-9 pm on September 1, 2021 and 3.05" fell from 11 pm - 12 am on September 4, 1913. Times are standardized (standard time). Note: The highest average maximum temperature at Newark for a September that is missing no daily records is 83.3°, which was set in 2005. The erroneous 1891 value was left in the table.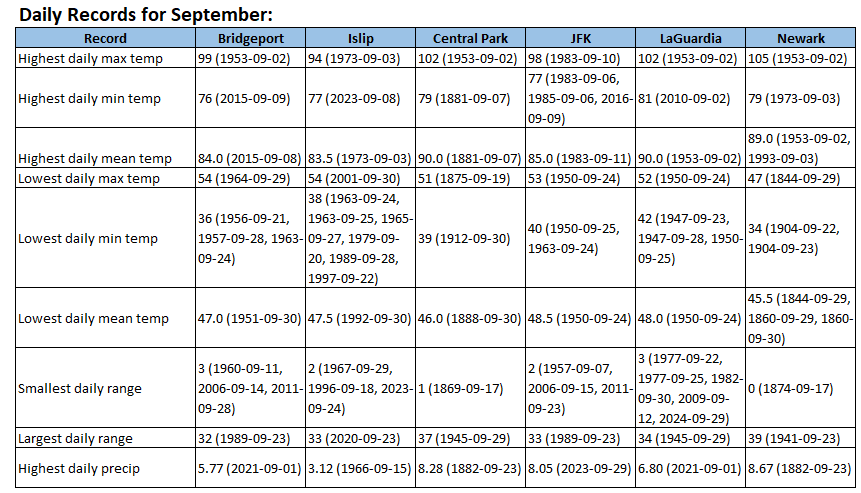
-
White Plains has fallen into the 50s for the 10th time this month. The last time that happened in August was 2013. White Plains is on course for 14 such days this month. That would be the most such days since 1987 when there were also 14 days.
-
Cooler covers the region. High temperatures will top out mainly in the upper 70s and lows will fall to lower 60s in New York City through at least Friday. Outside the City, lows in the 50s will be widespread. The cool weather will continue through the weekend. On account of the cool air, August 2025 will be among the five coolest Augusts since 2000. There will be higher-than-climatological risk of at least one period in September with highs in the upper 80s or perhaps 90s. Summers similar to the current one have had September highs of 90 or above about 10 percentage points above that for all other years. The ENSO Region 1+2 anomaly was -0.1°C and the Region 3.4 anomaly was -0.4°C for the week centered around August 20. For the past six weeks, the ENSO Region 1+2 anomaly has averaged +0.45°C and the ENSO Region 3.4 anomaly has averaged -0.28°C. Neutral ENSO conditions will likely continue into early autumn. The SOI was +18.45 today. The preliminary Arctic Oscillation (AO) was +0.930 today. Based on sensitivity analysis applied to the latest guidance, there is an implied near 100% probability that New York City will have a cooler than normal August (1991-2020 normal). August will likely finish with a mean temperature near 73.7° (2.4° below normal). Supplemental Information: The projected mean would be 1.5° below the 1981-2010 normal monthly value.
-
Cooler air will over spread the region tonight. High temperatures will top out mainly in the upper 70s and lows will fall to lower 60s in New York City through at least Friday. Outside the City, lows in the 50s will be widespread. The cool weather will continue during the weekend. On account of the cool air, August 2025 will be among the five coolest Augusts since 2000. There will be higher-than-climatological risk of at least one period in September with highs in the upper 80s or perhaps 90s. Summers similar to the current one have had September highs of 90 or above about 10 percentage points above that for all other years. The ENSO Region 1+2 anomaly was +-0.1°C and the Region 3.4 anomaly was -0.4°C for the week centered around August 20. For the past six weeks, the ENSO Region 1+2 anomaly has averaged +0.45°C and the ENSO Region 3.4 anomaly has averaged -0.28°C. Neutral ENSO conditions will likely continue into early autumn. The SOI was +21.06 today. The preliminary Arctic Oscillation (AO) was +0.610 today. Based on sensitivity analysis applied to the latest guidance, there is an implied 99% probability that New York City will have a cooler than normal August (1991-2020 normal). August will likely finish with a mean temperature near 73.8° (2.3° below normal). Supplemental Information: The projected mean would be 1.4° below the 1981-2010 normal monthly value.
-
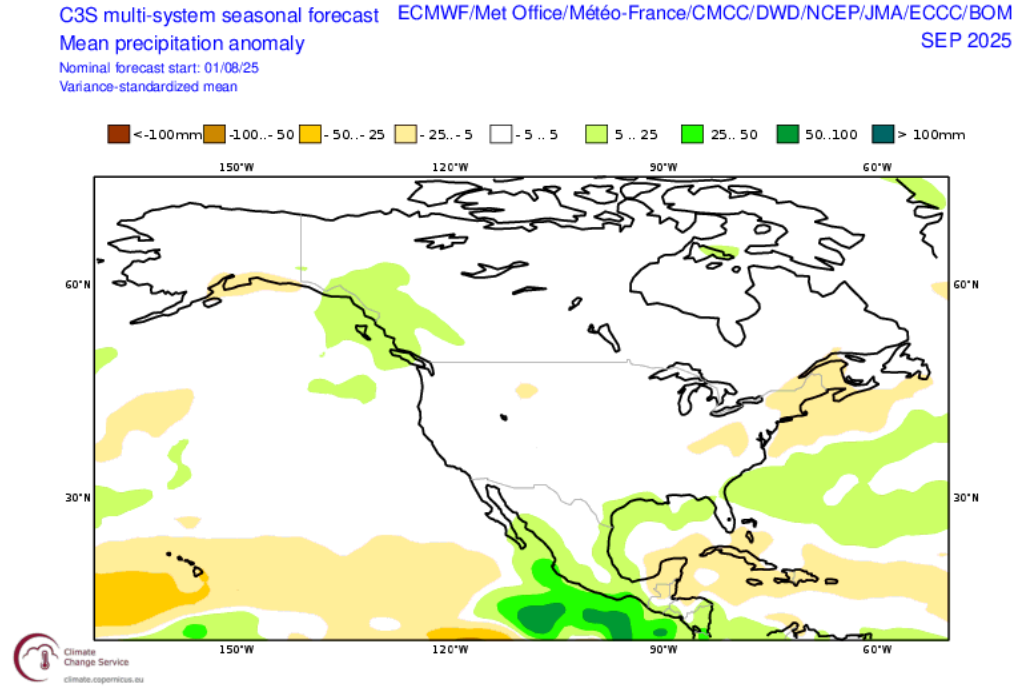
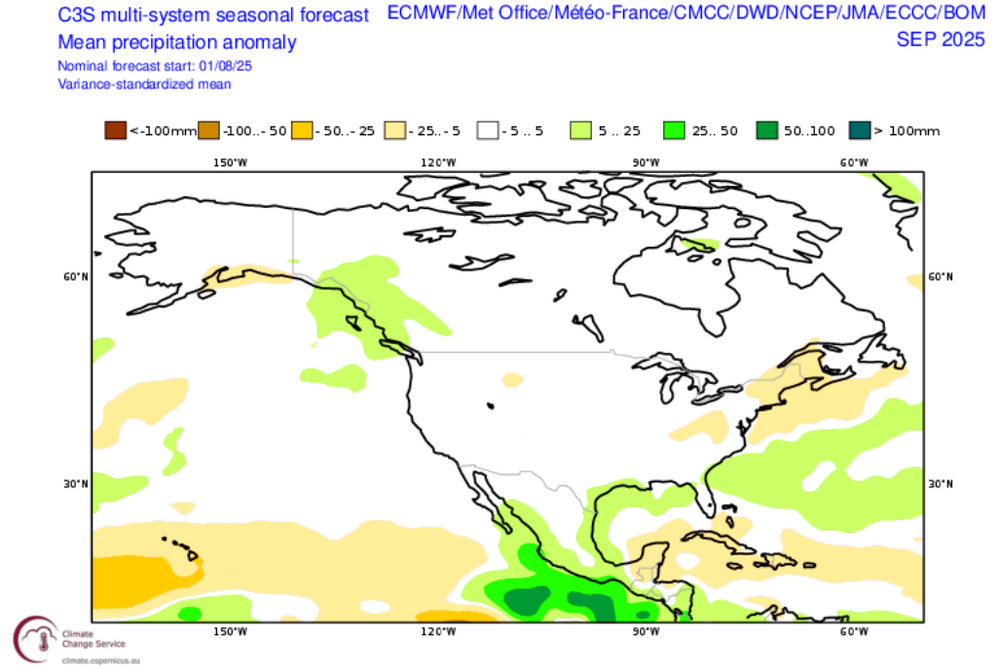
There are currently some thunderstorms in western New York State and scattered thunderstorms across central Pennsylvania along an advancing front. Parts of the region could pick up a shower or thundershower overnight. Many parts of the region will remain dry. If New York City does not receive any rain, it will be on track to see no rainfall for the entire August 22-31 period. Only the following years have seen no rainfall during that time: 1876, 1881, 1894, 1902, 1909, 1921, 1925, 1953, and 2007. Two thirds of those years saw a dry September. The least rainfall was 0.97" in 1881. The most rainfall was 8.68" in 1894. Of those nine years, 66.7% had less than 3" of rain during September. That figure for all other years was 45.6%, meaning that the dry end to August suggested a nearly 50% increase in the likelihood of a dry September. Those findings are consistent with some of the long-range guidance. It should be noted that the CFSv2 shows wetter than normal conditions for the Northeast:
-
Occasional Thoughts on Climate Change
donsutherland1 replied to donsutherland1's topic in Climate Change
Yes, that's a key point. Good communication is essential in a field like meteorology. Even if one might prefer to use a different term, one shouldn't portray one's preference as a requirement, especially when one's own profession recognizes the term one objects to. -
Parts of the region could see a shower tonight or early tomorrow as a cold front moves across the region. In the wake of the frontal passage, high temperatures will top out in the lower and perhaps middle 80s tomorrow before the push of cooler air overspreads the region. Following the arrival of the cool air, high temperatures will top out mainly in the upper 70s and lows will fall to lower 60s in New York City through at least Friday. Outside the City, lows in the 50s will be widespread. On account of the cool air, August 2025 will be among the five coolest Augusts since 2000. There will be higher-than-climatological risk of at least one period in September with highs in the upper 80s or perhaps 90s. Summers similar to the current one have had September highs of 90 or above about 10 percentage points above that for all other years. The ENSO Region 1+2 anomaly was +0.6°C and the Region 3.4 anomaly was -0.3°C for the week centered around August 13. For the past six weeks, the ENSO Region 1+2 anomaly has averaged +0.53°C and the ENSO Region 3.4 anomaly has averaged -0.20°C. Neutral ENSO conditions will likely continue into early autumn. The SOI was +15.90 today. The preliminary Arctic Oscillation (AO) was +0.087 today. Based on sensitivity analysis applied to the latest guidance, there is an implied 97% probability that New York City will have a cooler than normal August (1991-2020 normal). August will likely finish with a mean temperature near 74.0° (2.1° below normal). Supplemental Information: The projected mean would be 1.2° below the 1981-2010 normal monthly value.