vortex95
-
Posts
1,488 -
Joined
Content Type
Profiles
Blogs
Forums
American Weather
Media Demo
Store
Gallery
Everything posted by vortex95
-
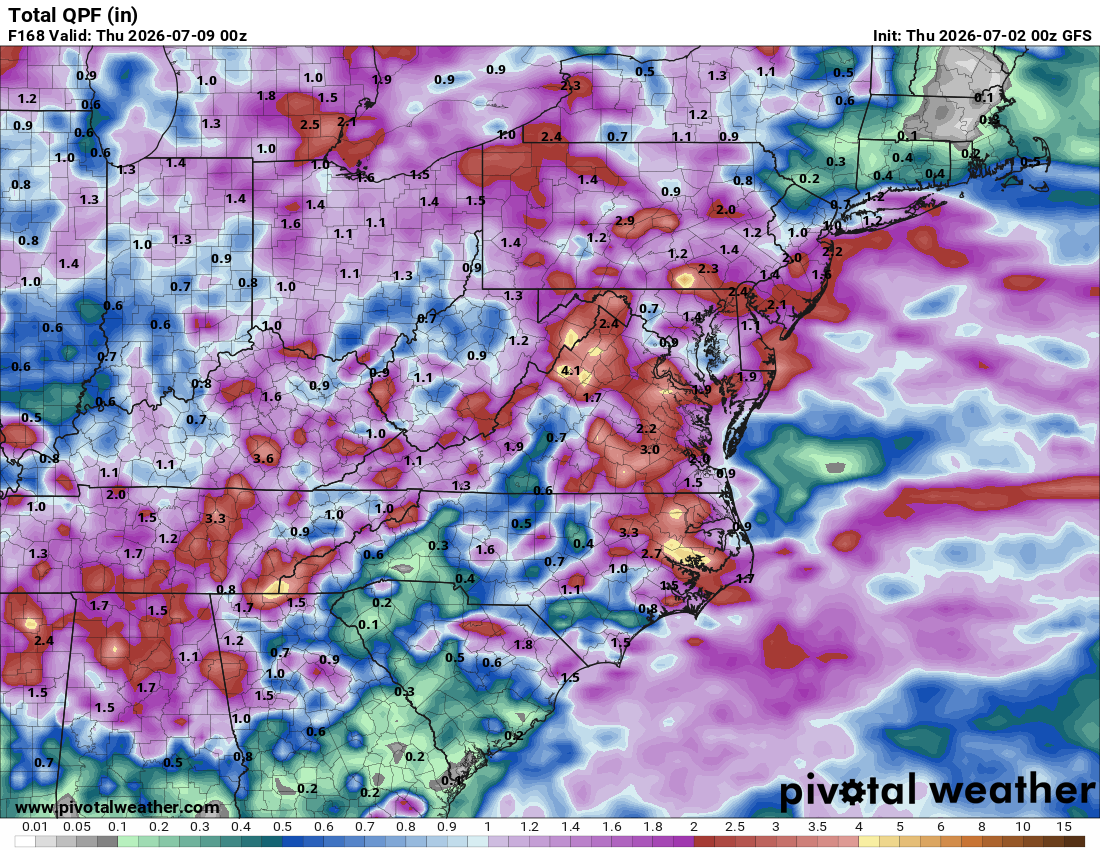
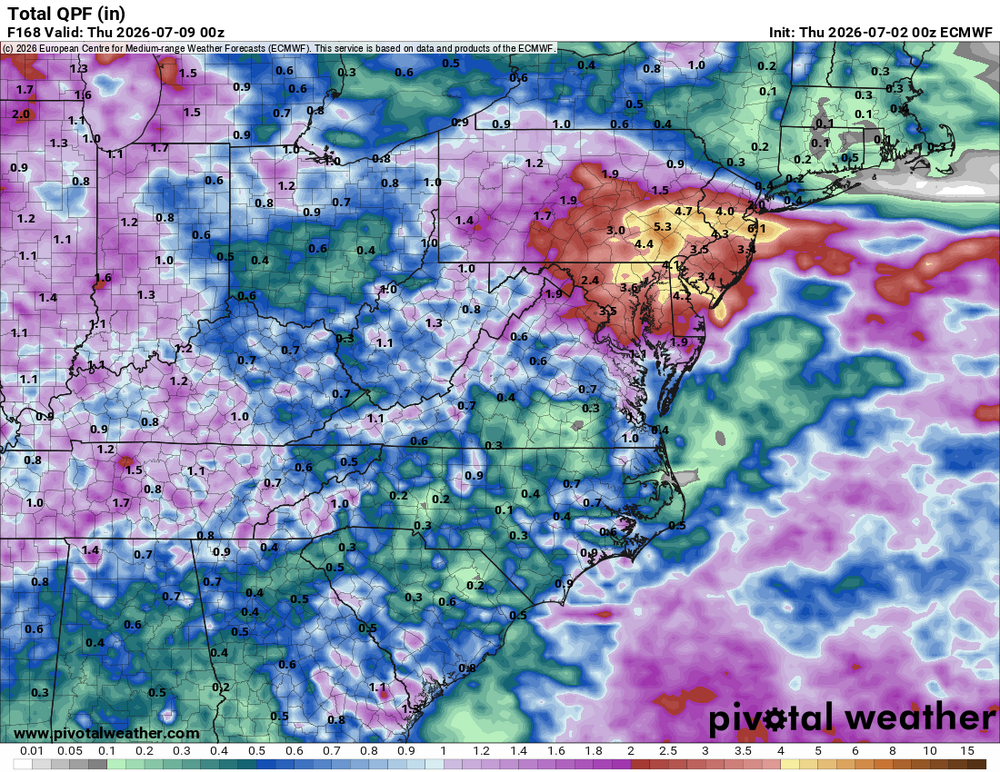
Despite the MRGL/SLGHT risk SPC has for the region Fri, it still looks to me too warm aloft and capped for any significant storms most of the region. Still +12 C at 700 most of the day. The ridging aloft starts to break down by late aftn, but models show very limited storm coverage. Isolated storms at best. Best chance the PA border and SW VA/parts of WV. Looks good for considerable tstm activity Sat-Mon. GFS and ECMWF quite wet for the region in the next week.

- 1,481 replies
-
- 6
-

-

-
- severe
- thunderstorms
- (and 7 more)
-
Said CoastalWx...that was an isolated supercell, so of course better.
-
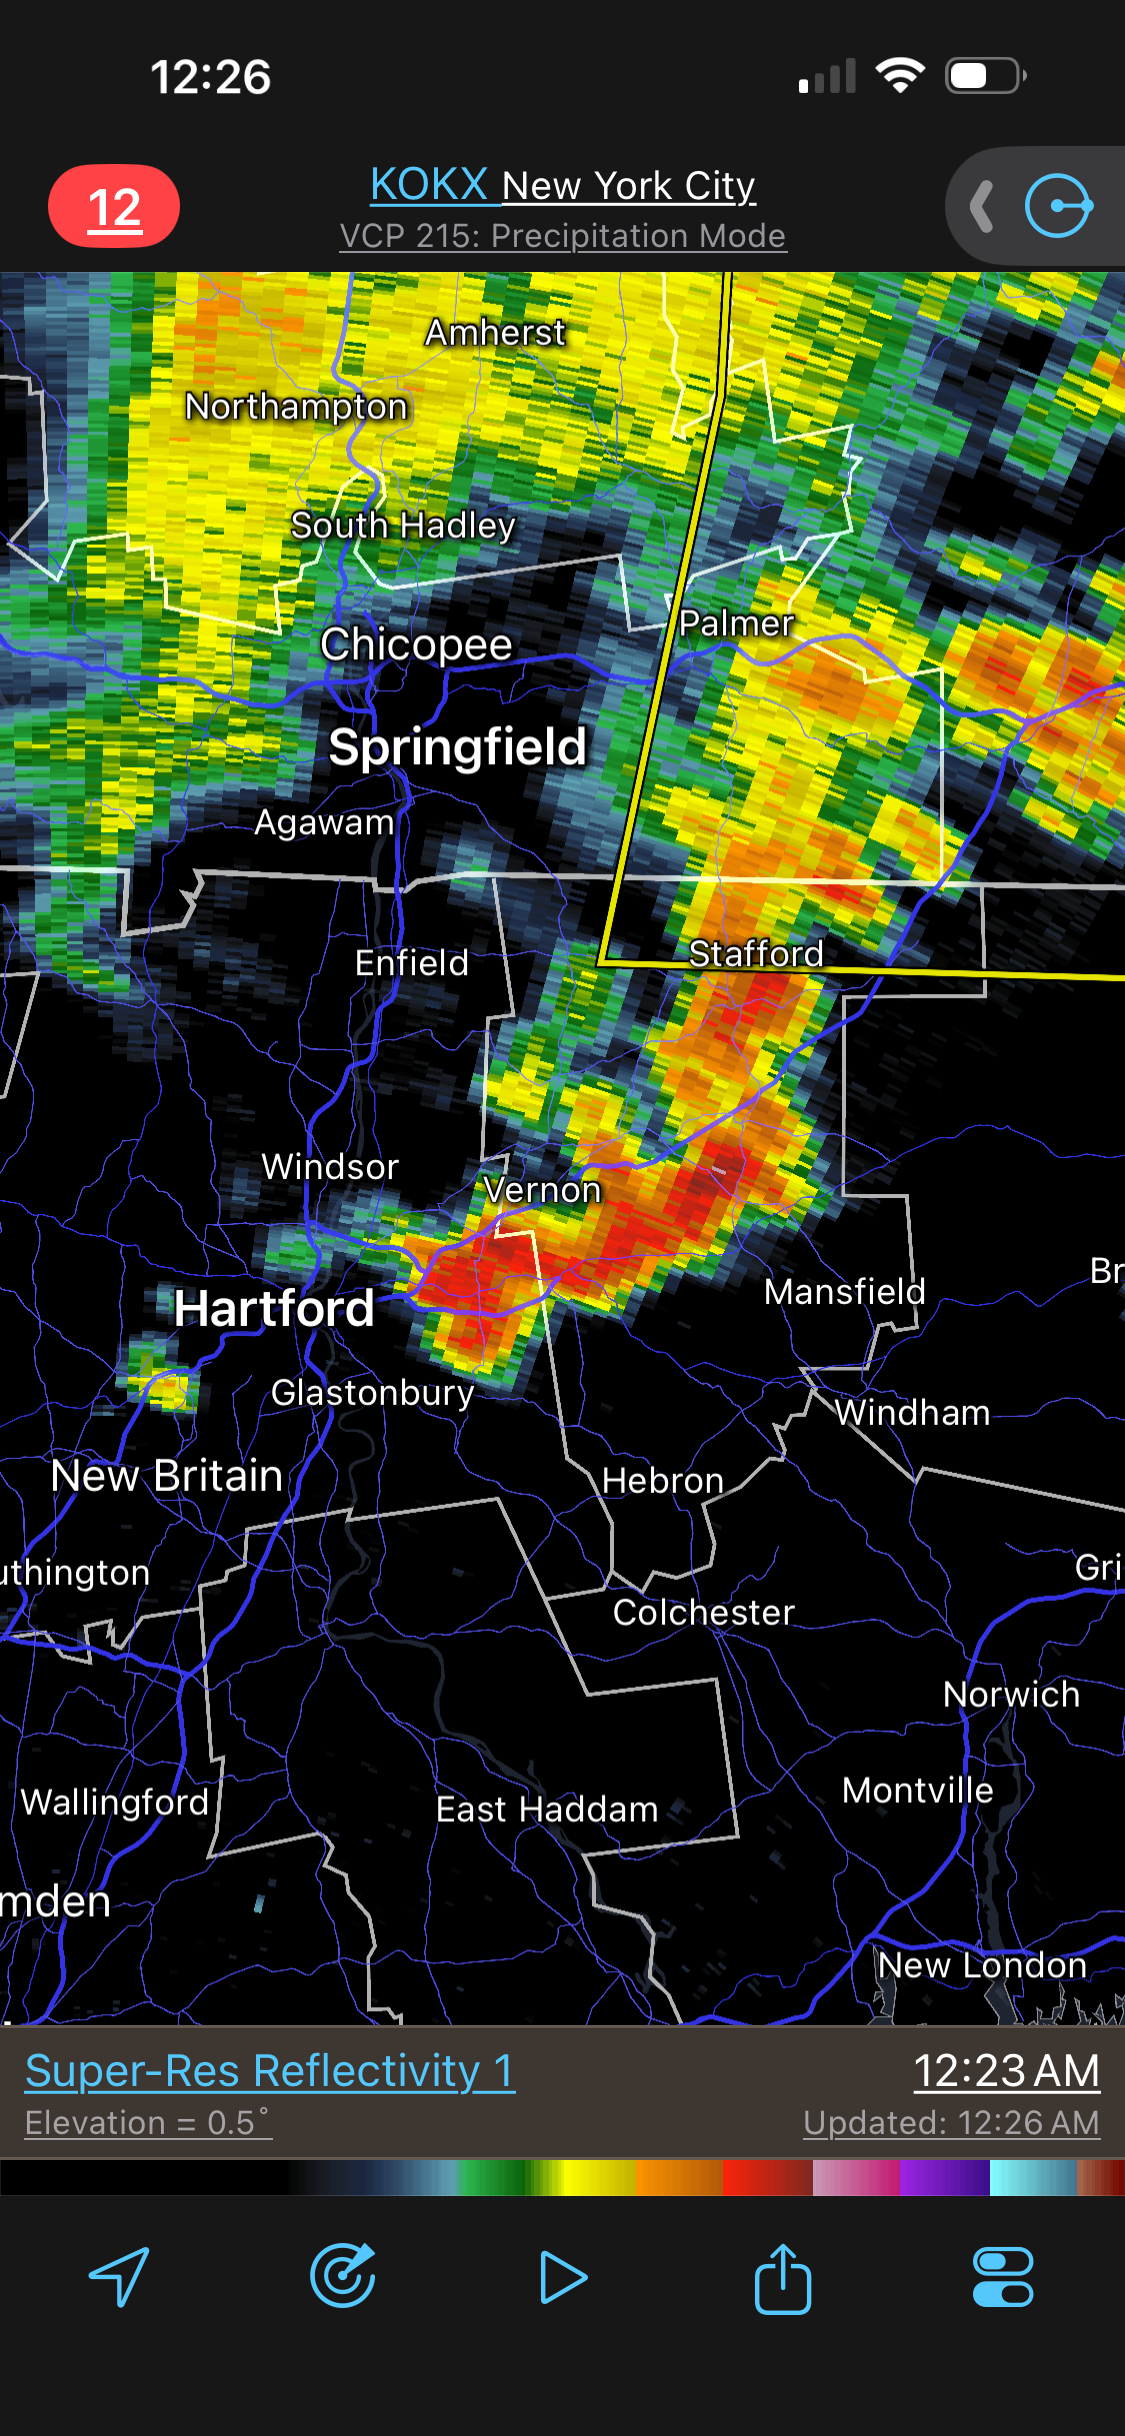
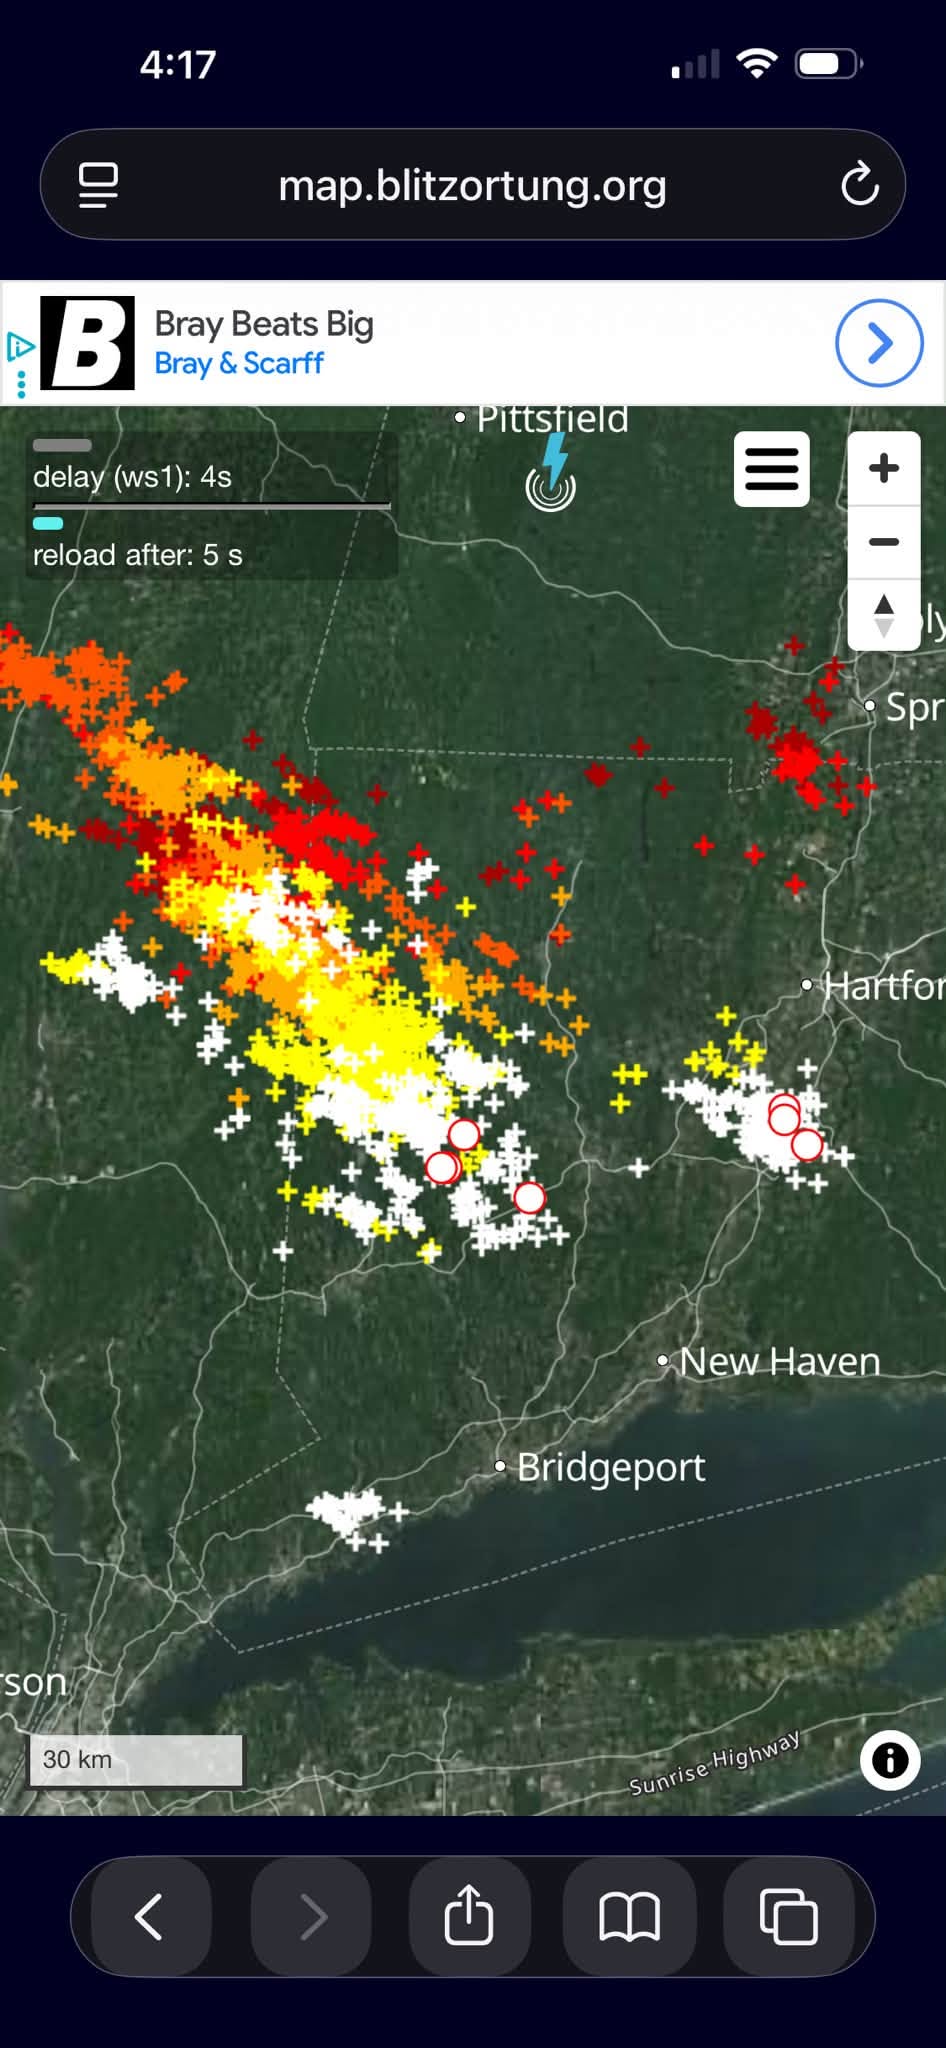
And CoastalWx is downplaying it as MEH b/c he has 6/1/11. Never underestimate the power of EML nocturnal convection Storm chasing in the Plains a lot. it never ceases to amazed me. WzWiz upset it fired just to the E of HFD?


-
Consistent for ring of fire events w/ very high 1000-500 thk.
-
"And I still will have a Bruins playoff game get together at my house when I know will likely lose power..." said Scott the morning of 6/1/11!
-
Not very green. What ever happened to "tree-hugging?" LOL. Seriously, just b/c something is/may be popular, does not mean it is right or the best solution. You can't praise being green when you clear-cut trees on a large scale, as one example. Solar relies *only* on the virtue that sunlight is limitless and free, and treats that in a vacuum. It ignores the issues that do not make it effective alternative energy source for mass consumption (to say the least), like the enormous land required and how it destroys the ecology of that land, the amount of raw material needed, including precious metal demand that results in more strip mining, the limited lifespan (~25 years), the solar panel's vulnerability to the elements/wx, their disposal costs, and the simple fact the sun does not shine all the time. Every link the chain has to work effectively and practically for something to be affordable and reliable for a main energy source. This is a fact. "But it is CO2 free!" Yes, it is, but that single item does not make better overall when all things are considered. Everything has a cost/benefit ratio.
-
Enlighten me. Link?
-
No svr watch for this? W/ that many and huge areal coverage of warnings currently? This is not some localized event that can be just handled by WFOs.
-
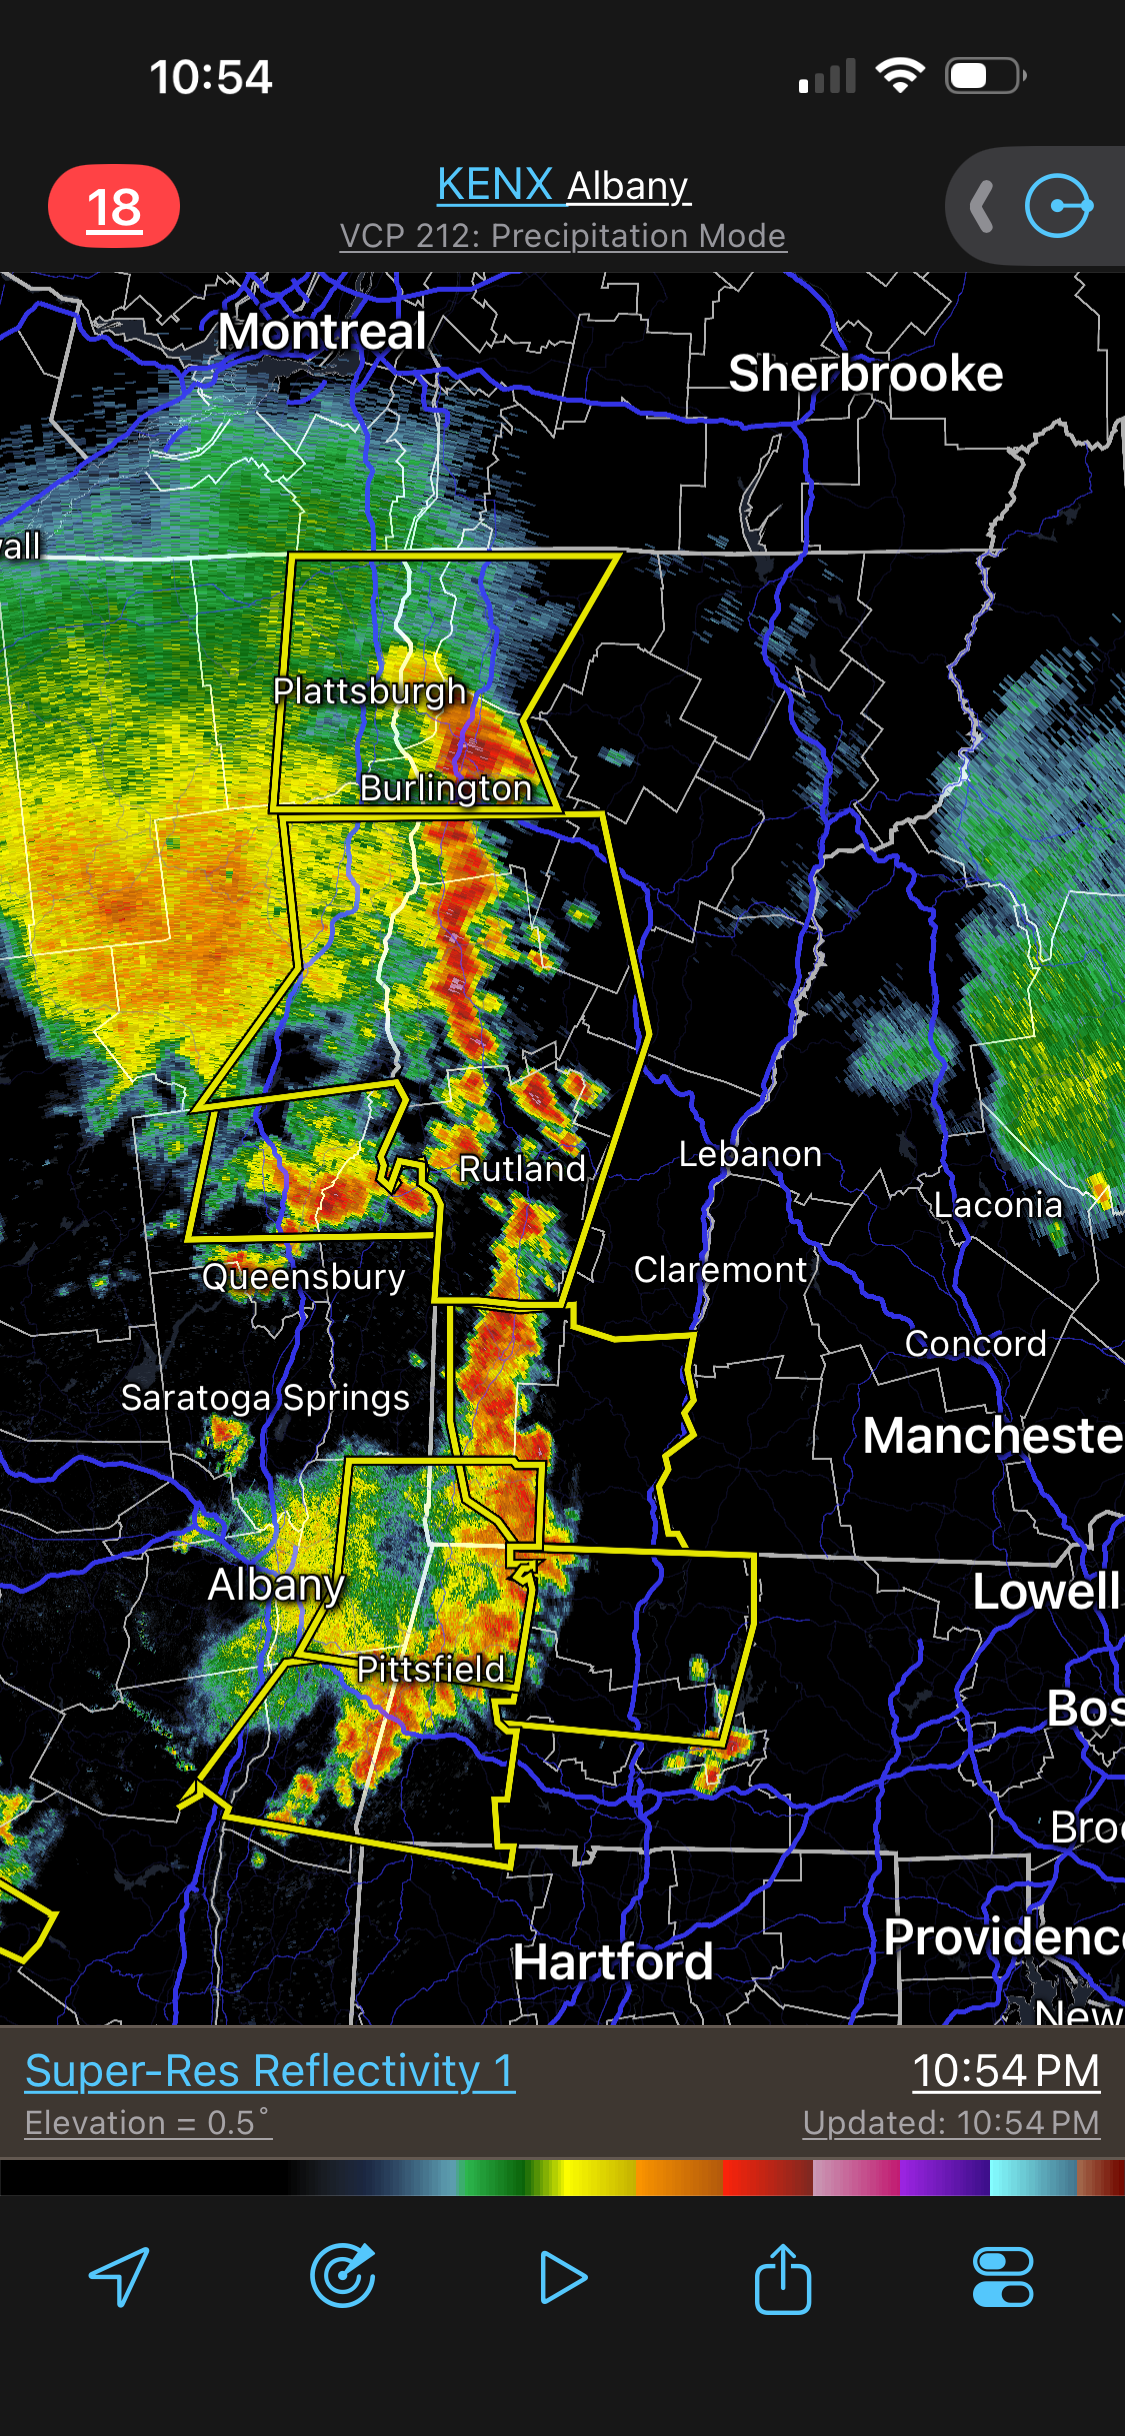
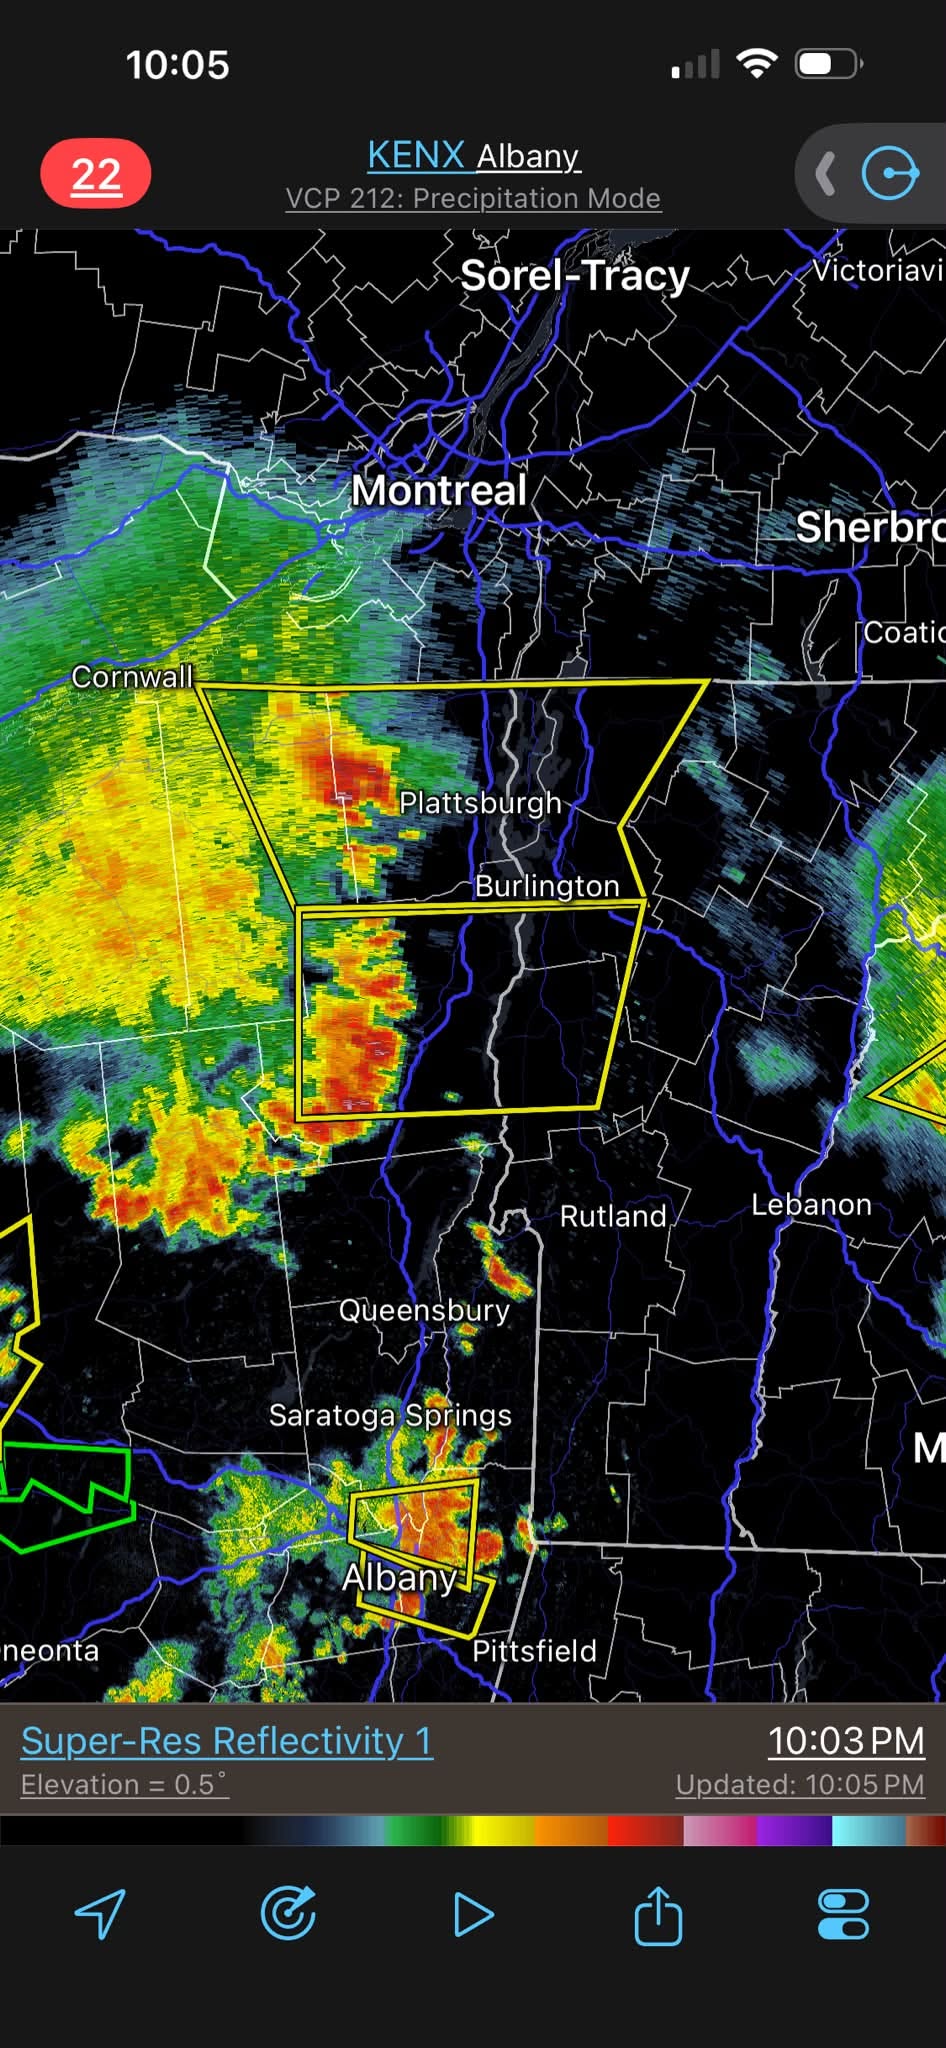
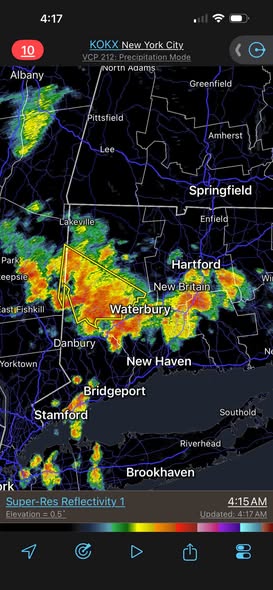
The HRRR and RRFS last night/this morning were terrible. 00, 06, and 12z did not have the earlier nasty BTV storm and the complex in western MA now. Oh crap...latest radar. Scott going to have timbers falling down all around him later in Winni?

-
A co-worker of mine lives in Pasadena MD. Over 20 years at this location w/ detailed daily obs, and he notes his dew point hits 80 often every summer due to the proximity of the bay. Does not matter if it is a near normal high temp for the day or a big heatwave.
-
The "NITE" is still young... Scott looking forward to "heat lightning," which he still think is a thing! LOL.
-
I smell derecho! Of note, the definition of derecho was modified last year and it's requirements are more specific and somewhat more restrictive. WxWiz and CoastalWx were proby not aware! https://journals.ametsoc.org/view/journals/bams/106/1/BAMS-D-24-0015.1.xml
-
Yah but no tstms anywhere near Weymouth!
-
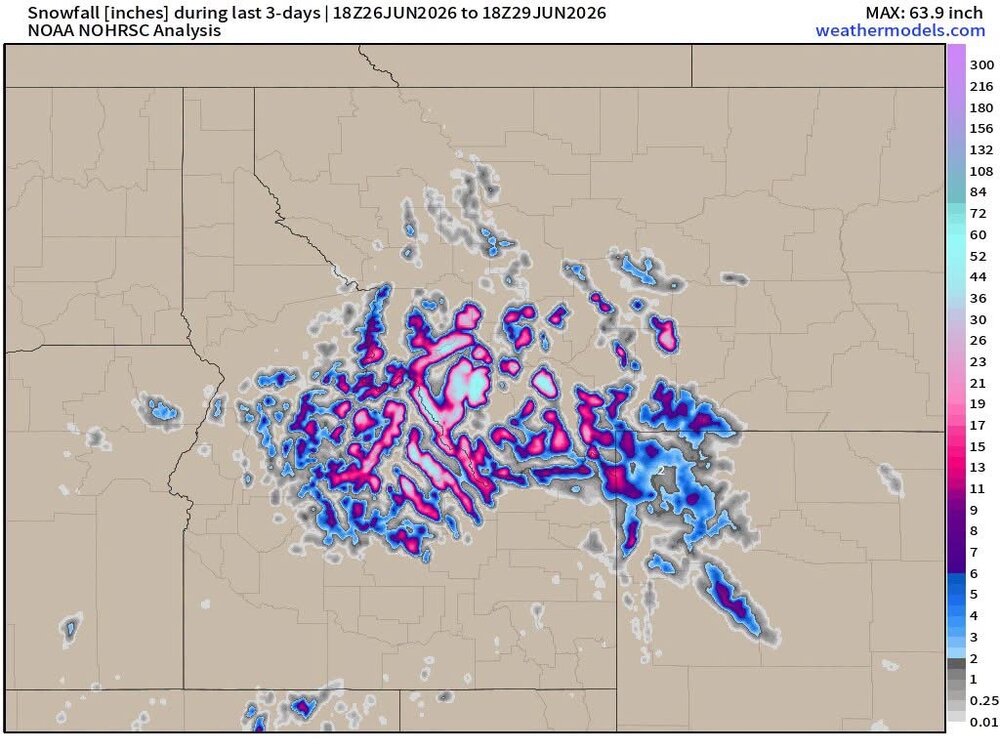
Scott mad. Highest measured total was 21" at Darkhorse Lake MT elevation 8700 ft.
-
WxWiz AM PT?

-
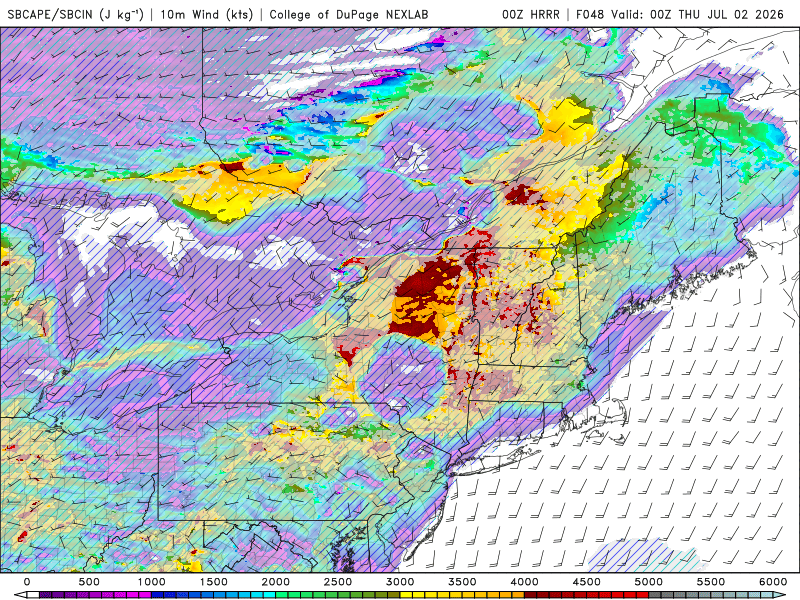
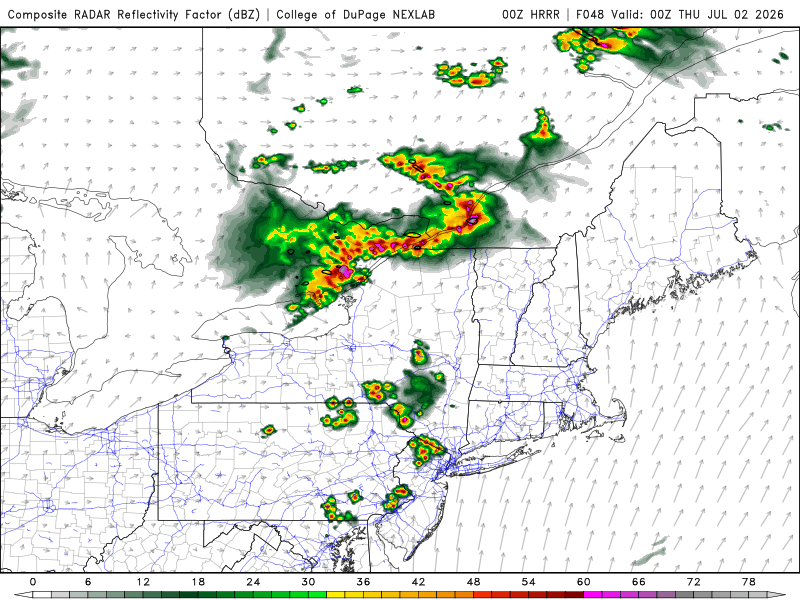
Clouds a sig problem today w/ AM convection and dirty ridge clouds, so temps held back despite 1000-500 thk getting to 580 by 00z. GFS has 98-102 across SNE Thu-Fri. That appears reasonable. The MCS is of concern. CAPE up to 4600 in VT late in the day, and still near 3000 in SNE 2-3am Thu just ahead of it, which is outstanding for this area at this time of day (WxWiz EML!). HRRR shows the MCS quite strong. RRFS/NAM/ECMWF oddly do not have it, but the GFS does.
-
I've wanted to use torrid, but it implies dry or parched, so that matches desert-type heat better.
-
Idiot AI. 1.3 mi from the summit as if that is a fair comparison when dealing w/ sharp elevation. I've played w/ AI query for historical wx, and it messes up a lot. Conflates events and overlooks obvious details that make all the difference.
-
No discernible impact from slightly less sun angle July is the warmest month climatologically even though the days are getting shorter. This has to do w/ the Earth's heat balance, and the lag that exists in the atmosphere and ocean. 1 month lag for the atmosphere and 3 months lag for the oceans as to max avg temps.
-
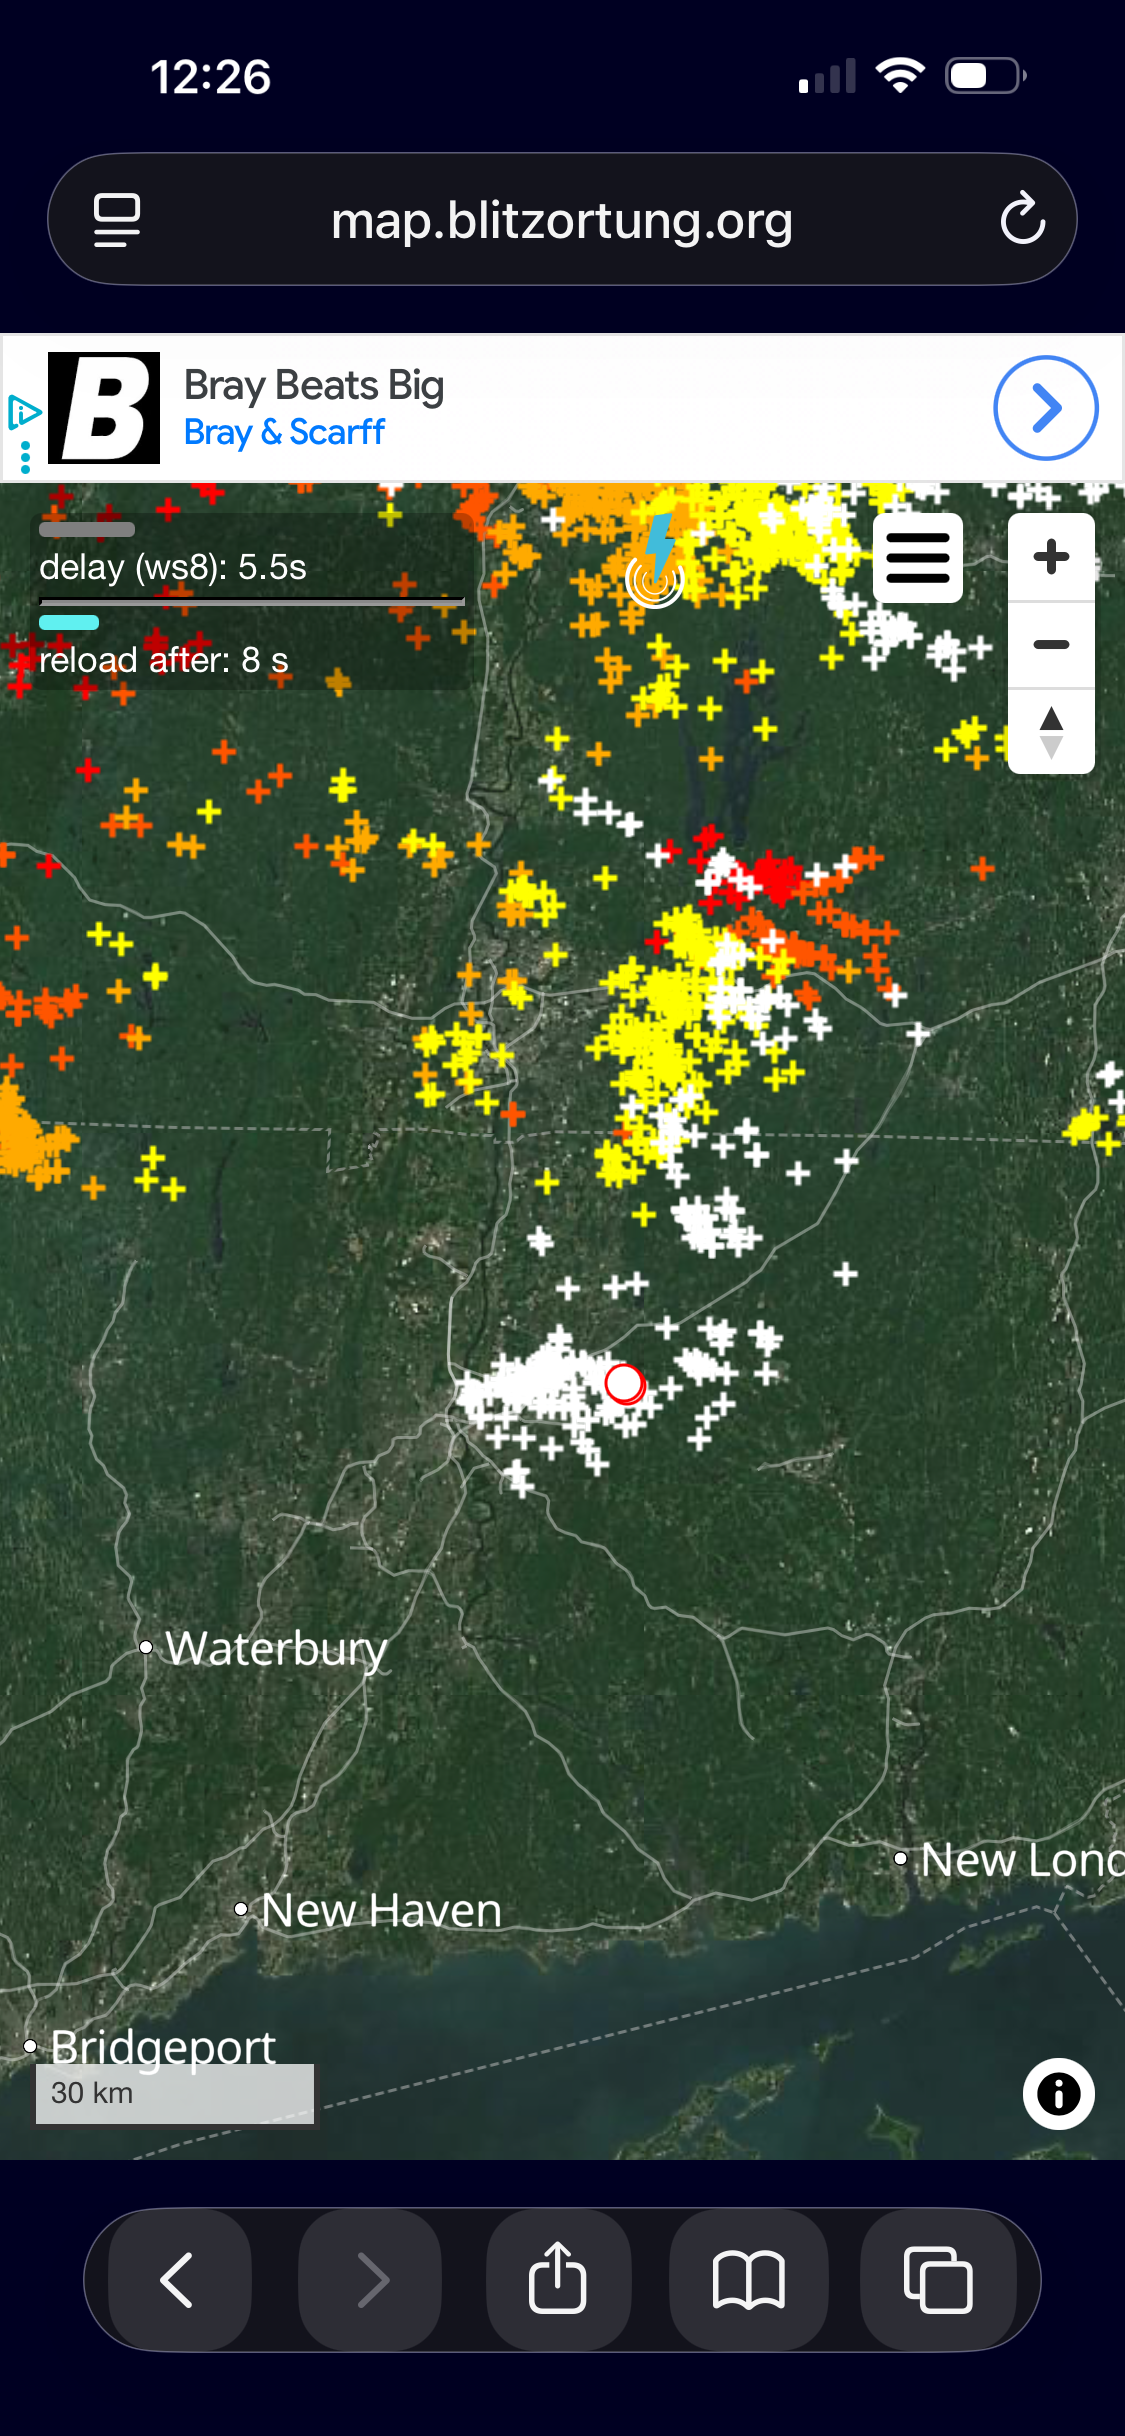
Good ring of fire/NW flow/derecho set ups occur about every 5-8 yr in the NEUS. Looks like we will have to deal w/ this every day in some form June 30-July 4. One of better persistent setups I have seen in a while. This stuff can get nasty. Noted that Wed aftn, HRRR sfc-based CAPEs as high as 4800 in VT! EML present as well (WxWiz is happy!). The HRRR valid 00z Thu suggests derecho possible overnight parts of New England. Don't let all the capping present concern you. It is not much of factor for overnight convection when an EML is present. One of most sig features of EML convection is crazy overnight LTG shows. Par for course in the Plains, and it works the same when we get it here.
-
I think much of the general public is wise to all the hype, but it's always the few that yell and screen the loudest, cry foul "WE GOT NOT WARNING!" and worry about everything, and that gets all the attention and skews overall perception. Then you get knee-jerk reactions from politicians and authorities w/ silly changes and waste of resources. Cases in point, Matthew floods in NC/SC in 2016 and Ida floods in NYC in 2021. Warnings and strongly worded high flood risk statements out days in advance up the wazoo, and still politicians and authorities cried foul. It just goes to show even when fcsts are spot on, you still get nonsense. That makes me question this notion that more warnings are better from a social/political standpoint b/c you still get whiners regardless.
-
Yes, starting on Sat, it looks quite good for tstms in the Mid-Atlantic! Give us some good training soakers as we need the rain badly.
- 1,481 replies
-
- 2
-
-

-
- severe
- thunderstorms
- (and 7 more)
-
And on Aug 3, BOS was something like 93 at 9am, but a BDF ruined what probably would have been their all-time highest temp!
-
Devil's advocate? Good! Promotes more discussion and is a valid discussion position, and I take this position every so often as well! Yes, from a sensible wx POV, 100 vs. 104 is trivial. It's like last year when TPA hit 100 for the first time, when they had 99 many times. Is that *really* a big deal? The MSM sure made so it was! However, nothing is scaled properly anymore. You look at the MSM and so many on social media, slicing and dicing down everything to the smallest minutiae they can find to hype. So 100 and 104 in a social or psychological sense *is* a big deal. It really shouldn't be, but that's society for you. We have a very bad tendency to make mountains out of molehills and find issues where there is none. And yes, it will be hot and impact and the public knows that, but to embellish it w/ all these stupid bells and whistles and prophecies of doom? That is counterproductive and self-serving to those who promote senseless fear-mongering.
-
And where is the MSM on that? Crickets. You can't have both ways. Selective reporting is rife.