All Activity
- Past hour
-

E PA/NJ/DE Summer 2026 Obs/Discussion
Hurricane Agnes replied to PhiEaglesfan712's topic in Philadelphia Region
As a 2-day event total update, I had 0.42" total yesterday after overnight rain, and along with this morning's round, with another band over me right now ticking me up to 1.07", have 1.49" for 2 days. Temp 76/dp 75. -

Augdewst 2026: Summer's Last Stand
CoastalWx replied to Prismshine Productions's topic in New England
Hrrr did pretty good with this overall. -

Augdewst 2026: Summer's Last Stand
Damage In Tolland replied to Prismshine Productions's topic in New England
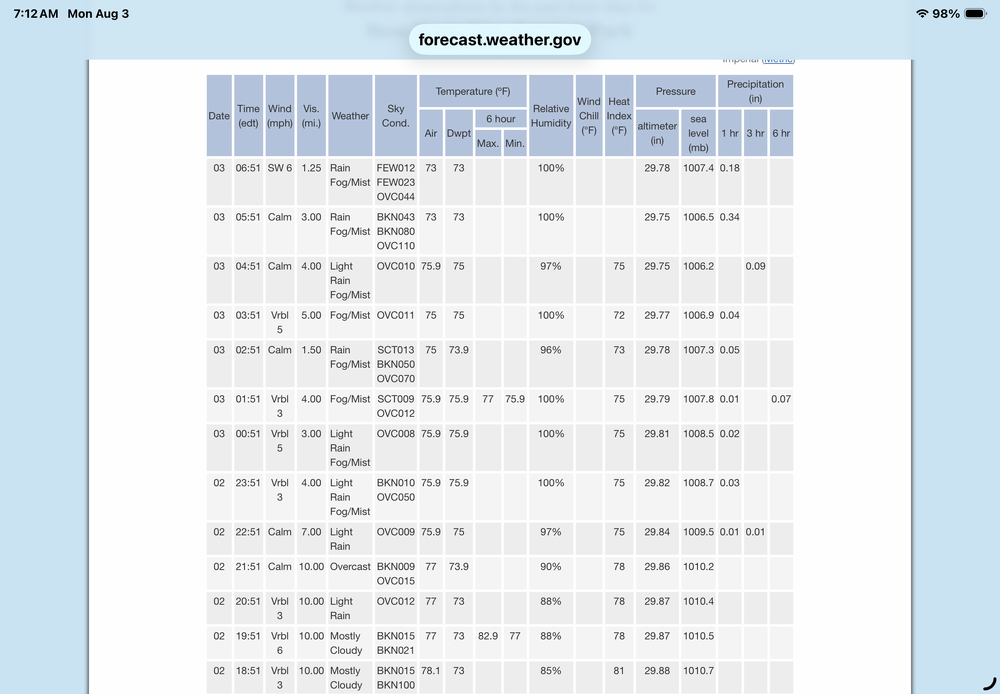
Big winds just ripped thru . Wow -

Augdewst 2026: Summer's Last Stand
Sey-Mour Snow replied to Prismshine Productions's topic in New England
Radar estimates 4.72” on CT,MA border -
Augdewst 2026: Summer's Last Stand
CT Valley Snowman replied to Prismshine Productions's topic in New England
Thankfully there is some movement and not a complete stall. Already up around 3" in this area. -
Augdewst 2026: Summer's Last Stand
CoastalWx replied to Prismshine Productions's topic in New England
That area from Springfield to Southern New Hampshire is going to get absolutely slapped. -
1.38 for me thus far. Might add a bit more but the bulk looks over. Good riddance. Rain begone
-
Doesn't rain, doesn't snow... never too hot, never too cold at Central Park. Incredible.
-
Augdewst 2026: Summer's Last Stand
CoastalWx replied to Prismshine Productions's topic in New England
It will come. -
 Cette excellente option peut ГЄtre trouvГ©e via https://franceformen.online/#.
 -
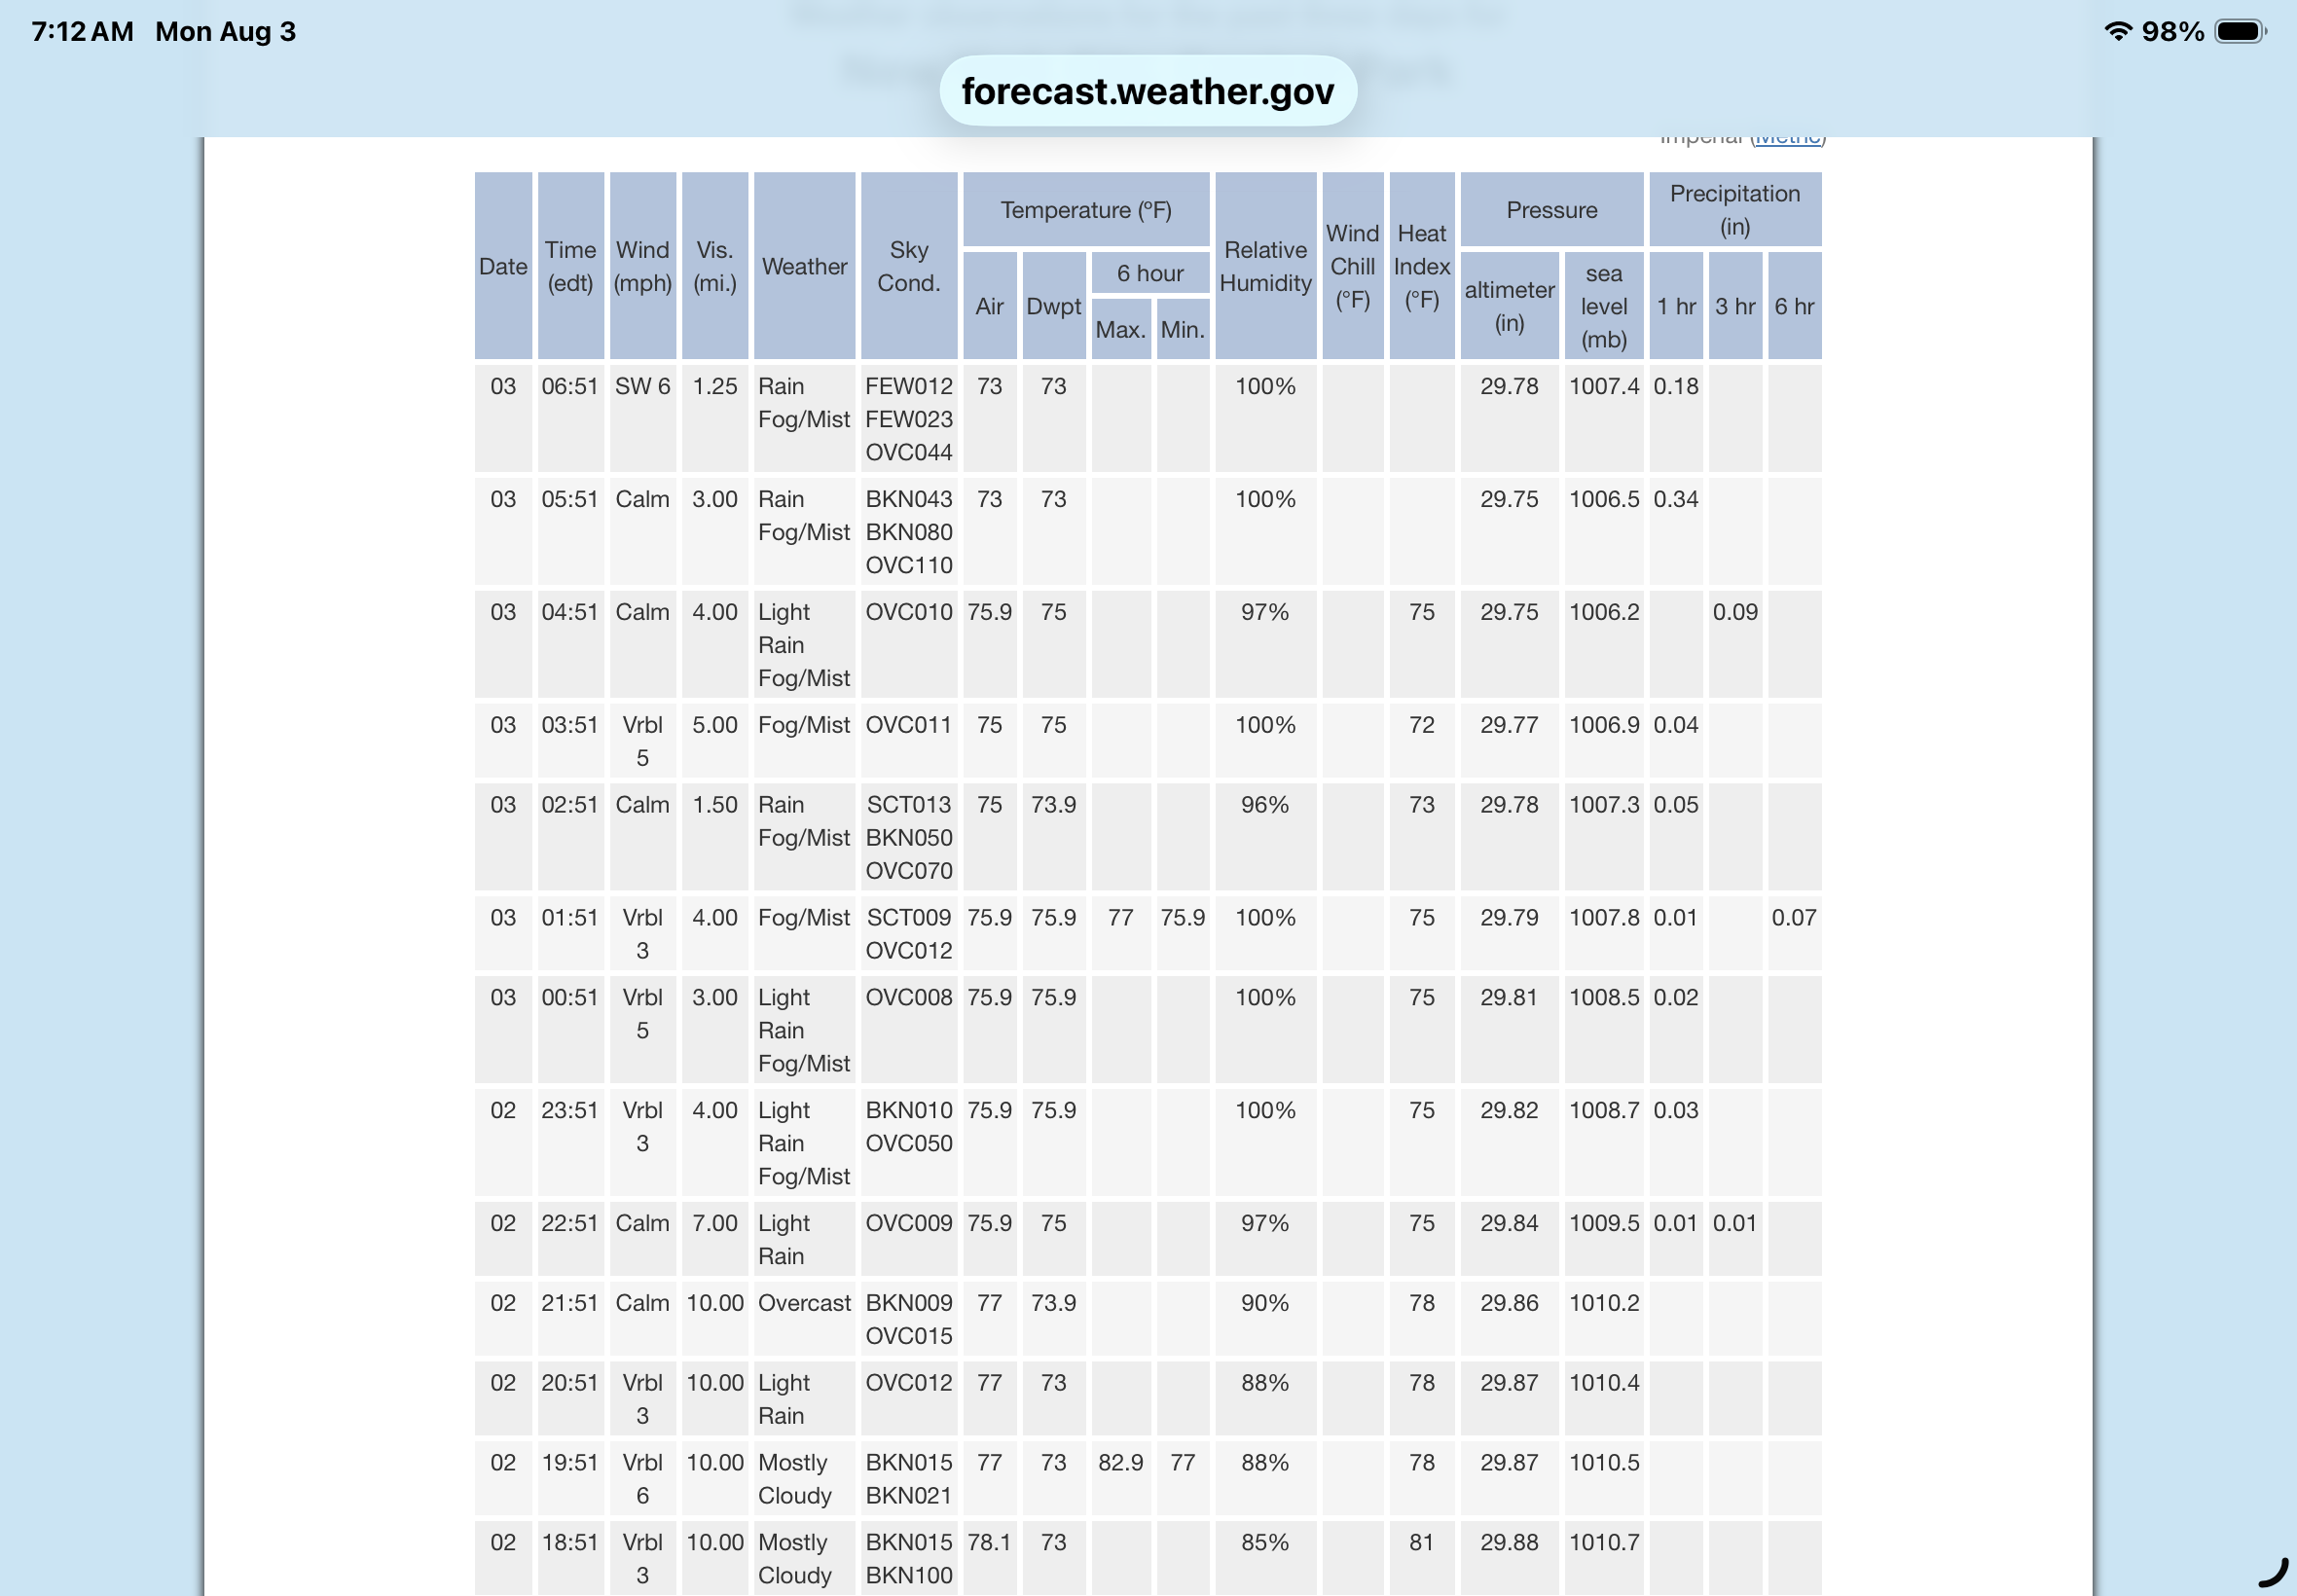
Through 06:51, .68 for Central Park. Heaviest hour .34. As always ….
-
Augdewst 2026: Summer's Last Stand
WxWatcher007 replied to Prismshine Productions's topic in New England
.41 in 17 minutes. Up to .75” on the day. -
E PA/NJ/DE Summer 2026 Obs/Discussion
JTA66 replied to PhiEaglesfan712's topic in Philadelphia Region
2.10” Been awhile sine I’ve had totals like that. 75F/DP 74F -

2026-2027 Super El Nino
snowman19 replied to Stormchaserchuck1's topic in Weather Forecasting and Discussion
I have no explanation. It makes no sense when compared to the OISST RONI. The BOM and NOAA are and have been in complete disagreement. The BOM has the official weekly readings consistently much higher than NOAA’s -
Augdewst 2026: Summer's Last Stand
Sey-Mour Snow replied to Prismshine Productions's topic in New England
Too bad no one saw this coming… 10,000 square miles of New England with 1.5-3” of rain in a few hours lol -
Augdewst 2026: Summer's Last Stand
WxWatcher007 replied to Prismshine Productions's topic in New England
.30 in ten minutes. Meh. -
Heavy rain-about 1.8” so far with this.
-
Central PA Summer 2026 Discussion/Obs Thread
pawatch replied to Voyager's topic in Upstate New York/Pennsylvania
What’s weird is all that rain came from a non tropical storm. It sure changed my rainfall numbers for the year. But one has to wonder how much was runoff. -
.thumb.gif.f92b16c631a1d15d405ed77b33f0710d.gif)
Augdewst 2026: Summer's Last Stand
Torch Tiger replied to Prismshine Productions's topic in New England
hey ride it -

Augdewst 2026: Summer's Last Stand
weatherwiz replied to Prismshine Productions's topic in New England
This rain is insane. Can’t even take a shower this morning because there’s been thunder and lightning. Have to go to a doctors appointment soon too -

Central PA Summer 2026 Discussion/Obs Thread
Voyager replied to Voyager's topic in Upstate New York/Pennsylvania
.57 yesterday/overnight in Tamaqua. -

Central PA Summer 2026 Discussion/Obs Thread
Superstorm replied to Voyager's topic in Upstate New York/Pennsylvania
0.35” for Lancaster. Much more in eastern and southern Lanco. . -
Augdewst 2026: Summer's Last Stand
CT Valley Snowman replied to Prismshine Productions's topic in New England
Pounded. -
Augdewst 2026: Summer's Last Stand
Damage In Tolland replied to Prismshine Productions's topic in New England
That thing is spinning . Like the whole little complex over the valley -
2026-2027 Super El Nino
snowman19 replied to Stormchaserchuck1's topic in Weather Forecasting and Discussion
Something has got to give with the PDO/extratropics. The models continue the massive Nino forcing annd coupling into the fall. The fall is when ENSO effects on the mid-latitudes become much more pronounced and continue to increase into the winter. Call me the crazy one, but I just can’t see the -PDO continuing beyond November and I’m confident that we see a rapid rise during met fall and an eventual flip to weak positive by the end of met fall