All Activity
- Past hour
-
Wednesday is MA border north.. Friday meh and the Monday storm is east
-
Rain at 45. Not even close to “33 and rain”
-
OP run is warmer for Wednesday. More of a CNE deal.
-

Is we back? February discussion thread
Damage In Tolland replied to mahk_webstah's topic in New England
Hopefully Euro follows suit . Need that boundary pressed down to Philly -
Euro is also now on board with a coastal storm on the 23rd.
-

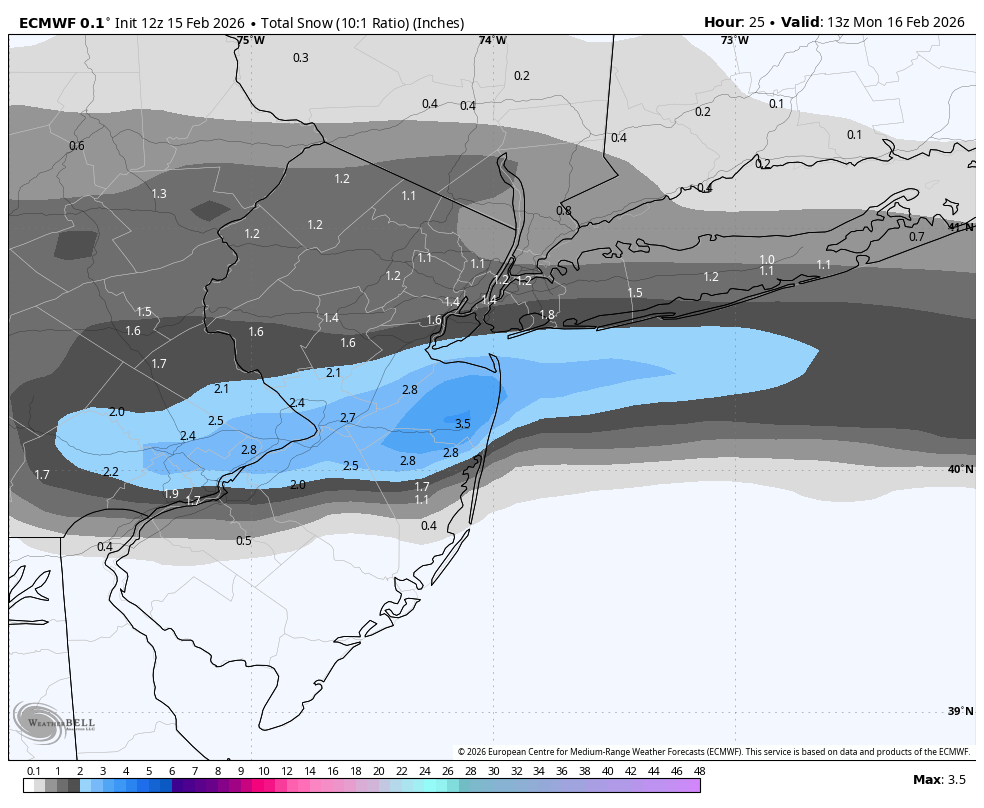
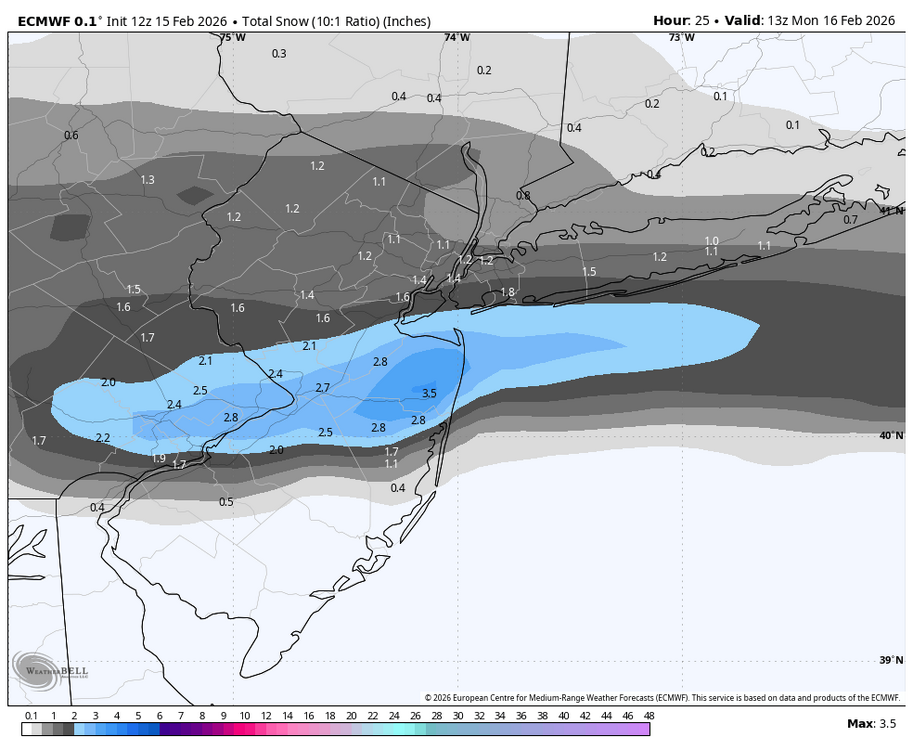
Early Monday morning 2/16 last minute event OBS/Discussion
The Iceman replied to The Iceman's topic in Philadelphia Region
It never fails! 36 hours out! -
Euro is also now on board with a coastal storm on the 23rd.
-
Maybe even more near the south shore
-
Still 37.7/36.9 at 12:45 pm with light rain and fog. About 1/3" has fallen since 7 am CoCoRaHS report.
-
Yeah euro skynet is pretty cold for both smaller waves (Wed and Fri)…the Wed event is pretty suppressed on that model. Doesn’t get precip north of pike.
-
Earned the right to be snarky for sure, just pointing out that euro ai isn’t gonna be easy to verify
-

Late February/Early March 2026 Mid-Long Range
SnowenOutThere replied to WxUSAF's topic in Mid Atlantic
This winter has seemed like a lot of it’s a week away threats. Ofc, none of them had high probabilities of hitting but the fact only one of them (and it was the only STJ wave so higher confidence further out) did anything is pretty unlucky. -
True, I wouldn’t take my chances either
-

Late February/Early March 2026 Mid-Long Range
EastCoast NPZ replied to WxUSAF's topic in Mid Atlantic
Good thing we're so good at threading needles! -
The site also looks like it’s missing Nov 10-12, 1987 for the early season notable storms. Oct 10, 1979 is another good one.
-
Is we back? February discussion thread
Damage In Tolland replied to mahk_webstah's topic in New England
Is it colder for the middle and end of week waves? Like snow/ice? -
This is a very weird winter. If it is this dry in June-August we are in trouble. As much as I love the blue bird days…
-
Thanks! I just noticed the other sections for the May 2002 and Oct 2020 events. I have snowfall map booklets from a private wx company I worked for in the late 80s/early 90s that lists all snow events from the 1970s to the mid-1990s. Let met dig those out of storage at home and I'll give you a list of the more significant ones. Here's one from Mar 22, 1977 I can recall offhand. A blockbuster coastal storm lashed New York and New England. Norfolk, Connecticut was buried under 33 inches of snow. 24 inches was reported at Pittsfield, Massachusetts and 18 inches piled up at Gardner, Massachusetts. Snow amounts exceeded 30 inches in the Catskills in southeastern New York. 3 to 5 inches of rain deluged south coastal New England and wind gusts reached 60 to 90 mph. A 450 foot radio tower in Framingham, Massachusetts was toppled by the high winds. Oh and this one! Oct 3-4, 1987 A rapidly deepening coastal storm dumped record early snows in eastern New York, western Connecticut, western Massachusetts, and southern Vermont. Grafton, New York was buried under 22 inches and Pownal, Vermont recorded 18 inches. This was primarily an elevation storm but even Albany, New York received 6 inches of very wet snow. Damage to trees was extensive since many of them were still in full leaf. Road crews had to scramble to get their plows on as the snow caught everybody off guard. Not sure if you include very localized events, but this is one of the most impressive NORLUNs in SNE in the past 35 years. Feb 19, 1993 Intense ocean effect snow squalls buried Chatham, Massachusetts under 20 inches of snow. Snow fell at a rate of 4 inches per hour for 3 consecutive hours. A "NORLUN" instability trough was responsible for this event.
-
How many times have we seen this map on either the Euro or EuroAI? Crazy. But they have yet to be correct. And no, I don't consider 1/25 anything close to this map or previous similar ones this year.
-
Based on 500mb vort, euro ai is a thread the needle timing play for next weekend. Will have to wait to see more support from other models by Wednesday
-

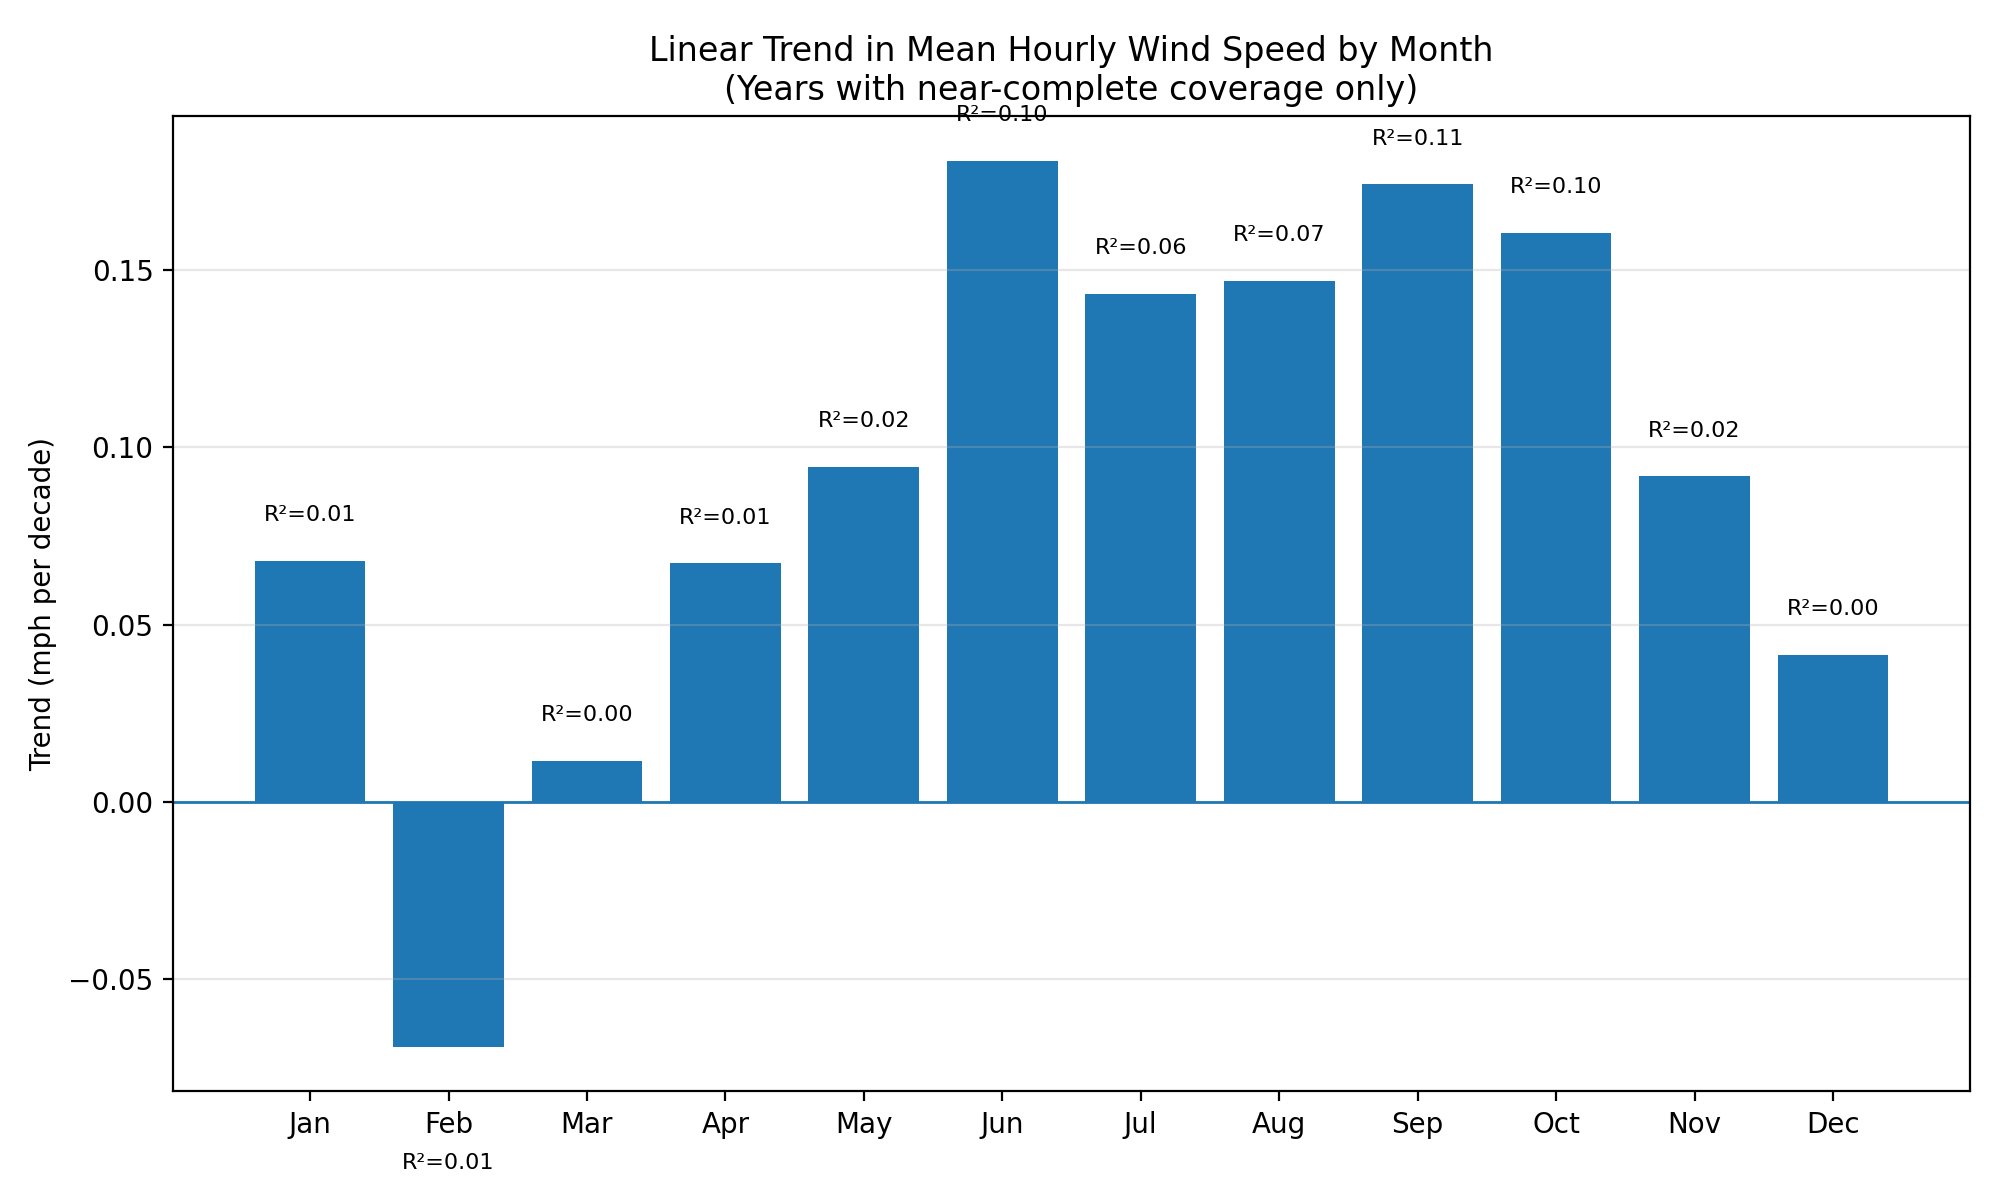
Central PA Winter 25/26 Discussion and Obs
Jns2183 replied to MAG5035's topic in Upstate New York/Pennsylvania
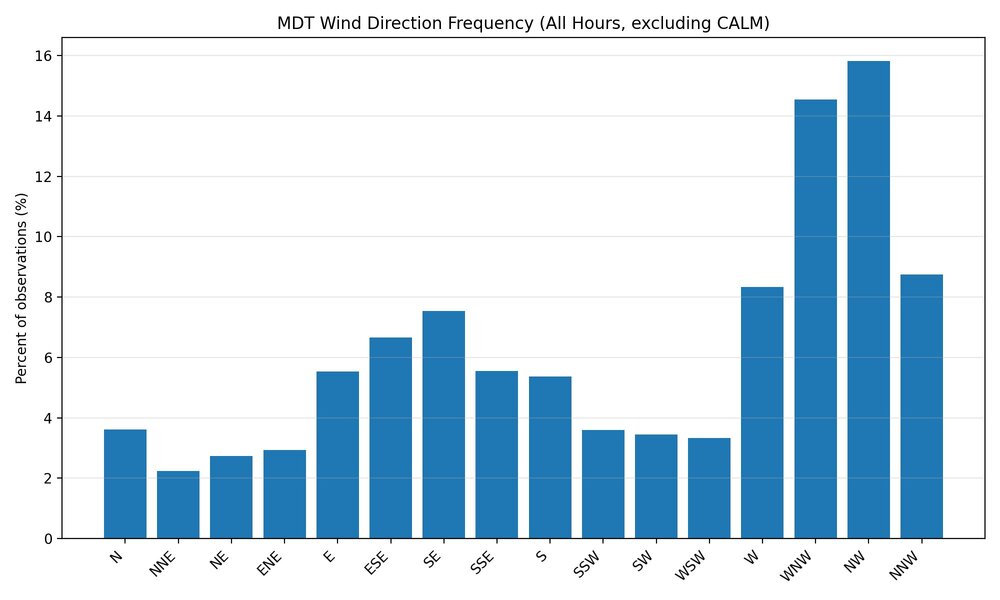
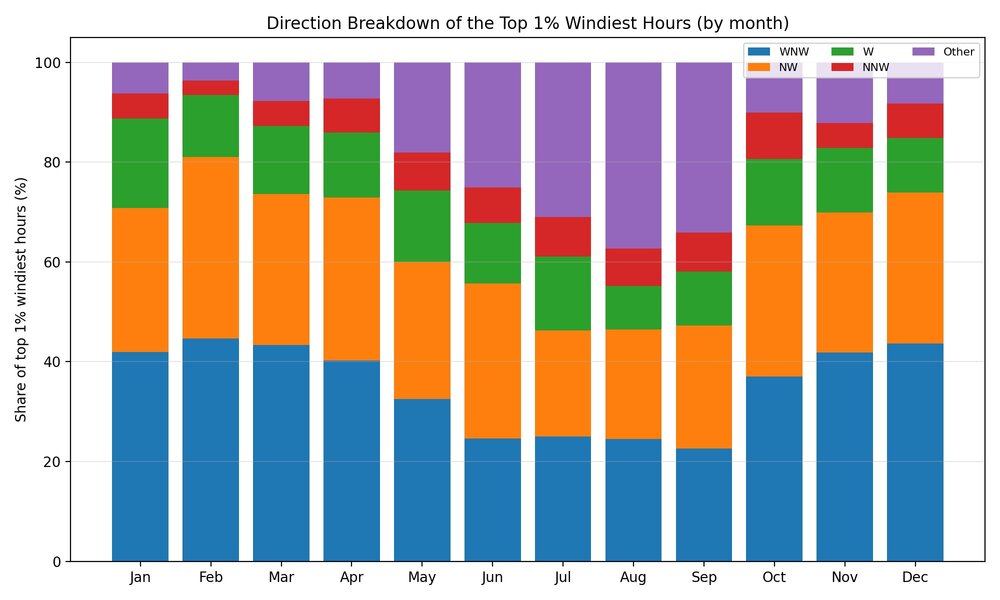
@canderson this is for you buddy. I analyzed wind over the past 90 years. The biggest issue is reliable hourly wind gust data isn't available until the mid-90s. But Bottom line Mean sustained winds: slightly up (tiny trend, noisy). Top 1% sustained winds: slightly up (even noisier). Gusts: “mean gust” trends are not trustworthy without adjusting for measurement practice changes; extreme gusts look mostly steady. Quantity vs speed: quantity is basically flat; any change is more “speed nudge” than “more windy hours.” the key nerd truth: gust trends are extremely sensitive to “are we comparing apples to apples” (instrument/reporting regime). So I ran it two ways: 1) Modern period, all years available (1996–2024) This uses all years in 1996–2024, but note gust/peak-gust availability varies a lot year to year. What the raw trend says (per decade): Mean sustained speed: –0.65 mph/decade (R²≈0.31) Top 1% sustained speed (P99): –1.18 mph/decade (R²≈0.28) Mean hourly gust: –1.16 mph/decade (R²≈0.21) Top 1% hourly gust (P99): –2.99 mph/decade (R²≈0.20) Mean “peak gust within hour”: –0.49 mph/decade (R²≈0.13) Top 1% peak gust (P99): –1.12 mph/decade (R²≈0.05) Interpretation: those big negative trends are a flashing red sign for reporting/instrumentation mix effects, not “Harrisburg winds are collapsing.” So we do the sane thing… --- 2) “Apples-to-apples” subset: years with consistent gust coverage (2008–2024) I restricted to years where gust and peak-gust are recorded a lot (so the metric isn’t biased by selective missingness). That leaves 2008–2024 (14 years). Intensity trends (mph per decade) Mean sustained speed: +0.13 mph/decade (R²≈0.05) → basically flat Top 1% sustained speed (P99): –0.75 mph/decade (R²≈0.09) → basically flat/noisy Mean hourly gust: +0.87 mph/decade (R²≈0.33) → modest upward signal Top 1% hourly gust (P99): +0.84 mph/decade (R²≈0.06) → weak/noisy Mean peak gust: –0.08 mph/decade (R²≈0.00) → flat Top 1% peak gust (P99): +0.98 mph/decade (R²≈0.05) → weak/noisy Quantity trends (frequency; percentage-points per decade) Computed as “of gust observations that exist, what % exceed threshold”: Hourly gust frequency: Gust ≥30 mph: +4.23 pp/decade (R²≈0.28) Gust ≥40 mph: +0.80 pp/decade (R²≈0.08) Peak-gust-within-hour frequency: Peak ≥40 mph: –1.48 pp/decade (R²≈0.03) → flat/noisy Peak ≥50 mph: +0.62 pp/decade (R²≈0.12) → weak/noisy Interpretation: In the most consistent era, the cleanest “signal” is more frequent ≥30 mph gusts (quantity), while the top 1% intensity is mostly noisy/flat. Sustained hourly speed looks basically flat. --- Your “Speed or quantity?” question — answered For sustained winds: neither intensity nor frequency screams “up.” It’s mostly flat in the consistent-era view. For gusts: the best-supported change is quantity (more ≥30 mph gusts), while “top 1% intensity” is not robust (too noisy + sensitive to measurement definition). If you want, I can tighten this even further by: using seasonal bins (DJF/MAM/JJA/SON) for gust thresholds (often cleaner than annual), and/or using percentiles computed from a fixed reference period (e.g., define “top 1%” using 2008–2014 and apply it to all years) so “top 1%” doesn’t move just because the distribution shifts. Sent from my SM-S731U using Tapatalk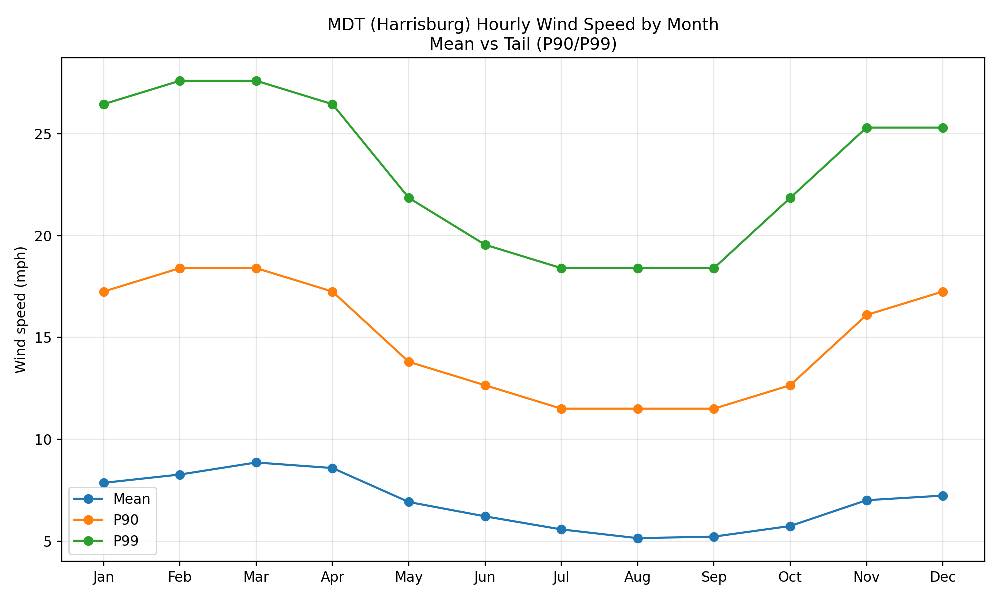

-
decent lol. Its a hecs compared to what we have had since 2016
-

Pittsburgh/Western PA WINTER ‘25/‘26
EVLINC64 replied to Burghblizz's topic in Upstate New York/Pennsylvania
https://www.weatherbell.com/ watch the Saturday Summary -
Shucks. Pdiii(once removed)