All Activity
- Past hour
-

July 2025 Obs/Disco ... possible historic month for heat
Damage In Tolland replied to Typhoon Tip's topic in New England
86/73… aaahhhhh -
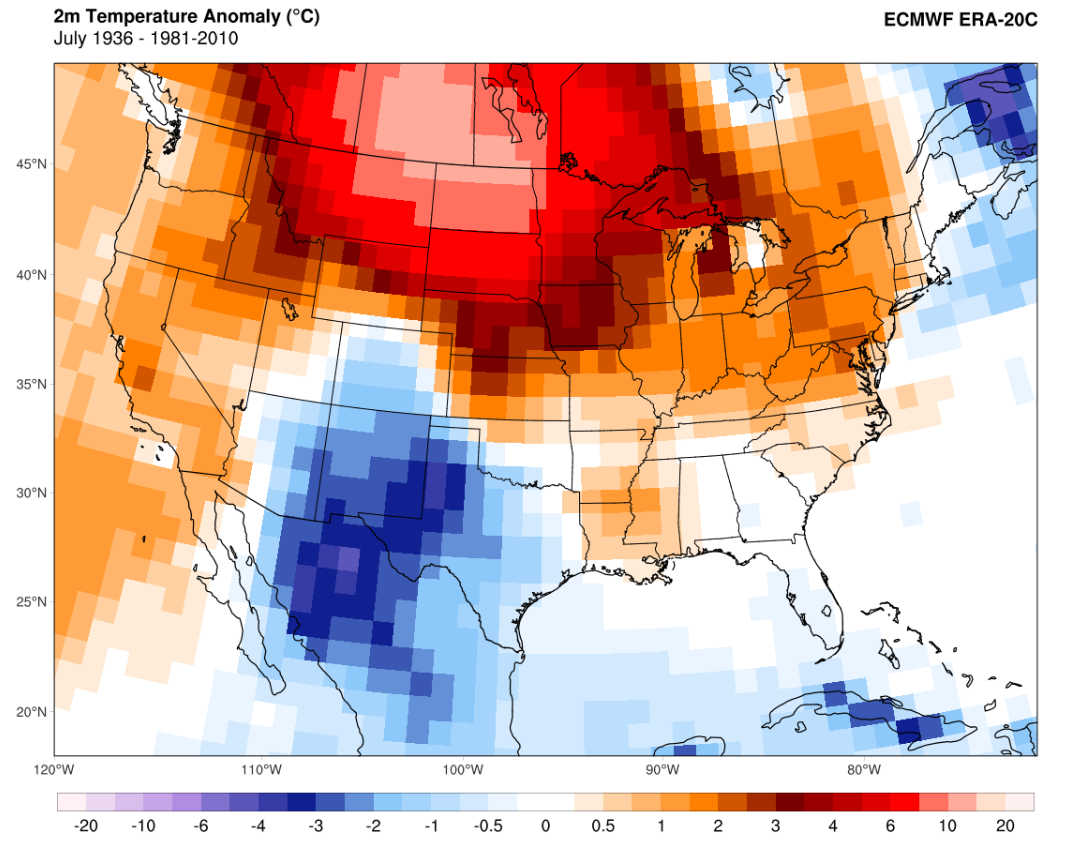
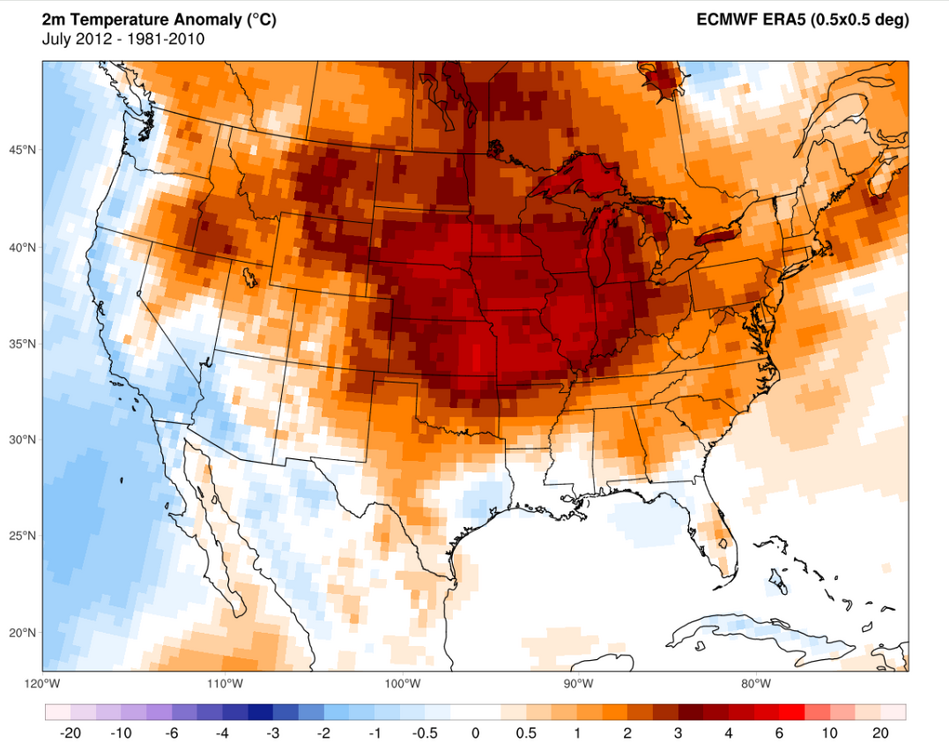
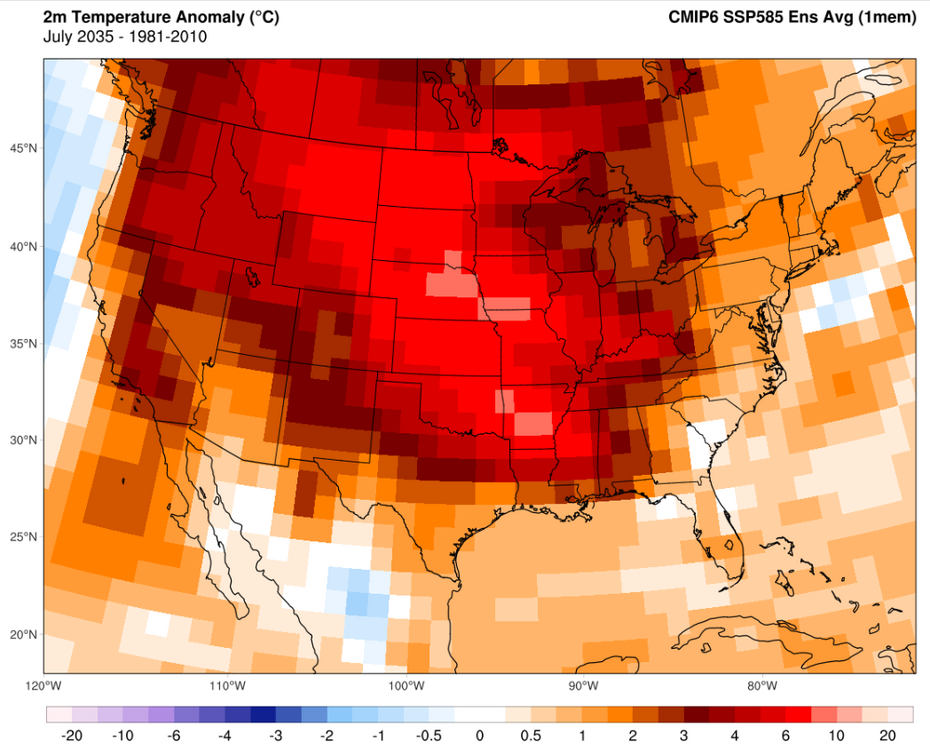
Yep. We're basically there now and the probability of it striking in any given summer has risen sharply. Going through SSP5 8.5 runs can give a feel for how bad it could get in 10-30y. For instance, it has summers occasionally far exceeding anything in the 1930s and 2012 by the *middle of next decade*. A few notes on that statement: While CO2 emissions are below 8.5 runs, radiative forcing and net energy imbalance is actually currently considerably *above* the 8.5 ensemble, mainly due to non-CO2 forcing being considerably above expectations -- and ECS/TCR might end up being on the hot side due to cloud feedback trends (detected by CERES). The most obvious brakes to this would be near term non-CO2 forcing slowdown, smoke aerosols (from extensive boreal burning -- seeing some of this already) and a weakening AMOC via differential hemispheric heating and a SMOC reversal (this too, may be in the early stages of happening). Regional trends are always a bear because transient climate responses can destructively or constructively interfere with the background trend and each other. A good example of this recently has been northern CONUS cooling in Feb-May due to a downstream response from rapid NPac cooling and cooling over the Corn Belt and adjacent areas from extensive evapotranspiration in Jun-Aug that has exchanged increased humidity for lower summer temps. These are transient responses -- and could and probably will unravel as the NHem temp response increases. Perhaps more importantly, one striking feature in future runs is the ever-present ability of intra-seasonal and intra-annual forcing to temporarily overwhelm and unravel those transient responses and result in an explosive, high volatility move that seems to come from nowhere and create conditions that seem to detach completely from the existing probability curve. The damping is removed and, like a coiled spring, the "true PDF" is revealed. These will tend to cause the most damage because of their inherent year-to-year unpredictability. A CMIP-6 run shows an example what that might look like (July 1936 and July 2012 are thrown in for good measure here): Far more extreme events in general start to occur as the NHem circulation is disrupted by the permanent collapse of summer sea ice in the late '30s-40s and by the time we hit 2050 we open up "lights out" events where temps and precipitation could destroy the existing plant stock and most of those year's crops. Events so intense and long that we could see our first "year without a winter".

-

July 2025 Obs/Disco ... possible historic month for heat
ineedsnow replied to Typhoon Tip's topic in New England
86/66 -
Will be interesting to watch.
-
July 2025 Obs/Disco ... possible historic month for heat
ineedsnow replied to Typhoon Tip's topic in New England
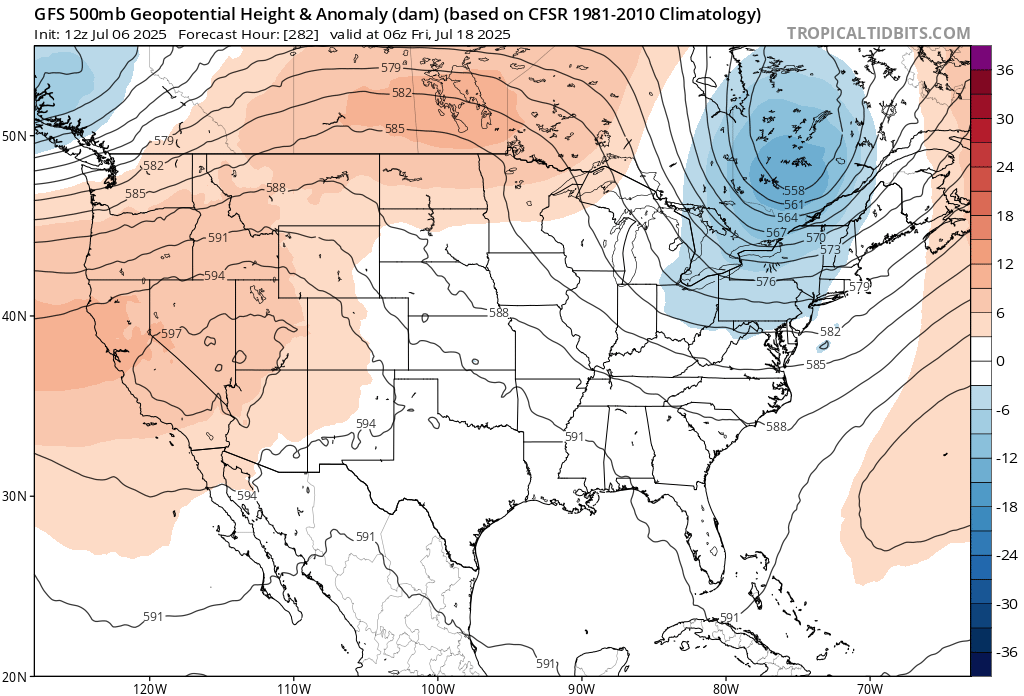
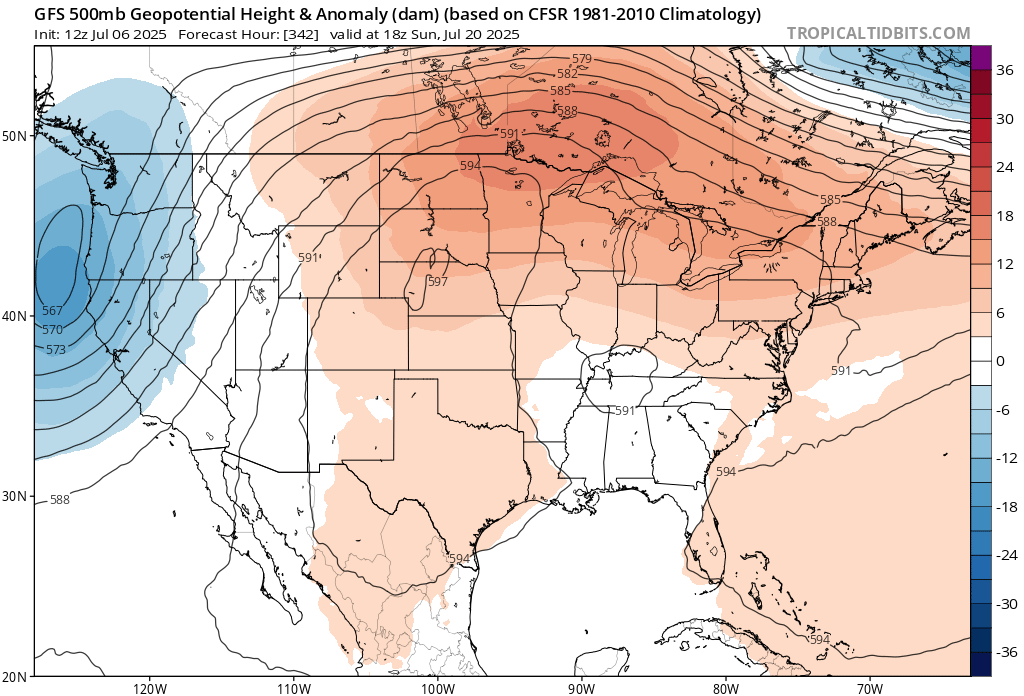
Heights getting pushed back down at the end of the run.. we take -
July 2025 Obs/Disco ... possible historic month for heat
DavisStraight replied to Typhoon Tip's topic in New England
87/72, nasty out there today -
Interesting, thought it be higher up my way.
-
I already gave the JMA credit for seeing the record TNH pattern for the 13-14 winter.

-
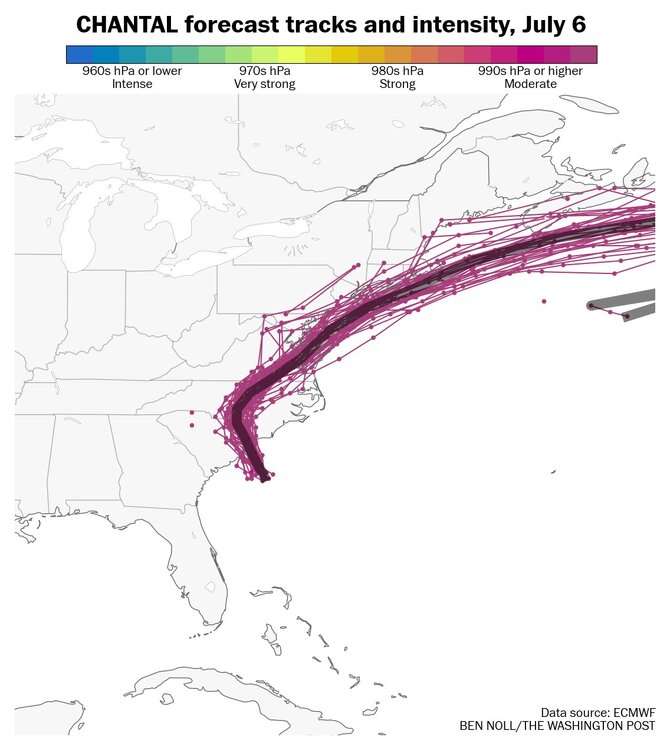
Convection and showers already moving North in the Southern most extent of the area.
-
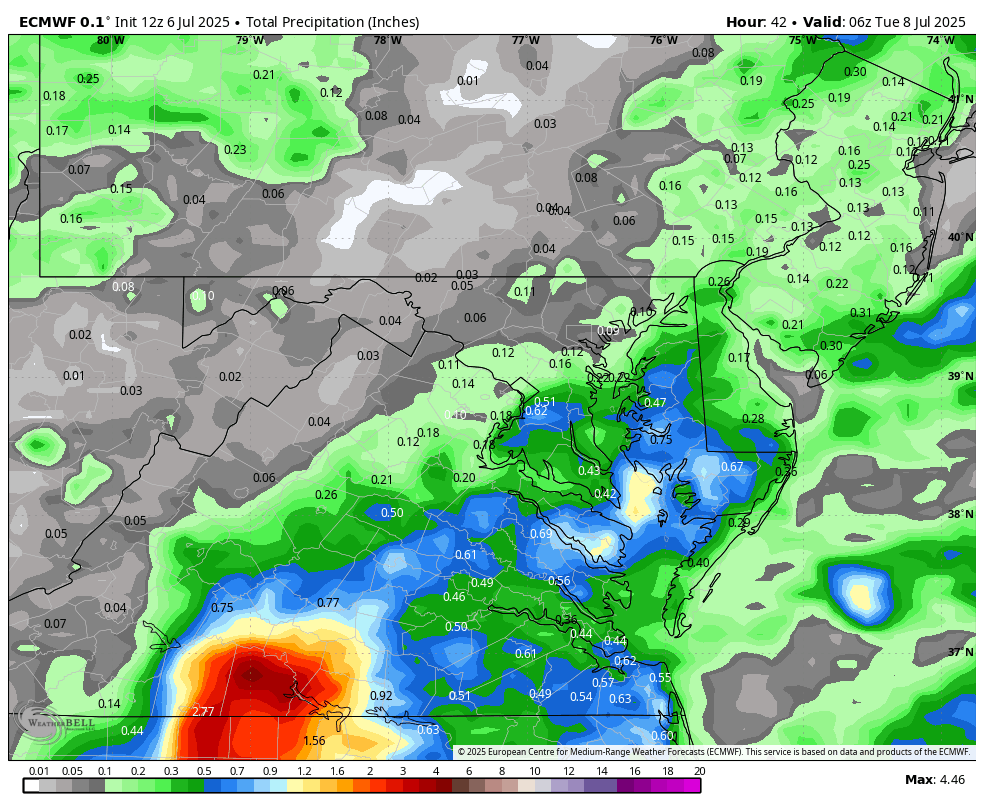
WB 12Z EURO with rain totals through early Tuesday from remnants of Chantal.

-
Most recent Ray that what I was trying to say
-
July 2025 Obs/Disco ... possible historic month for heat
ineedsnow replied to Typhoon Tip's topic in New England
-
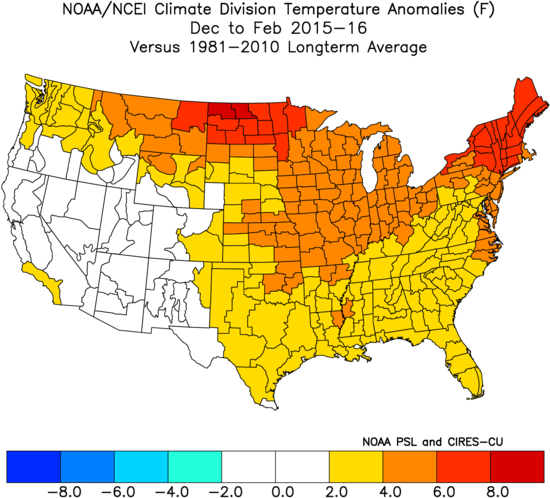
Unfortunately, the best I’ve found archived is the 0.5 month lead like I posted. They did pretty well in Nov of 2015 for DJF 2015-6: I give them a B for the US as a whole -They did so-so in Nov 2016 for DJF 2016-7: my grade C for US overall -NOAA did well in 11/2017 for DJF 2017-8: A -They were absolutely awful in 11/2018 for 2018-9: F -2019-20 mediocre at best: C -2020-1 poor: D -2021-2 pretty good: B -2022-3 pretty good: B -2023-4 very good: A -2024-5 lousy: D —————— Summary of my overall US grades of Nov NOAA probabilities for DJF temps: 2013-4: C 2014-5: B 2015-6: B 2016-7: C 2017-8: A 2018-9: F 2019-20: C 2020-1: D 2021-2: B 2022-3: B 2023-4: A 2024-5: D Tally: A: 2 B: 4 C: 3 D: 2 F: 1 NOAA GPA for 0.5 month lead of last 12 DJF for US as a whole: 2.3/C+ (not bad)

-
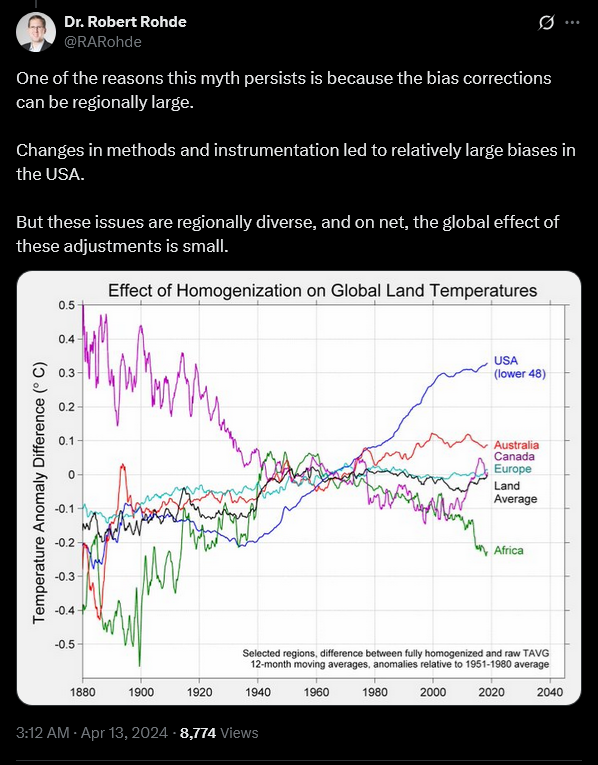
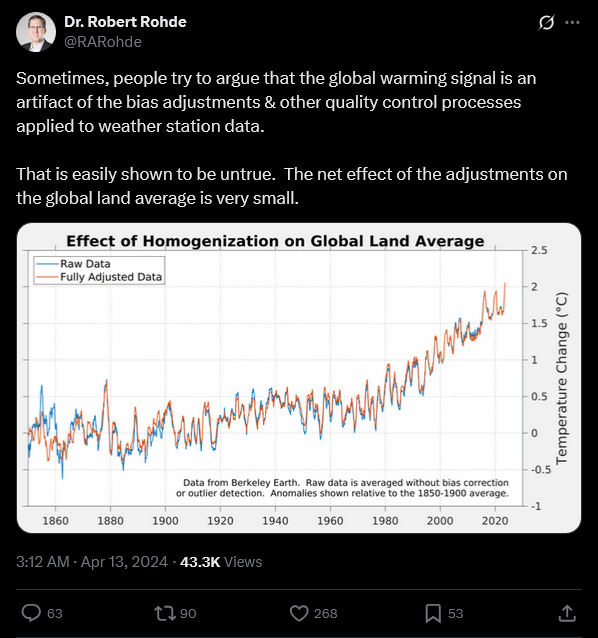
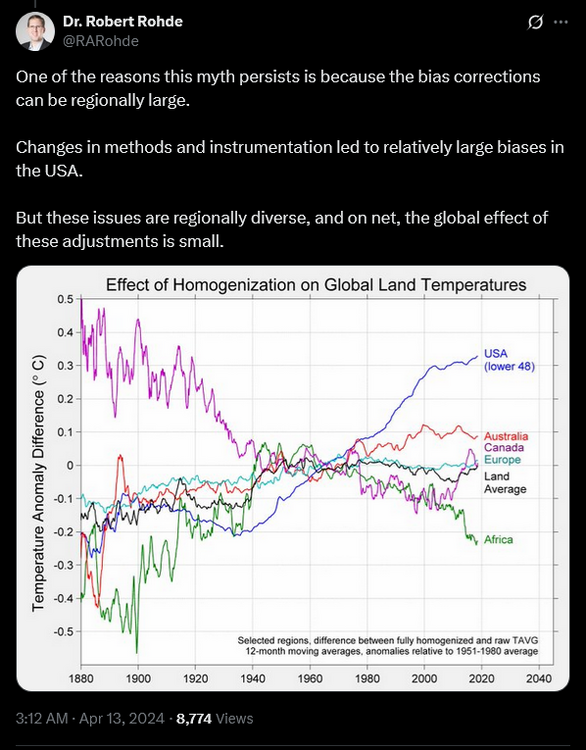
You complain about being called a denier; but, your posts are the same old denier talking points or charts. Long debunked. Science has moved on from this issue decades ago.
-
July 2025 Obs/Disco ... possible historic month for heat
Damage In Tolland replied to Typhoon Tip's topic in New England
I couldn’t have timed that any better. That strike was right here . That’s anyone’s reaction -

July 2025 Obs/Disco ... possible historic month for heat
dendrite replied to Typhoon Tip's topic in New England
Cowering in a ball like wizzy seeing a garden spider. -

July 2025 Obs/Disco ... possible historic month for heat
kdxken replied to Typhoon Tip's topic in New England
How come you always come on here and ruin things? -
July 2025 Obs/Disco ... possible historic month for heat
kdxken replied to Typhoon Tip's topic in New England
80-100 maybe? Certain parts are Sandy and they do like that area. Super tall, it's the one on the left in this picture.
-
July 2025 Obs/Disco ... possible historic month for heat
Damage In Tolland replied to Typhoon Tip's topic in New England
From the prolific lightning storm on July 1. This was a top one for me.Sound up ! https://ring.com/share/8241075f-eb3a-4d8e-aeda-53de2581ec00 -

E PA/NJ/DE Summer 2025 Obs/Discussion
RedSky replied to Hurricane Agnes's topic in Philadelphia Region
The NAM's and the GFS only showing .25" or less from the depression rains that has to be wrong -

July 2025 Obs/Disco ... possible historic month for heat
powderfreak replied to Typhoon Tip's topic in New England
Yeah good luck with that trough that 48 hours later goes back to big ridge.

-
July 2025 Obs/Disco ... possible historic month for heat
ineedsnow replied to Typhoon Tip's topic in New England
We 12z GFS -
Are there any wildfires going on in PA? We've got a Phoenix AZ type brown haze here in Tamaqua and the air has a bit of a smoky smell.
-
Ill believe it when I see it. Ive been hearing this for 2 decades now and still nothing close to rival those 1930s-50s heatwaves in terms of frequency, magnitude, and days in the 90s/100s here. In 2023 Detroit didnt eclipse 90° for the first time since 1915. Every single year in the aforementioned decades there was bad heat, some worse than others. Certainly some was dry, but not all. But the ENTIRE point of my post was the fact that there was no AC. Ive been researching the daily newspapers and it wasnt just the occasional deadly heatwave. Each summer in those years was filled with deadly heatwaves with the fatalities often listed in the papers. We know how bad tornadoes are for death, but in the pre-AC days the mere summer temperature was the most deadly aspect of the weather.
-

2025-2026 ENSO
Stormchaserchuck1 replied to 40/70 Benchmark's topic in Weather Forecasting and Discussion
9 day lead though.. I'd rather see what their forecasts looked like 3-6 months in advance.