All Activity
- Past hour
-
 ALB with 4.95” so far.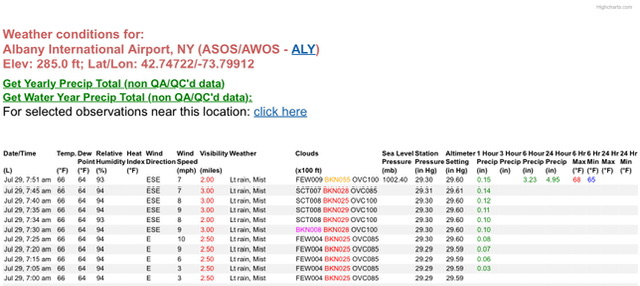
-

Dewgust 2026: Summer's Last Stand
Prismshine Productions replied to Prismshine Productions's topic in New England
Nobody would complain in winter lmao Sent from my SM-S176V using Tapatalk -
Ended up at 2.56 inches total
-
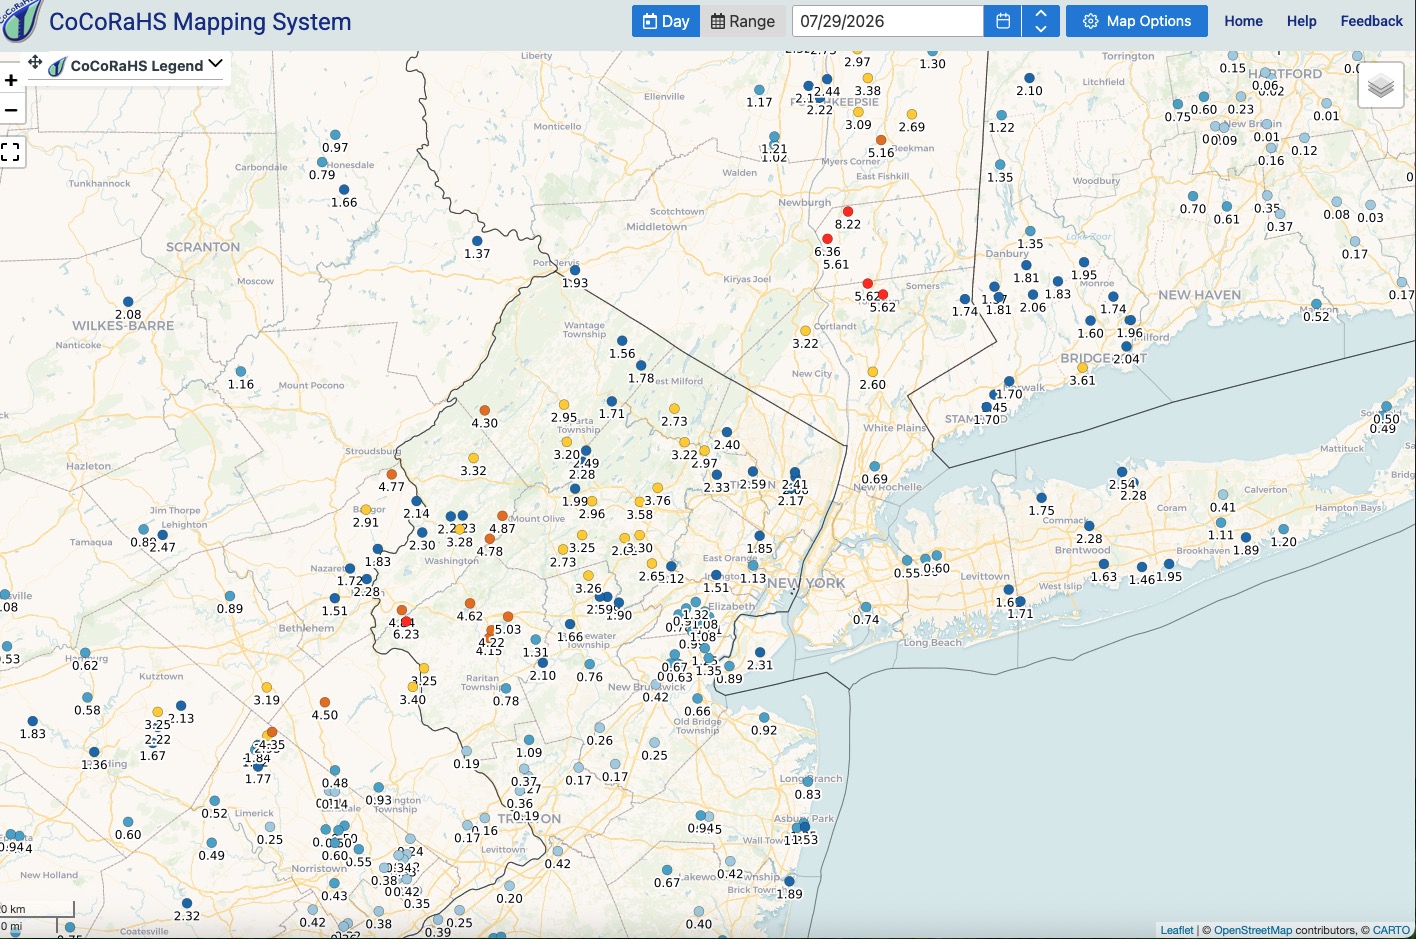
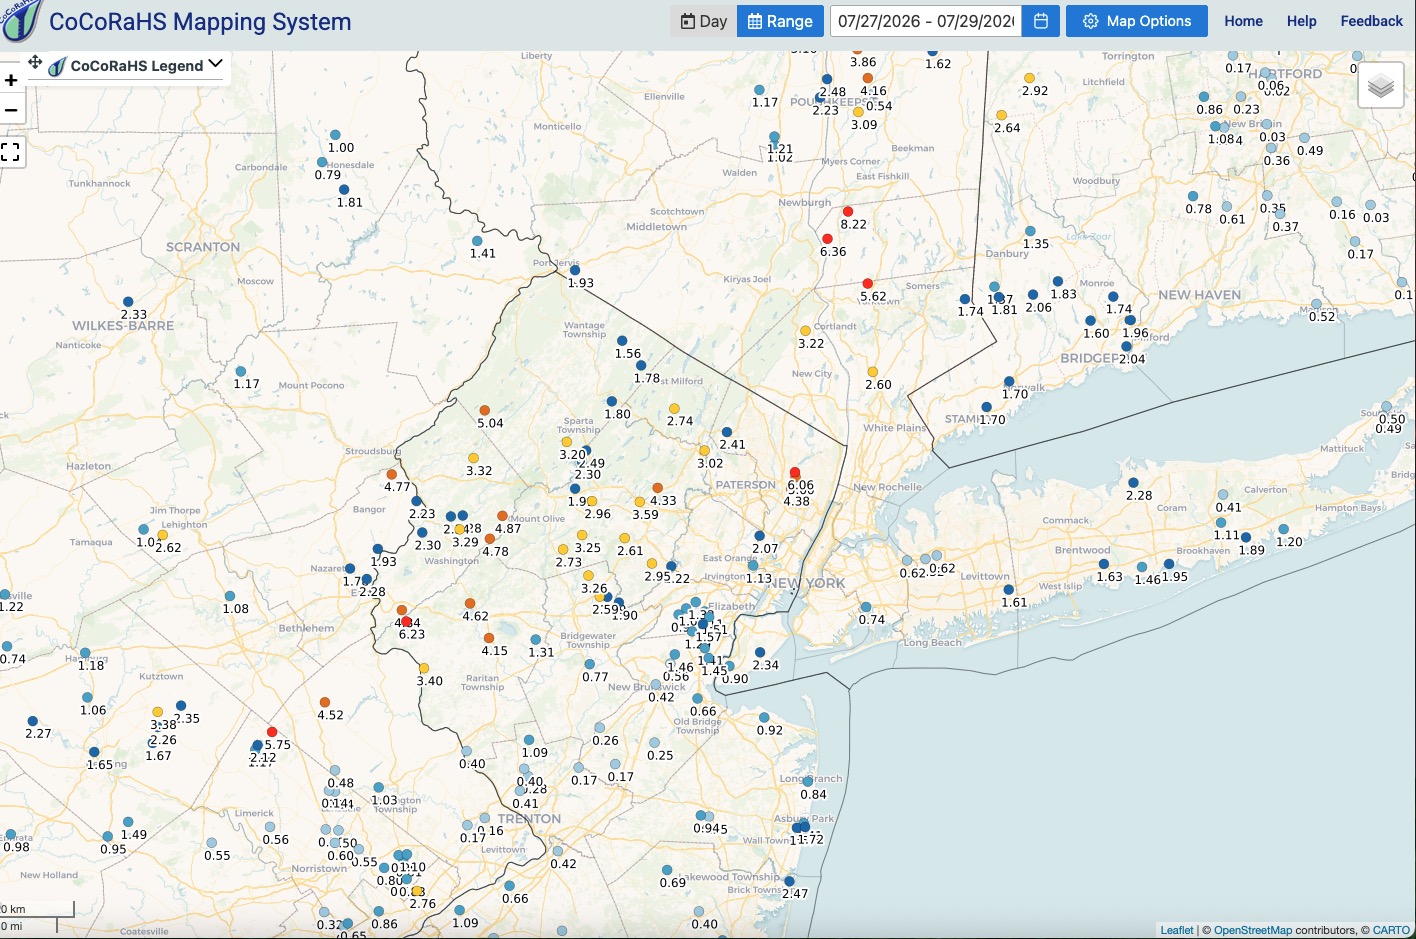
One and two days totals: Click map to enlarge.
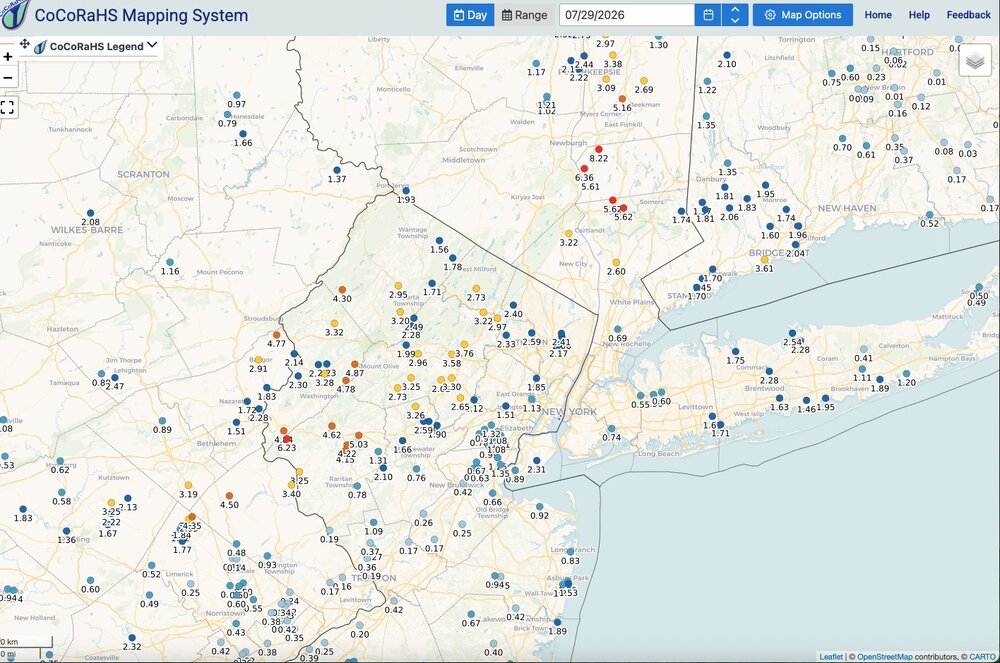
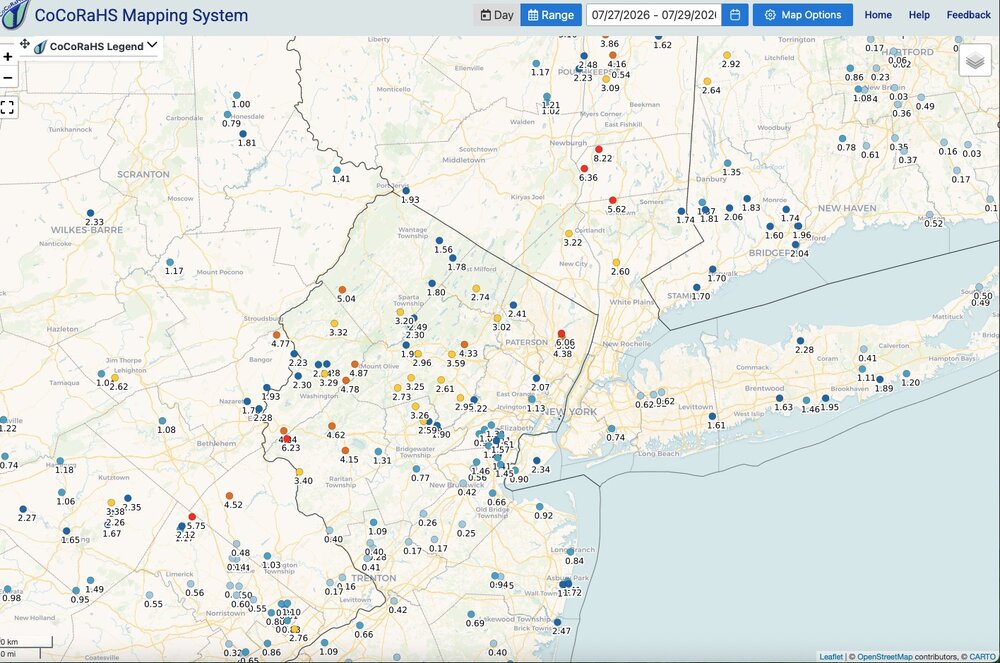
-
 You’ve been complaining about Stein for months and you’ve had a May-Jun-Jul of 13” and counting so you can just
-
.85 total at my station
-
I think all my rain this month fell on 3 days lol
-
My only guess is the relatively recent change of the 0.3° beam angle. With a cool season like storm and “flatter” beam they’re returning a lot of area in the mixed-phase layer.
-
One of the lucky ones here in moco yesterday, about an inch fell in an hour as that line grew and sorta stalled for a bit north of DC. Looking green and fresh this am.
-
 That you’re ok
 -
 Keep it south don't need it here.
 -

Dewgust 2026: Summer's Last Stand
RUNNAWAYICEBERG replied to Prismshine Productions's topic in New England
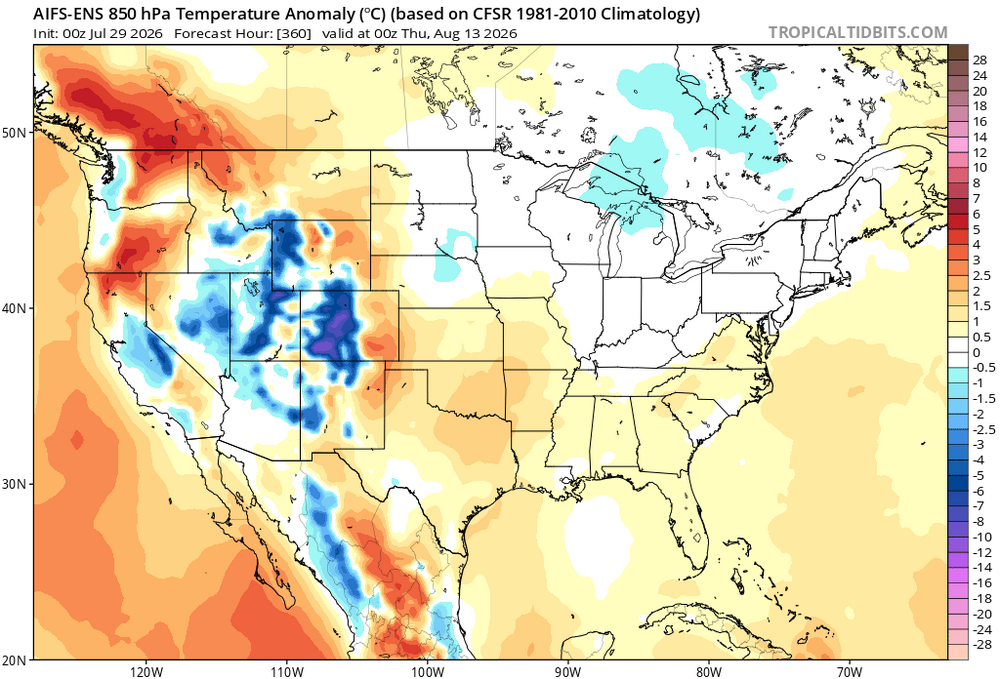
We may never get a break from all this hhh…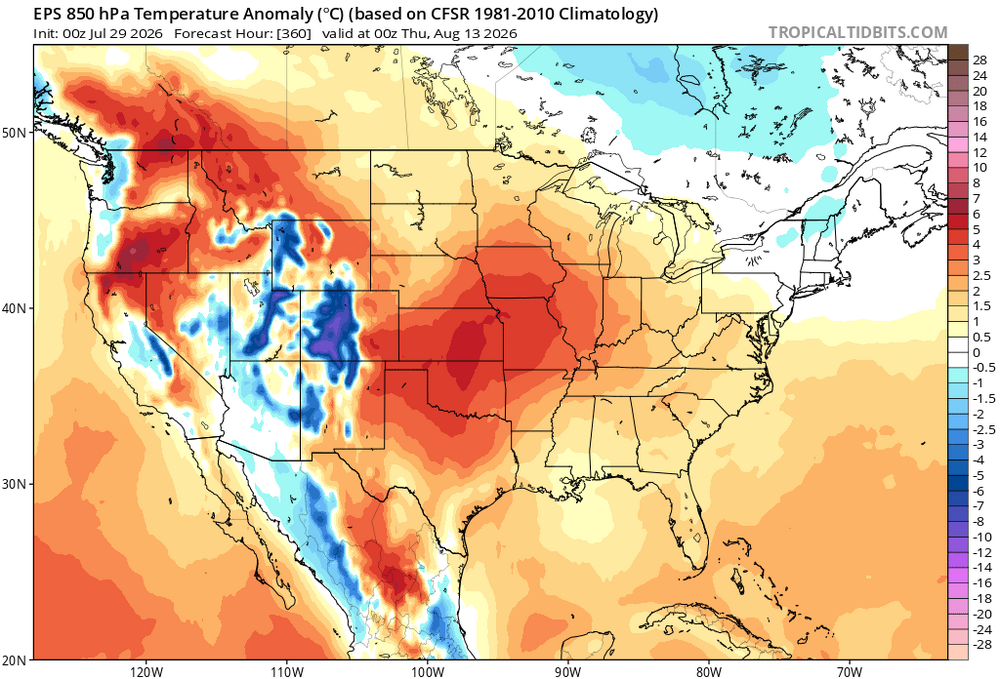
-
 Looks like Eastern Connecticut, Rhode Island and Southeast mass are up next for some good heavy downpours
 -
5.61” I also had 10” in 2009. Point?
-
I know, but today it looks exceptionally bad.
-
And you had 9” in June
-
Glue factory
-
5.46” vs 0.95” MTD
-
-
You have more than me lol
-
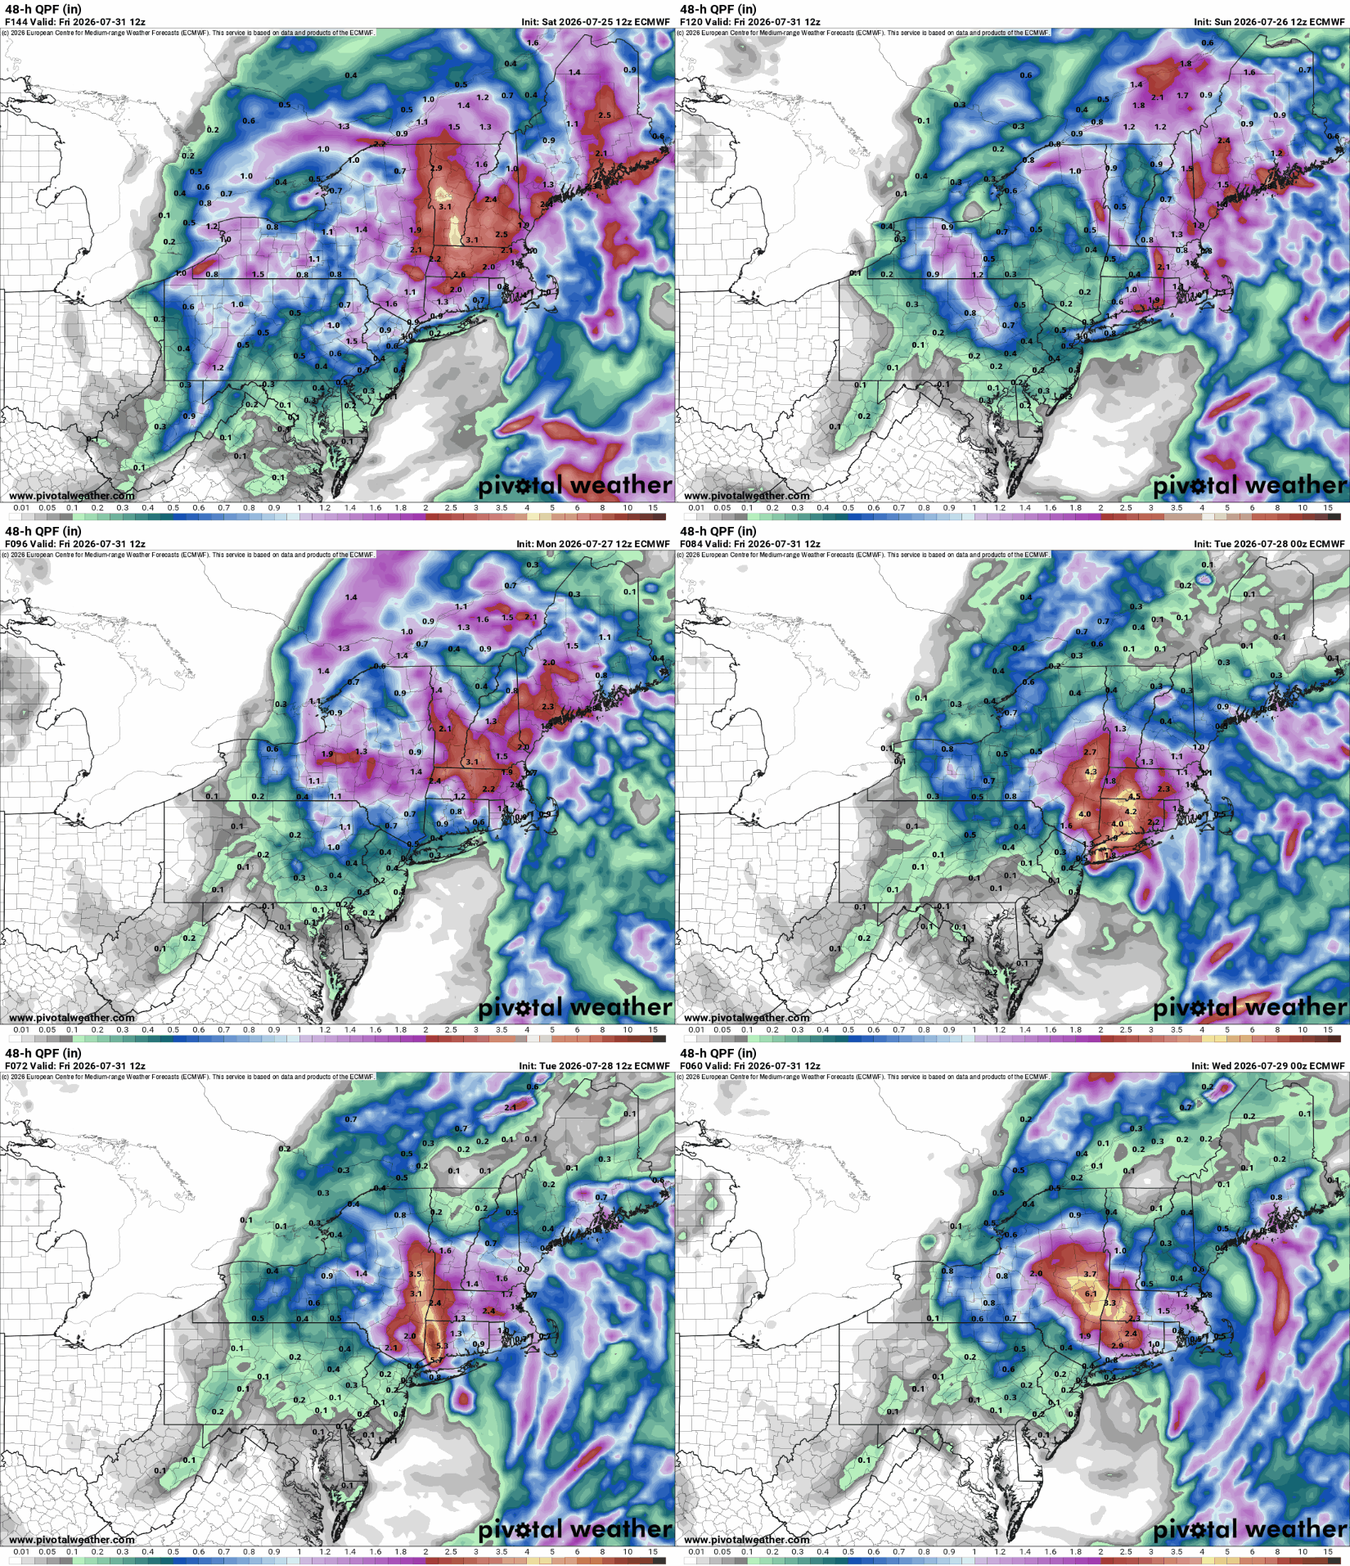
fri/sat looks p locked in for another widespread soaker as we close out the month
-
6z HRRR is like 0.25” here. Euro isn’t much better. Holy hell.
-
 I get it, and mostly understand it. my point is this: we are all weenies, hobbyists, and meteorologists here, so I'd say that this forum gets it. But what does the general public think that map means? i am sure more than one twitterologist has posted that map with no context.
 -
this event went pretty hard through a densely populated area right in the middle of our sub and only managed three pages, you can tell seasonal posting fatigue is settling in
-
 What’s your call for SE Mass