All Activity
- Past hour
-
mostly 50's and 60's, as we thought days ago. nbd
-

Occasional Thoughts on Climate Change
TheClimateChanger replied to donsutherland1's topic in Climate Change
I’ve read through the Christy & Spencer paper and I think it’s worth discussing, but a lot of the conclusions depend heavily on how the analysis is set up. First, it’s U.S.-only, which already limits how broadly you can interpret it. The U.S. is a small, noisy region with a lot of land-use influence, and it’s not necessarily representative of global behavior. Second, they lean on minimally adjusted station data, which is not a neutral choice. One big issue there is time of observation bias (TOBs)—earlier stations often used afternoon observation times, which can effectively double-count hot days across two calendar days. That tends to inflate extreme heat in the early part of the record relative to today, when observations are mostly taken in the morning. If you don’t correct for that, you’re giving early decades a built-in advantage in heat extremes. On top of that, the way “extremes” are counted matters a lot. If you’re relying on record-setting events and not handling ties properly (or only counting first occurrences), later decades are inherently disadvantaged. Early in the record, everything is a “new record.” Later on, even in a warmer climate, you’re more likely to tie or narrowly exceed previous values. If ties aren’t treated equally, you can manufacture a downward trend in “new extremes” even if the underlying distribution is shifting warmer. Another big limitation is that the analysis focuses almost entirely on summer high extremes and winter low extremes, which is a pretty narrow slice of the climate system. It doesn’t really tell you anything about extreme warmth in winter, spring, or fall—which is where a lot of the warming signal actually shows up—or about the broader shift in temperatures. Summer daytime highs (Tmax) are one of the least responsive variables in many parts of the U.S., especially in the East. And this is where land-use changes become critical. The eastern and central U.S. have undergone significant reforestation over the past century after being heavily clear-cut, which increases evapotranspiration and tends to suppress daytime highs. At the same time, the Midwest has seen an explosion in corn and soybean agriculture, and those crops transpire enormous amounts of water—far more than the historical landscape. That effectively adds a massive, artificial cooling mechanism during the growing season. So you’ve got large parts of the country where land surface changes are actively dampening summer heat extremes, even as the broader climate warms. Meanwhile, more arid regions in the West—where you don’t have that same vegetation-driven cooling—show increasing heat extremes, which is more in line with expectations. On top of that, the 1930s Dust Bowl looms large in any long-term U.S. extremes analysis. That period featured extreme heat driven in large part by land degradation and drought—largely human-influenced surface conditions. If your methodology already favors early extremes (via TOBs and record-counting asymmetry), and you anchor the dataset with the most extreme decade in the record for partly non-climatic reasons, you’re stacking the deck toward showing a long-term decline. There are also the usual issues with long-term station data—station moves, instrument changes, siting differences, etc. Homogenization is meant to deal with those. Skipping it doesn’t remove bias, it just means you’re accepting a different set of biases, many of which tend to inflate earlier extremes relative to modern ones. To be fair, the paper is very likely correct that cold extremes are declining—that’s one of the most consistent and physically well-understood signals in the observational record. It’s also true that regional trends (especially in the U.S.) can look different due to land-use effects. But the headline claim about declining heat extremes is much more questionable and looks heavily dependent on methodology. At a minimum, this analysis is incomplete—it’s looking at a narrow set of metrics that are least likely to show strong warming signals and then generalizing from them. If you actually want to understand how extremes are changing, you need to look at the full temperature distribution, across all seasons, with methods that account for known observational biases and major land surface changes. -
Quickly turning into May 05. Sucks balls.
-
That early Mayorch storm looks like it could be a pretty solid snower. Similarities on modeling to the one in Mayorch, 1977.
-
Op runs don't look so bad for early May. Mixed
-
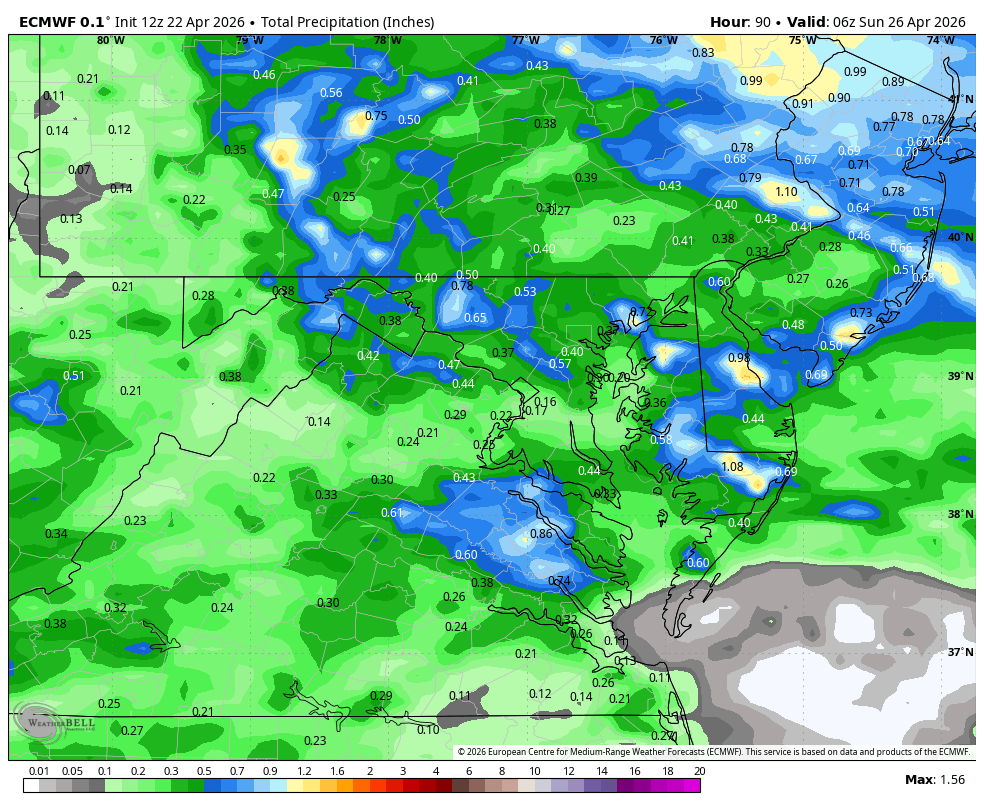
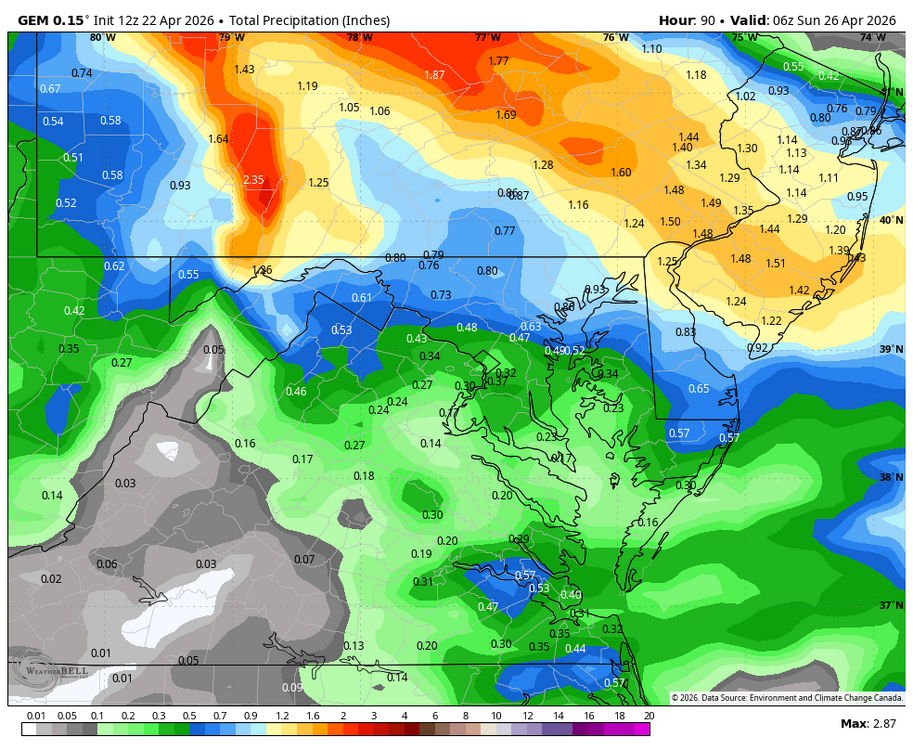
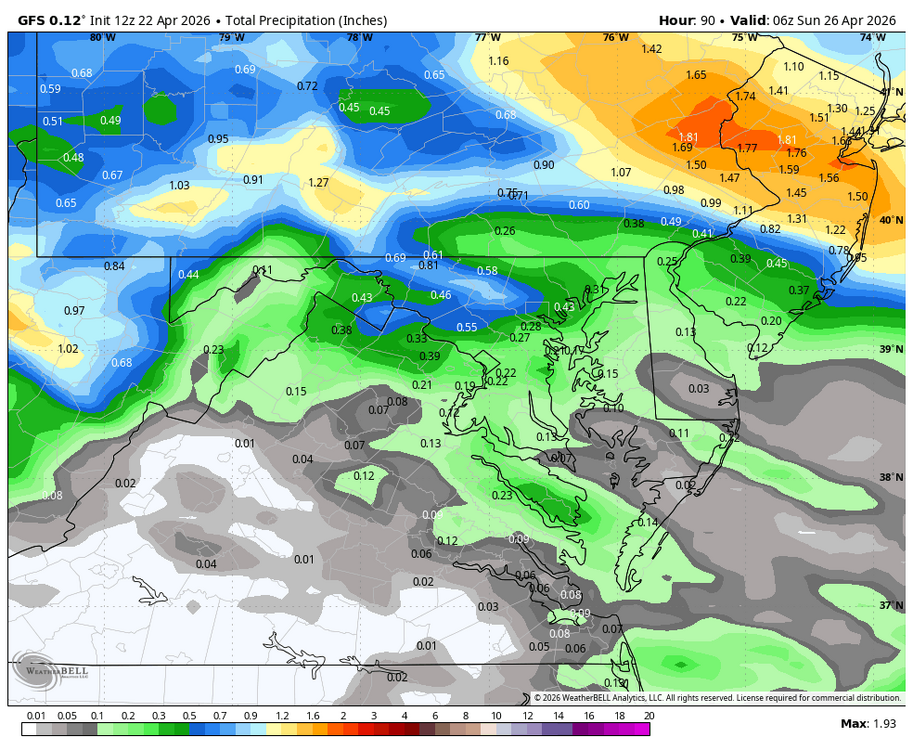
WB 12Z globals for the weekend.

-
100%. I have a '93 Craftsman that's still going strong. Just oil, batteries and one fix to the steering coupler.
-
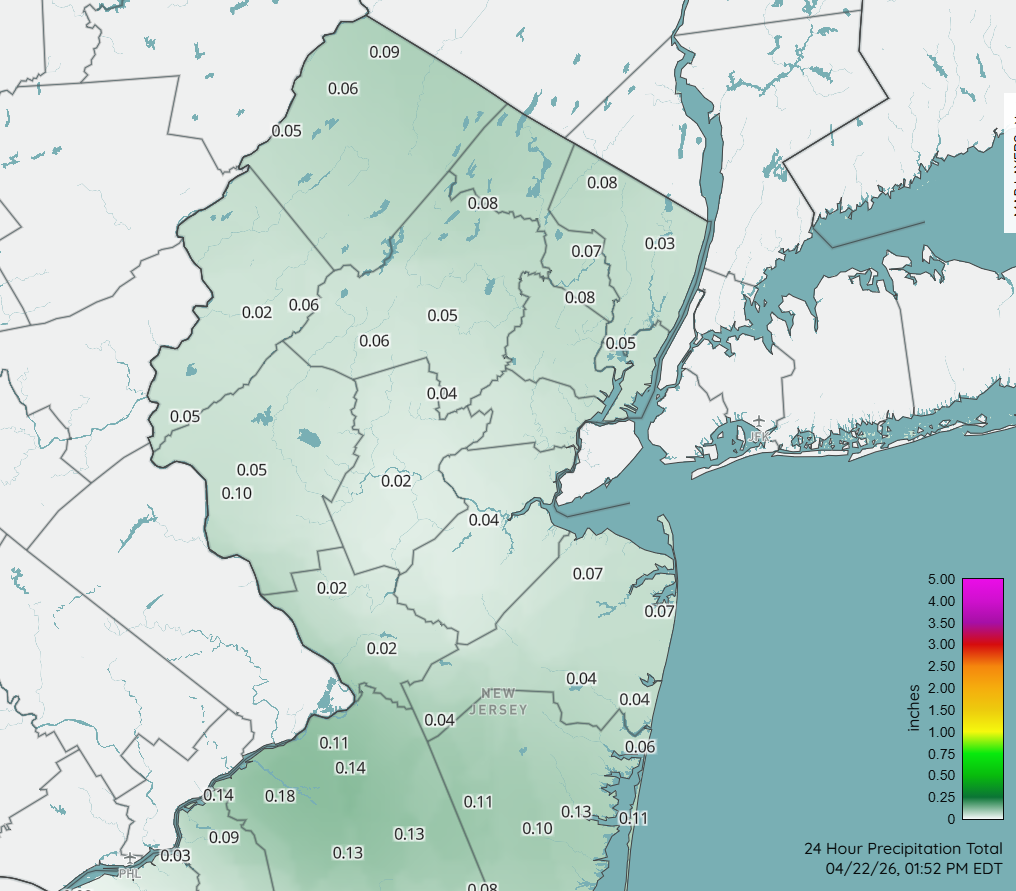
For NJ, I recommend this. And there's also CoCoRaHS, but most AM reports happened before all the rain had ended. https://www.njweather.org/maps/?refresh=1&map=precip_24hour

- 785 replies
-
- 1
-

-
- april showers bring may..
- rain
- (and 2 more)
-
Fuglies
-
Puklies
-
I like using wunderground and looking at stations around my house. NYMesonet is also good.
- 785 replies
-
- 1
-
-
- april showers bring may..
- rain
- (and 2 more)
- Today
-
textbook definition of mid. im basically gone for the entirety of may so im hoping this crap is out of here by june
-
I will say this....in NE TN, many of the tornadoes have been daytime recently. The one that did $30k worth of hail damage to my house was during the day. Now, when I lived in Knoxville...it was almost all nighttime. NE TN has to almost have a sustained SW to NE track of whatever system is required to produce tornado activity here. Derecho stuff sometimes will do it from the NW. But it requires a huge SW fetch to get that type of severe into NE TN. IDK...maybe that is why daytime threats are worse here. Knoxville and points west...totally different animal. I don't even know if I can name a daytime threat in Knoxville, but remember having to go to the basement many times as a kid at night during crazy bad storms. The '93 outbreak(college at UT at the time) I am pretty sure was evening or night...maybe during a Friends season final episode.
-
Ah hahahaha perfect!
-
Same ole story last 9 mos. Ridiculous
-
We were in Paris and then Switzerland a few weeks ago. Everyone spoke a bit of English everywhere we went. We did not rent a car at all and relied on public transportation exclusively. My advice would be to look into the Swiss Travel Pass and then download the SBB app which will give you all of the public transportation schedules. Once you get the hang of it it is extremely easy to get around. Happy to answer any specific questions as well.
-
Where is the best place to check how much rain a specific area received last night?
-
What the fuck are you rambling about now .I love summer and everything that comes with i. Don't psycho analyze me when its you who should be on the couch. The majority of time I am on a beach in a pool or walking down the street and swimming in the lake..This cold ruins my fishing. Only good thing is cutting trees and yard work is more invigorating. You need another outlet besides Frisbee golf. When all models were showing this colder solution and pattern change I posted what the weeklies also were showing. No one wants that shit Tip. So do me a favor and go find someone else for your analysis.
-
The weekend is now completely dry on 12z GFS. Sat into Sunday has a 90% chance of rain here per NWS point click
-
Yeah @jaxjagman Tennessee overnight is one of the highest state proportions in the Union. @Runman292 I was gonna say that's just since I moved here, lol! But Jax is right. Living in East Tennessee reminds me of living in eastern Kansas. Things get rockin' in the western part of the state, sometimes middle. Then the leftovers roll through at night. Occasionally it does start east and we get tornadoes too. Otherwise just like I now drive southwest to North Alabama, I used to drive southwest toward Wichita. Which brings us to Monday. Still looks possible Mid-South. Euro has the ol' east crap-out. Fresh 12Z GFS keeps it going. A lower scenario option is always the classic midday MCS shut-down. We'll see.
-
I don't really see any drought conditions in Frederick right now...certainly nothing like 2 summers ago when we became the Great Basin. Now we're more like Lincoln, NE.
-
Looks like I should have put down the dimension and grub X last Sunday while we had the rn. Nothing of significance in sight.
-
Ha! didn't y'all just have this exact same conversation two weeks ago? I don't get the impression you're succeeding in influencing that particular poster.. lol. Umm he's not inclined to agree with you, much less even read further than 'not great' when it comes to whatever it is he's using to promote the avoidance of inevitable seasonal progression toward summer. hahaha. that goes on here a lot. Like no problem admitting summer; but don't admit to signs and process -
-
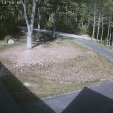
Radar shows rain, but doesn't look like any is reaching the ground at GMU.
-
A few hundredths
.thumb.gif.f92b16c631a1d15d405ed77b33f0710d.gif)