All Activity
- Past hour
-
 This is the worst weather of the entire year, my allergies are back. I really hate clouds+rain+wind and now it's just clouds+wind which is even worse. What is taking for this damned pest of a hurricane to leave? They usually move at 40-50 mph up here, this one is crawling along at 15 mph. Also, the media is all over this storm, why so much coverage for a storm that isn't even going to make landfall anywhere? Is it because the tropical season has been so quiet?
 -
How rare is a summer like 1983 with temperatures over 95 degrees 4 months in a row (JJAS), Chris?
-
 62 / 60 cloudy misty winds picking up.. Dries out and clears tomorrow. Great weekend on tap warmer. Trough next week cooler overall till 30th. Warmer / near normal 31 and warmer beyond. 8/21 : Erin surfs / clouds winds 8/22 - 8/24 : Dry / warmer - Sat warmerst. Sun may see clouds later/showers overnight 8/25 - 8/30 : Cooler - dry below normal overall 8/31 - Beyond : Warmer towards and above normal - warmer
 -
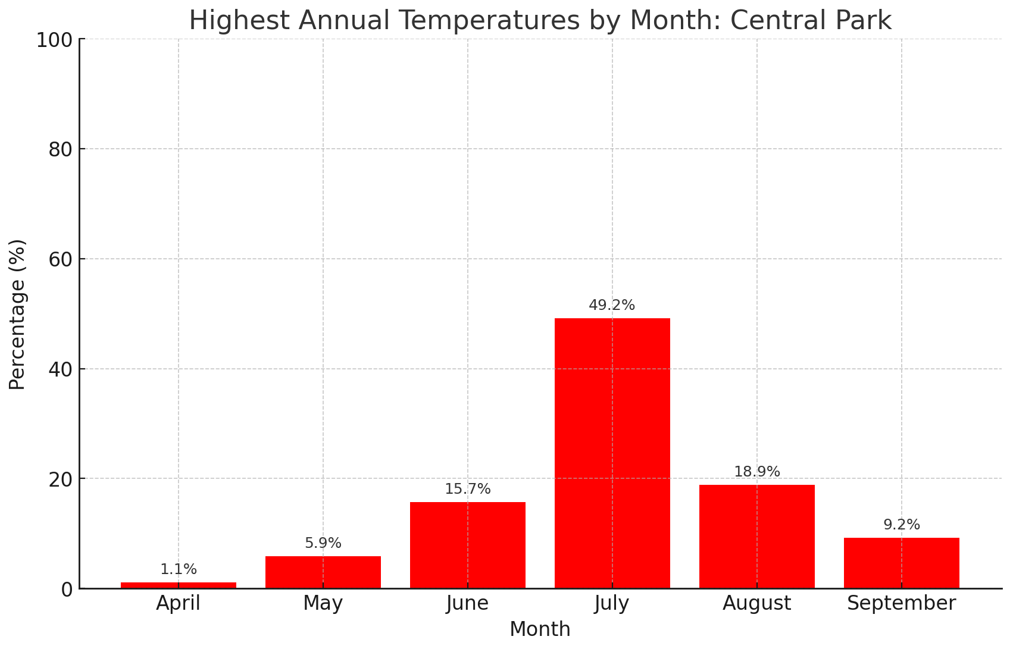
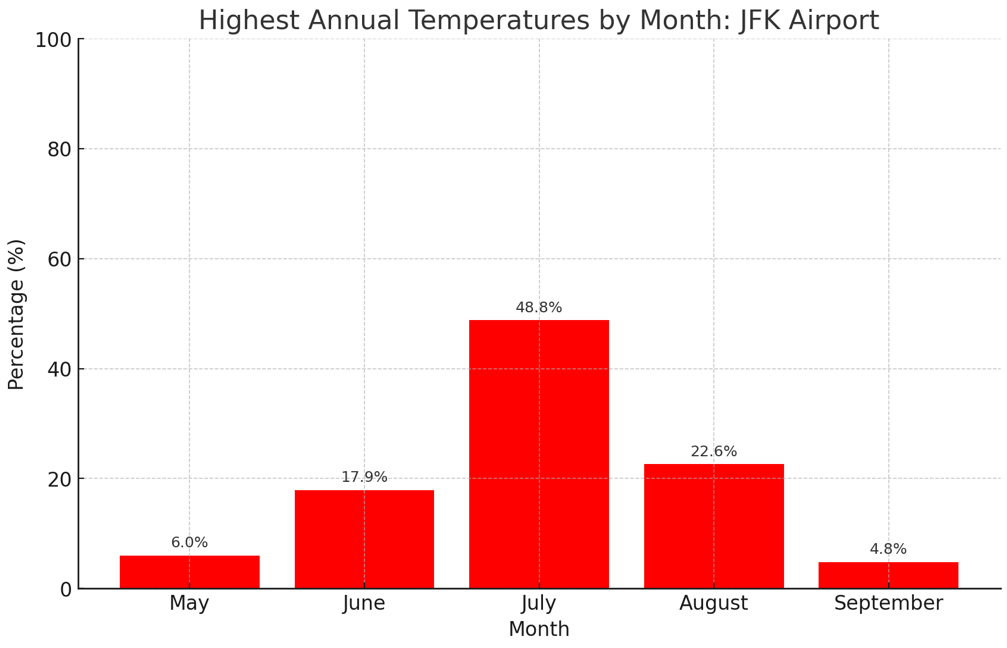
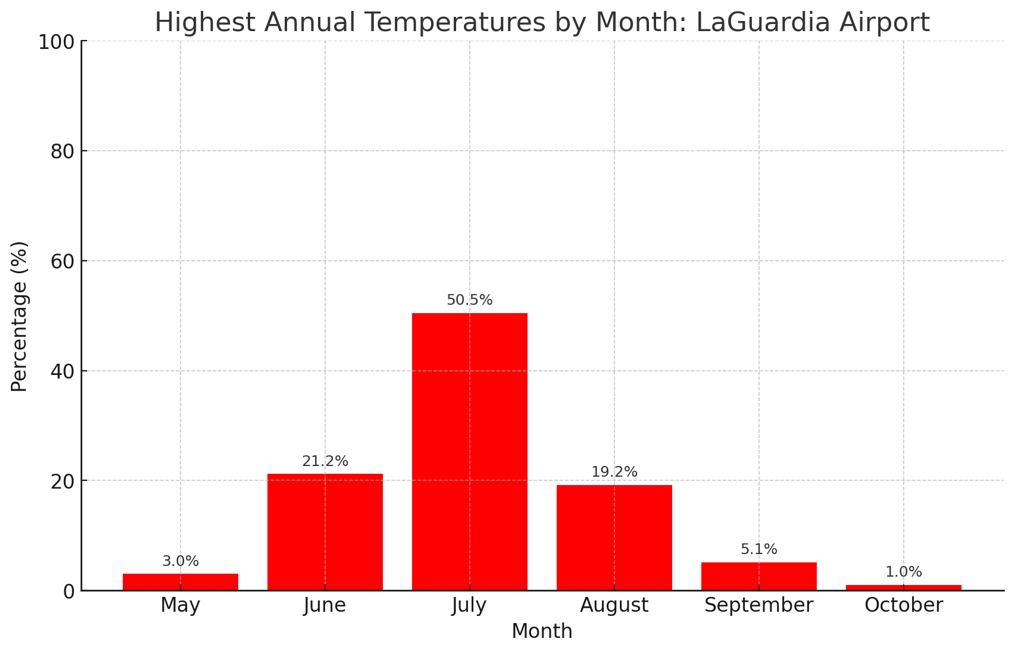
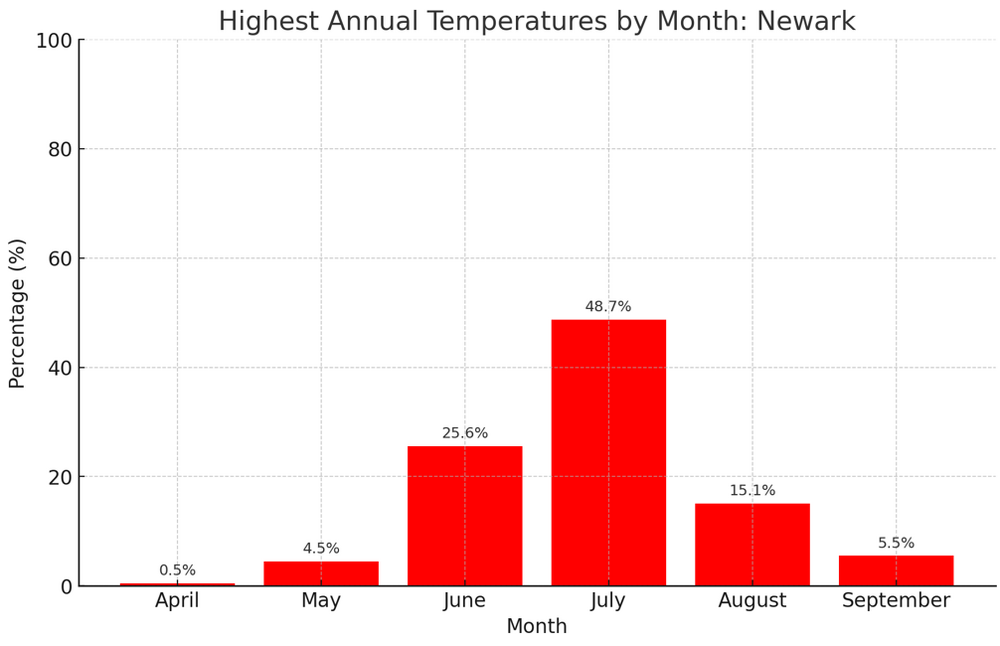
 For historical context, below is the distribution of highest temperature by month for NYC, JFK, LGA, and EWR.


-
2025 Spring/Summer Mountain Thread
Met1985 replied to Maggie Valley Steve's topic in Southeastern States
This is pretty remarkable for the end of August. Sent from my SM-G998U using Tapatalk
-
-
nelson is like one of the most chill people here. so, to say he’s annoying is super lol. definitely a projection there.
-
80/45 is summer 80/53 is summer 80/62 is summer 80/68 is summer 80/75 is summer 93/77 is beautiful summer
-
Fake cold? We're good at that here.
-

Hurricane Erin: 110 MPH - 943 mb - N @ 13
GaWx replied to BarryStantonGBP's topic in Tropical Headquarters
For the record, the NHC/model consensus were significantly too far east as recently as 96 hours out. For example, this is from the 11PM Fri 8/15 NHC discussion:FORECAST POSITIONS AND MAX WINDSINIT 16/0300Z 19.5N 59.5W 85 KT 100 MPH12H 16/1200Z 20.2N 61.6W 100 KT 115 MPH24H 17/0000Z 20.9N 64.2W 115 KT 130 MPH36H 17/1200Z 21.7N 66.3W 125 KT 145 MPH48H 18/0000Z 22.9N 67.9W 120 KT 140 MPH60H 18/1200Z 24.0N 68.9W 115 KT 130 MPH72H 19/0000Z 25.6N 69.8W 110 KT 125 MPH96H 20/0000Z 28.9N 70.5W 105 KT 120 MPH120H 21/0000Z 33.5N 69.0W 100 KT 115 MPHLink: Hurricane ERIN Erin’s center ended up going 180 miles west of 70.5W as it went to 73.7W! So, later at its closest pass, the center ended up ~half the distance from the OBs vs what was forecasted early last weekend. Had this 70.5W furthest W forecast verified well, there wouldn’t have been TS conditions on the OBs. -
The other thing that's irked me about this recent 3 or 4 day cool down is that it's lying? Talk about a faux autumn con -job. I say that because the hydrostatic heights ( thickness) have never fallen below 566 dm along the BUF-BOS latitude. Actually it was true over BTV, too. "deep" in the toposphere. The cool air has been a narrow layer on the bottom - completely belying the true deep layer, positive anomaly ongoing thermodynamic nature of the thing.
-
Definitely been a humid summer in GA, but the ATL area being farther from the coast, helps keep the dews a touch lower.
-
In most years, our white birches start dropping leaves in mid-late August. Drought (1.82" July 1 on) has brought some leaves from other species. Our driest August is 0.88" in 2002 and we're 0.60" behind that. GYX discussions have .25-.50 Sunday/Monday then some dry days. Could be close.
-
Haha yeah, it’s all subjective on here. Maybe “deep” needs a departure from normal? Or I do like your method better. It’s not spring, fall or winter weather… so summer. Just lose the “deep” nomenclature.
-
 So far we have had 4 summers since 2017 with the highest temperature of the year occurring in June or not getting surpassed later in the summer. This is a first for our area over such a short period of time. It makes years like 1953 even more challenging to match with 105° heat in September. Since heat getting established early peaks before we get to August and September. Monthly Highest Max Temperature for NEWARK LIBERTY INTL AP, NJ Jun-Aug Max Temps Click column heading to sort ascending, click again to sort descending. 2025 103 101 96 103 2021 103 97 99 103 2011 102 108 98 108 1994 102 99 95 102 1993 102 105 100 105 1952 102 98 92 102 1943 102 95 97 102 1988 101 101 99 101 1966 101 105 95 105 2024 100 99 100 100 1959 100 93 96 100 1953 100 99 102 102 1934 100 98 90 100 1923 100 99 92 100 2017 99 98 93 99 Monthly Highest Max Temperature for LAGUARDIA AIRPORT, NY Jun-Aug Max Temps Click column heading to sort ascending, click again to sort descending. 2025 101 100 91 101 2017 101 98 91 101 1952 101 97 90 101 2021 100 96 98 100 2008 100 97 88 100 1988 99 99 97 99 1956 99 94 92 99 1943 99 91 93 99 2012 98 101 93 101 1959 98 91 94 98 2024 97 97 95 97
 -
heh... great. more subjective word maze popsicle headache. Yeah I dunno. 'for me' I'm okay with deep summer being 83/62. It's not winter. It's not autumn nor spring. It's summer, and above climo for August 20. But again, it's a semantic waste of time. 90/70 is just hot; deep summer needs to be in place, first.
-

Hurricane Erin: 110 MPH - 943 mb - N @ 13
Wannabehippie replied to BarryStantonGBP's topic in Tropical Headquarters
As we say goodbye to Erin, and go on to the next storm. 8:00 AM EDT Thu Aug 21 Location: 34.8°N 71.8°W Moving: NNE at 17 mph Min pressure: 945 mb Max sustained: 105 mph -
I'm super pumped for this severe weather class. Skew T's, Log P's (don't know much about those though), thermodynamic review (prob screwed there). shear, hodographs, soundings, and so much more and final project is a case study
-
I think there’s another force here too….we overestimate our ability to forecast winter previously as well. We had some “classic” behavior in the 2003-2012 period where the El Niños and La Nina’s were acting very much like we “expect”…so maybe we created a recency bias for a time until things “broke down” circa mid-2010s…some will argue 2013 with the big N ATL changes and others will argue Super Nino 2015-16, but either way it was around that time. However, one only needs to look back to decades past to see how many ENSO events/winters didn’t act like we “expect” them to. Some of the early 1950s winters behaved very similarly to our recent winters but just a warmer baseline now. They were still very warm in the means, especially over New England and SE Canada. The El Niños in the late 1960s basically acted as La Niñas (particularly 1968-69)…even the super Nino in 1972-73 was not like others. Probably a lot of -PDO hangover influence. The 1980s had their own bizarre quirks and then we have the famed ‘95-96 winter which was a La Niña but had an active STJ more akin to El Nino which contributed to the wildly positive snow anomalies in the mid-Atlantic. Those are just the ones off the top of my head. I try to keep the early 1990s in their own category due to the influence of Pinatubo. There was some radical stuff going on there (we’ve talked about this previously but the extreme cold in the 1992-1994 period was likely not a coincidence.) There’s definitely new quirks going on as we warm different parts of the planet at different rates, but I’m not convinced we truly have some permanent new paradigm where most of the old rules don’t apply. History tends to rhyme including weather history…we might have an underlying baseline that is warmer, but I hesitate just throwing out previous references and rules. Not saying you are going that extreme, but more just a general comment on winter forecast and it’s a sentiment I’ve seen elsewhere.
-
of course that's not intended to mean we can't get a bombed this year either... just sayn'
-
Talking early in the week when Monday and Tuesday were cloudy and wet at the beach with mostly cloudy skies and mist. Areas back home had sun in Northern De., and PA was mostly sunny. The front stalled, more onshore flow and what was forecasted as sunny turned into cloudy conditions for the Southern areas. Erin's impact on Dewey's weather was more mid to late week. Today being the worse of the last four days here. I need more orange crushes today.
-
 With this rain I'm at 1.13" of rain for the month, so the area can use it. I have an irrigation system, so I'm good, but many neighbors lawns and flowers are looking quite thirsty. Seems like from Walt's map above, a decent amount of NJ South of 78 and away from the coast were in the shaft zone. My black walnut tree seems to be dropping leaves already. It is usually the last to leaf out and the first to drop leaves, but this is early.
 -
 I don't remember if you needed the rain or not but you did get shafted with this, you have one of the lowest totals in the area. I got skunked a bit as well considering the surrounding amounts, northern Queens and Nassau had between 0.4 and 0.6 but closer to an inch just a couple miles south of me and much bigger amounts just north as well.
 -
Same here, .23"
-
This stuff is more appealing in a 1992 planetary climate for me. Not so sure I vibe with that now that we've evolved to a 2025 state of global climate affairs. Most of the outlooks and conjectures I've read or heard are clad enough relative to classical modes ( longer termed telecons, air/ocean/land ...etc), but don't consider a consistently observing winter circulation modes being unstable, despite those efforts. And thus ...less predictable, more so than usual - higher variance including at times unusually large correction ranges ( warm vs cool ), that for lack of better words, flout the governing/preceding indicators. More occurrences of anti-correlation. This instability was always clearly predicted by climate models and so interesting enough appears to be manifesting... I'm not sure I see a compensating mechanism that caps that manifestation from doing the same thing. I realize I've been sarcastic at times in mockery over having this winter just being like the last 7 or 8 consecutive ones/8 number of years, but there is modicum of valid reason in that humor. Because simply put, the 'disruption' aspects having been getting in the way of all intents and purposes ... with enough consistency and a large enough sample size to dim confidence in the reliance on classical application.