All Activity
- Past hour
-
I can’t understand cheering on 52° and drizzle on Memorial Day weekend, but we do have a mental health crisis in this nation.
-
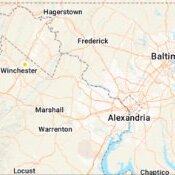
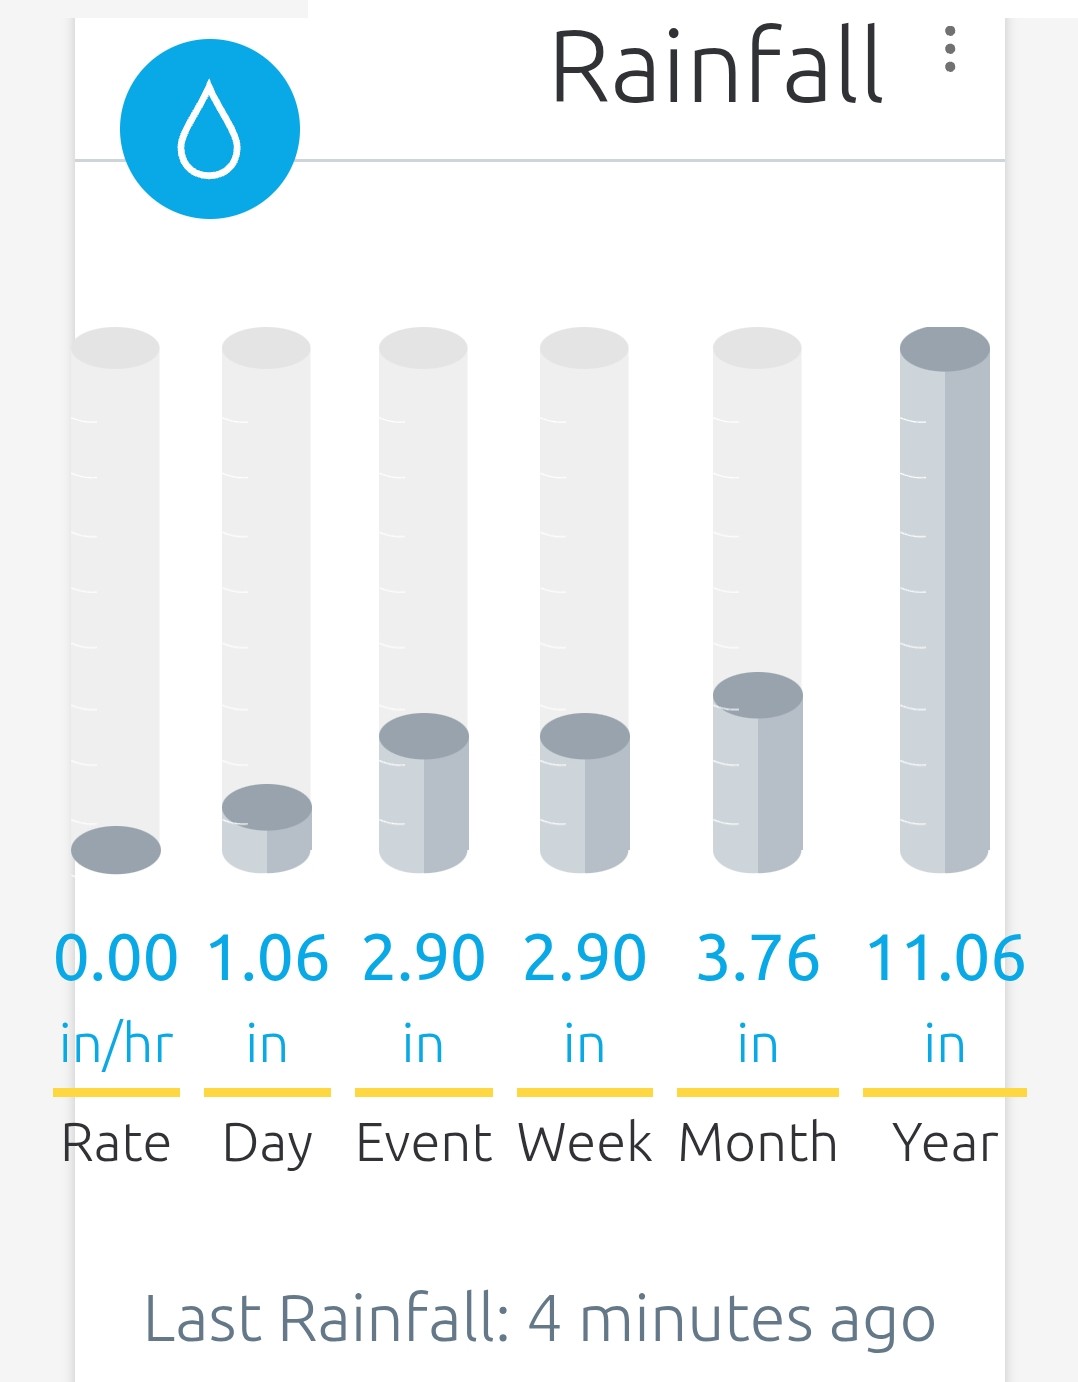
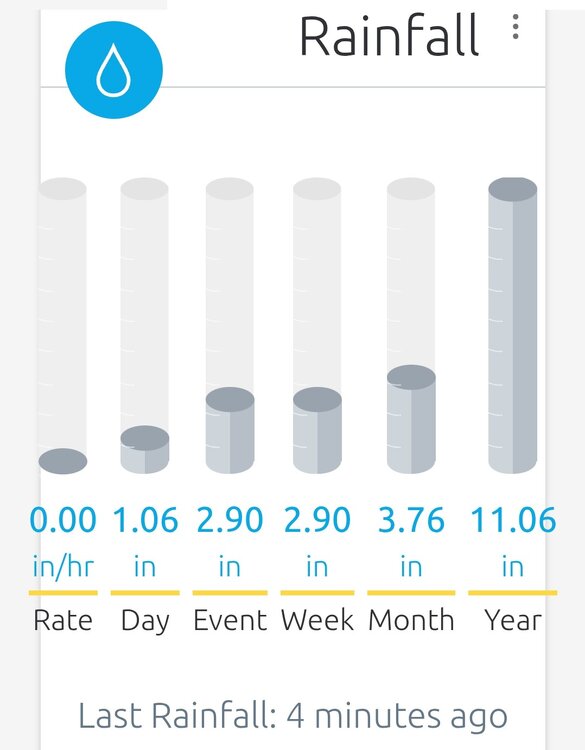
The horizon to horizon stream of RX 350s with NoVa tags arrived right on schedule. The lines at the Oakland Wal Mart resemble the 1994 South African election. The sh*tty weather didn't stop the coming of summer age pilgrimage to Deep Creek...at least it is now above 50 with 2.10" of badly needed precip with #DroughtBuster'26. 200 foot ceilings be damned! Looking past early next week, unfortunately things turn absolutely bone dry again. From 117 to 384, GFS has my area with ~a half inch of precip.
-
He doesn’t drive a cruiser so I’m pretty sure he’s a desk cop, which explains all his models postings all day
-
After the rain this morning, got sunny out, with a high of 86. A tstorm came through around 1, dumping a quarter inch. Suns back out. Very tropical like today. Nice having some rain again.
-
I don't understand...rain guage numbers are right there in your back yard. And we have our yearly averages vs. where we are. I mean stuff even a layman can understand that doesn't need a ton of science. So I don't get how you can say it's not real unless as CAPE said it's connected to the other thing.
-
Brutal today. Nothing like a 50 degree swing in a few days. I hope JJA turns around and we get some consistent heat.
-
Among other things. Ofc there is a connection..
-
Yeoman and 53 have never believed in droughts...I think they believe there's an unlimited amount of water and talk of drought is a hoax.
-
First drops finally falling
-
Central PA Spring 2026 Discussion/Obs Thread
pawatch replied to Voyager's topic in Upstate New York/Pennsylvania
47 degrees and 1.15” of rain. I’m happy with my 70 degree heat today. Some serious nasty weather. Next up, the river will be running pretty high. Which will put a hold on fishing. Been a really inconsistent spring. -
Rain shield all day here.
-
The general public doesn't understand any of this stuff. 'Its raining and my grass is green. Why are you inconveniencing me?'. People are pretty dopey.
-
Not much additional rain today but plenty so far. Not sure ill make 3" anymore but it's been a nice event
-
This point will need to be hammered home with the public. We're already fielding questions at work, on a weekend, about why there's water restrictions with "all this rain we've had recently".
-
Almost made it to 3 inches for the 3 days. Just need a tenth more. Amazing how much rain there has been after being so dry for so long.
-
Crazy kids. Lol. 55 and raining.

-
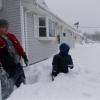
What are you doing outside now to enjoy it and take advantage of it?
- Today
-
2.8" thus far.
-
it was cold enough for a winter coat..
-
Gloves and scarf?
-
52 and drizzle here Love this weather
-
And Memorial Day Itself back to 20 - a nice 15 year dry stretch in the 30s / 40s. Year Memorial Day Date Day of Week High (°F) Low (°F) Rainfall (in) 1920 May 30, 1920 Sunday 78 53 0.00 1921 May 30, 1921 Monday 76 59 0.00 1922 May 30, 1922 Tuesday 83 62 0.00 1923 May 30, 1923 Wednesday 77 52 0.00 1924 May 30, 1924 Friday 65 49 0.00 1925 May 30, 1925 Saturday 75 55 0.02 1926 May 30, 1926 Sunday 78 54 0.00 1927 May 30, 1927 Monday 73 53 0.00 1928 May 30, 1928 Wednesday 71 55 0.15 1929 May 30, 1929 Thursday 88 68 0.00 1930 May 30, 1930 Friday 64 50 0.00 1931 May 30, 1931 Saturday 90 70 0.00 1932 May 30, 1932 Monday 74 51 0.00 1933 May 30, 1933 Tuesday 70 59 0.35 1934 May 30, 1934 Wednesday 81 58 0.00 1935 May 30, 1935 Thursday 79 62 0.00 1936 May 30, 1936 Saturday 67 52 0.00 1937 May 30, 1937 Sunday 85 56 0.00 1938 May 30, 1938 Monday 65 48 0.00 1939 May 30, 1939 Tuesday 89 68 0.00 1940 May 30, 1940 Thursday 66 49 0.00 1941 May 30, 1941 Friday 79 55 0.00 1942 May 30, 1942 Saturday 92 65 0.00 1943 May 30, 1943 Sunday 77 58 0.00 1944 May 30, 1944 Tuesday 84 57 0.00 1945 May 30, 1945 Wednesday 69 57 0.00 1946 May 30, 1946 Thursday 87 51 0.00 1947 May 30, 1947 Friday 71 52 0.00 1948 May 30, 1948 Sunday 70 64 2.49 1949 May 30, 1949 Monday 69 45 0.00 1950 May 30, 1950 Tuesday 77 56 0.00 1951 May 30, 1951 Wednesday 76 56 0.72 1952 May 30, 1952 Friday 67 56 0.00 1953 May 30, 1953 Saturday 56 50 0.11 1954 May 30, 1954 Sunday 81 64 0.00 1955 May 30, 1955 Monday 80 65 0.14 1956 May 30, 1956 Wednesday 73 54 0.03 1957 May 30, 1957 Thursday 74 55 0.00 1958 May 30, 1958 Friday 80 53 0.00 1959 May 30, 1959 Saturday 89 64 0.00 1960 May 30, 1960 Monday 70 57 0.21 1961 May 30, 1961 Tuesday 68 46 0.00 1962 May 30, 1962 Wednesday 83 61 0.00 1963 May 30, 1963 Thursday 80 59 0.00 1964 May 30, 1964 Saturday 73 48 0.00 1965 May 30, 1965 Sunday 67 48 0.00 1966 May 30, 1966 Monday 73 54 0.00 1967 May 30, 1967 Tuesday 74 48 0.00 1968 May 30, 1968 Thursday 72 54 0.04 1969 May 30, 1969 Friday 90 69 0.00 1970 May 30, 1970 Saturday 68 50 0.00 1971 May 31, 1971 Monday 74 60 0.16 1972 May 29, 1972 Monday 78 56 0.00 1973 May 28, 1973 Monday 70 52 0.59 1974 May 27, 1974 Monday 55 52 0.00 1975 May 26, 1975 Monday 73 54 0.00 1976 May 31, 1976 Monday 76 60 0.00 1977 May 30, 1977 Monday 70 53 0.08 1978 May 29, 1978 Monday 79 62 0.00 1979 May 28, 1979 Monday 75 57 0.20 1980 May 26, 1980 Monday 76 57 0.00 1981 May 25, 1981 Monday 87 67 0.00 1982 May 31, 1982 Monday 66 62 0.04 1983 May 30, 1983 Monday 71 61 1.11 1984 May 28, 1984 Monday 64 56 1.15 1985 May 27, 1985 Monday 86 63 0.04 1986 May 26, 1986 Monday 76 58 0.00 1987 May 25, 1987 Monday 63 53 0.00 1988 May 30, 1988 Monday 87 63 0.00 1989 May 29, 1989 Monday 78 53 0.00 1990 May 28, 1990 Monday 72 56 0.00 1991 May 27, 1991 Monday 89 63 0.55 1992 May 25, 1992 Monday 61 44 0.00 1993 May 31, 1993 Monday 70 57 0.90 1994 May 30, 1994 Monday 83 60 0.00 1995 May 29, 1995 Monday 80 58 0.68 1996 May 27, 1996 Monday 63 51 0.11 1997 May 26, 1997 Monday 70 56 0.00 1998 May 25, 1998 Monday 69 59 0.42 1999 May 31, 1999 Monday 89 68 0.00 2000 May 29, 2000 Monday 65 53 0.00 2001 May 28, 2001 Monday 72 57 0.05 2002 May 27, 2002 Monday 77 59 0.00 2003 May 26, 2003 Monday 56 51 1.28 2004 May 31, 2004 Monday 64 57 0.22 2005 May 30, 2005 Monday 75 57 0.00 2006 May 29, 2006 Monday 88 66 0.01 2007 May 28, 2007 Monday 83 67 0.00 2008 May 26, 2008 Monday 80 58 0.00 2009 May 25, 2009 Monday 81 63 0.00 2010 May 31, 2010 Monday 86 69 0.00 2011 May 30, 2011 Monday 86 70 0.29 2012 May 28, 2012 Monday 89 71 0.00 2013 May 27, 2013 Monday 73 51 0.00 2014 May 26, 2014 Monday 86 66 0.00 2015 May 25, 2015 Monday 85 64 0.00 2016 May 30, 2016 Monday 82 68 1.65 2017 May 29, 2017 Monday 61 56 0.13 2018 May 28, 2018 Monday 69 56 0.00 2019 May 27, 2019 Monday 80 64 0.00 2020 May 25, 2020 Monday 71 55 0.00 2021 May 31, 2021 Monday 70 49 0.02 2022 May 30, 2022 Monday 84 63 0.00 2023 May 29, 2023 Monday 79 59 0.00 2024 May 27, 2024 Monday 73 66 0.96 2025 May 26, 2025 Monday 73 52 0.00 NYC Central Park Memorial Day Climatology (1920–2025) 106 Years of Historical Memorial Day Weather Analysis Over a century of Memorial Day weather observations reveals that many assumptions about the holiday do not match reality. While people often remember either extreme heat or complete washouts, the long-term record tells a more nuanced story involving dry-weather regimes, clustered extremes, and noticeable warming signals. Top 15 Findings 1. The "average" Memorial Day is milder than most people remember Across 106 years, the average Memorial Day high was 75.5°F, with an average low of 57.5°F. Memorial Day in New York is historically more late spring than full summer. 2. Memorial Day is dry much more often than wet Rain occurred in only 32 of 106 years (30%), meaning roughly 7 out of every 10 Memorial Days were dry. 3. Weather memory is biased toward extremes People tend to remember either 90° BBQ days or holiday washouts. Most years are actually moderate and comfortable. 4. The hottest Memorial Day reached 92°F The warmest Memorial Day occurred in 1942, reaching 92°F. 5. The coldest Memorial Day reached only 55°F The coolest Memorial Day high occurred in 1974, a full 37°F colder than the warmest year. 6. Memorial Day weather has surprisingly high variability A 37°F spread between the warmest and coolest Memorial Days shows how dramatically conditions can vary despite being the same holiday. 7. Rainfall follows a "feast or famine" pattern Average rainfall was only 0.14 inches, while the wettest year received 2.49 inches, nearly 18 times the average amount. 8. A handful of years dominate rainfall totals Largest Memorial Day rainfall events: 1948: 2.49" 2016: 1.65" 2003: 1.28" 2024: 0.96" 1993: 0.90" A small number of years contribute disproportionately to total Memorial Day rainfall. 9. The 1934–1947 Memorial Day dry stretch stands out as one of the strongest signals in the entire record Between 1934–1947, Memorial Day recorded no measurable rainfall across fourteen consecutive holidays. Using the long-term climatology where roughly 70% of Memorial Days are dry, this is statistically unusual and likely reflects a broader climate regime rather than simple random variation. 10. The early 2010s stand out as a warm cluster Between approximately 2010–2015, multiple Memorial Days reached the mid to upper 80s, creating one of the warmest clusters in the record. 11. Overnight temperatures may be warming faster than daytime highs The warmest Memorial Day low was 71°F (2012) while the coolest was 44°F (1992). This can be an indicator of changing urban and climate conditions. 12. Holiday timing changed in 1971 Before 1971, Memorial Day occurred every May 30. Beginning in 1971 it shifted to the last Monday in May, introducing a slight climate timing effect. 13. Memorial Day weather appears to occur in regimes rather than random year-to-year noise The record contains visible clusters of: Warm periods Cool periods Dry periods Wet periods 14. The strongest climate signal may be persistence Instead of isolated years behaving independently, weather patterns appear to sustain themselves over multiple years. 15. The "typical" Memorial Day still wins Despite extreme years receiving the attention, the long-term average remains remarkably stable: mid-70s during the day, upper-50s at night, and dry most of the time.
-
Good news thanks to El Nino for folks like me who prefer a not so active season and thus less risk of destruction in the SE and thus lower stress: NOAA's outlook for the 2026 Atlantic Hurricane Season indicates that a below-normal season is the most likely outcome, with moderate chances for a near-normal season, and low probabilities that the season could be above-normal. The outlook calls for a 55% chance for a below-normal season, a 35% chance of a near-normal season, and only a 10% chance for an above-normal season. See the NOAA definitions of above-, near-, and below-normal seasons for more information. The 2026 outlook calls for a 70% probability for each of the following ranges of activity: 8-14 Named Storms 3-6 Hurricanes 1-3 Major Hurricanes Accumulated Cyclone Energy (ACE) range of 45-115% of the median ——————— It’s all relative though and unfortunately the midpoints of 11 NS/4.5 H/2 MH can still be devastating if land is affected as it takes only one like in ‘92. Also, NOAA has wide spreads. I’m leaning to lower half of these due to how strong El Niño is expected to be and not as warm ATL tropics as in ‘23. https://www.cpc.ncep.noaa.gov/products/outlooks/hurricane.shtml

.thumb.JPG.418e8a9a2902ae687ec35ff4bc0e038e.JPG)