All Activity
- Past hour
-
 I think I'll do fine in December.
 -
Don’t worry. I always start off strong when there’s nothing to lose. in 45 days. I’ll be falling apart.
-
(002).thumb.png.6e3d9d46bca5fe41aab7a74871dd8af8.png)
Central PA Fall Discussions and Obs
ChescoWx replied to ChescoWx's topic in Upstate New York/Pennsylvania
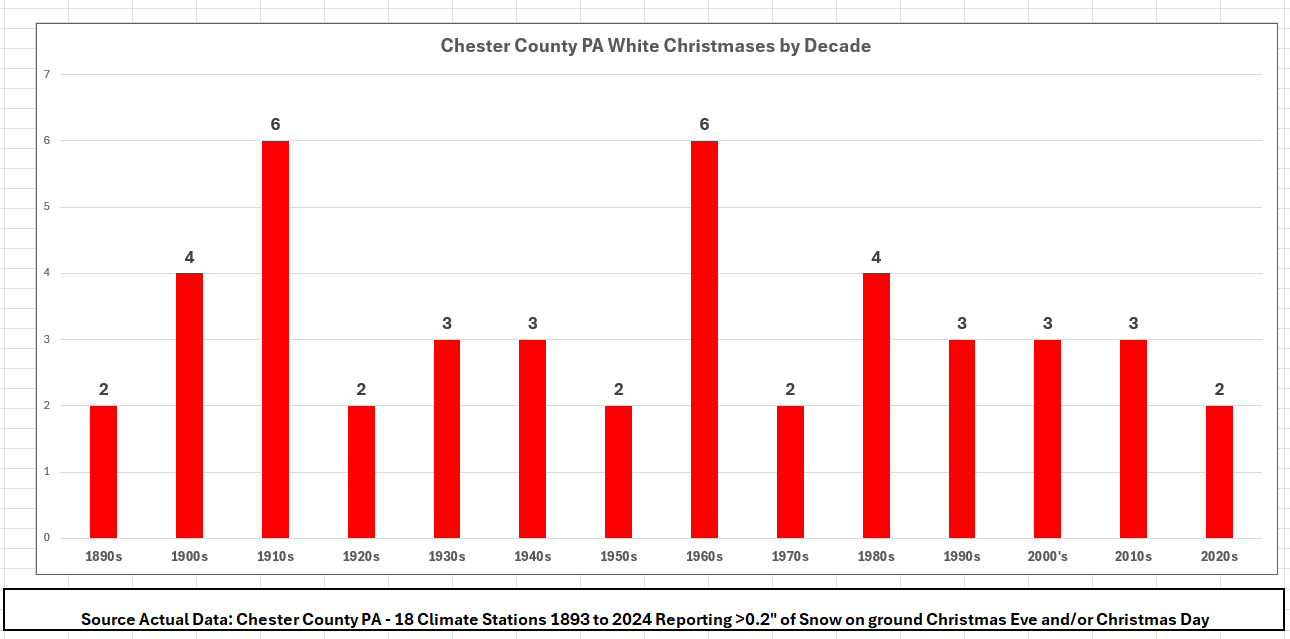
Well, I have completed some deep analysis across all of the Chester County and SE Berks County PA climate sites to see how often we have seen a White Christmas here in the western Philadelphia suburbs of Chester and SE Berks Counties. Now what is up for debate is what represents a White Christmas?? For purposes of this exercise, I am considering measurable snow on the ground (+0.2") on either December 24th or December 25th before midnight. Some interesting statistics of note. We have received Holiday Week snow during Christmas week (December 17th through 25th) in 77 of the 132 years or 58% of all Christmas seasons We experience a White Christmas somewhere in Chester/SE Berks Counties about 1 out of every 3 years or 34% of all years. We have received measurable snow on 29 Christmas Eve or Days (22%) 16 measurable snows on Christmas Eve 13 measurable snows on Christmas Day One inch or more snow was on the ground: 32 times on Christmas Eve (24%) 31 times on Christmas Day (23%) Our last White Christmas was last Christmas Eve Day when 0.5” fell at East Nantmeal and 0.4” at Octoraro Lake on December 24th. Below is the number of White Christmases by Decade including the partial decades of the 1890’s and our current decade the 2020’s.
-
E PA/NJ/DE Autumn 2025 Obs/Discussion
ChescoWx replied to PhiEaglesfan712's topic in Philadelphia Region
Well, I have completed some deep analysis across all of the Chester County and SE Berks County PA climate sites to see how often we have seen a White Christmas here in the western Philadelphia suburbs of Chester and SE Berks Counties. Now what is up for debate is what represents a White Christmas?? For purposes of this exercise, I am considering measurable snow on the ground (+0.2") on either December 24th or December 25th before midnight. Some interesting statistics of note. We have received Holiday Week snow during Christmas week (December 17th through 25th) in 77 of the 132 years or 58% of all Christmas seasons We experience a White Christmas somewhere in Chester/SE Berks Counties about 1 out of every 3 years or 34% of all years. We have received measurable snow on 29 Christmas Eve or Days (22%) 16 measurable snows on Christmas Eve 13 measurable snows on Christmas Day One inch or more snow was on the ground: 32 times on Christmas Eve (24%) 31 times on Christmas Day (23%) Our last White Christmas was last Christmas Eve Day when 0.5” fell at East Nantmeal and 0.4” at Octoraro Lake on December 24th. Below is the number of White Christmases by Decade including the partial decades of the 1890’s and our current decade the 2020’s.
-

2025-2026 ENSO
donsutherland1 replied to 40/70 Benchmark's topic in Weather Forecasting and Discussion
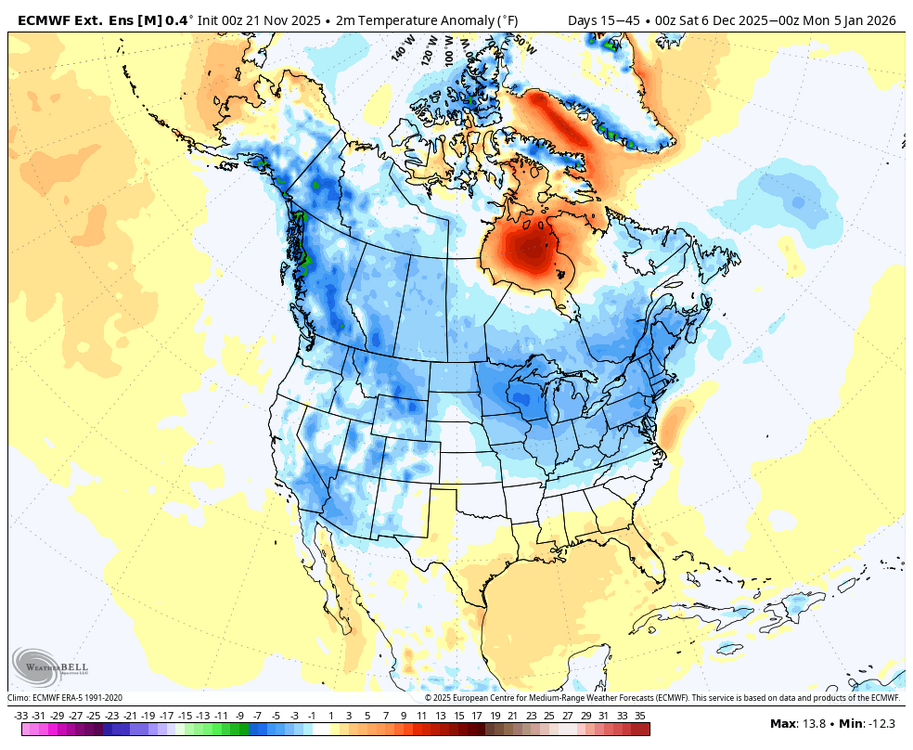
The latest week 3-4 CPC outlook:
-
Yes, I hear its not full blown. I guess we cannot count on a stratwarm in late winter since they're rare. if we end up below normal snowfall in Dec, the best of winters long nights and snow potential may be gone for the season. Hoping this comes together for us.
-

E PA/NJ/DE Autumn 2025 Obs/Discussion
Voyager replied to PhiEaglesfan712's topic in Philadelphia Region
It's certainly affecting the spring locations where some of the bottled water comes from. -
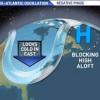
Looks encouraging, because some are worried about the SER and a rebounding PV in December. If you simply look at an East Coast Nina in December you would expect the look that you have posted in the 18z GFS.
-
Definitely not my first TV experience seeing how I was on air almost every weekend for a time. But! It was really fun working with the Outdoors MD crew! Super fun to work with and loved their stories of working other segments. Their videographer who does all the underwater stuff left for Greenland to film sharks just after we wrapped. Lucky.
- Yesterday
-
Had a few raindrops hit the windshield on the drive home from work. Guess it wasn't a total shutout for today's system.
-
HH GFS. Scandi ridge building into GL, +PNA, and an avocado trough digging south. Just a random op run ofc, but continuing to see the same idea across guidance as we head into the first week of Met winter.
-
Best Mid-Atlantic winter storm of the last 50 years
Jebman replied to PrinceFrederickWx's topic in Mid Atlantic
Eskimo Joe I have a special message board, ScienceWeather 2 which is a phpBB3 board, where I post special stuff. This definitely qualifies! -

December 2025 Short/Medium Range Forecast Thread
Carvers Gap replied to John1122's topic in Tennessee Valley
Hour 276....we have some things to get worked out. The difference in the Euro AIFS and GFS ta 18z over Nashville is 58 degrees. The Real Feel on the AIFS is 3. The GFS is 61. The AIFS did not dig into the SW w/ the SLP FWIW, but it did the second. That still allowed a massive cold front to crash eastward on Dec 3 on the AIFS. The AIFS even dropped 1-3" of snow north of I-40 from Nashville eastward. -
Models converging on a little clipper moving through the area Sunday-Monday. Not much room but let’s amp that up a little.
-
2025-2026 ENSO
donsutherland1 replied to 40/70 Benchmark's topic in Weather Forecasting and Discussion
That's a great map. -
A generally milder than normal pattern will likely continue through next Wednesday. However, exceptional warmth appears unlikely. The closing days of November will likely turn colder. Meanwhile, today will be Central Park's 1,392nd consecutive day without daily snowfall of 4" or more. The record of 1,394 days was set during February 22, 1929 through December 16, 1932. That stretch ended with 6.7" daily snowfall on December 17, 1932. The ENSO Region 1+2 anomaly was -0.7°C and the Region 3.4 anomaly was -0.7°C for the week centered around November 12. For the past six weeks, the ENSO Region 1+2 anomaly has averaged -0.16°C and the ENSO Region 3.4 anomaly has averaged -0.65°C. La Niña conditions will likely continue through at least mid-winter. The SOI was +26.47 today. The preliminary Arctic Oscillation (AO) was +0.707 today. Based on sensitivity analysis applied to the latest guidance, there is an implied 83% probability that New York City will have a cooler than normal November (1991-2020 normal). November will likely finish with a mean temperature near 46.6° (1.4° below normal). Supplemental Information: The projected mean would be 1.1° below the 1981-2010 normal monthly value.
-
At least the storm track will not be too far south according to their Precip Outlook and the Polar Vortex is not going to plunge too far south when it is stretched by the Strat Warming Event according to their Monthly Temp Outlook. Heard that the Vortex will be stretching rather than a full displacement............
-
December 2025 Short/Medium Range Forecast Thread
Carvers Gap replied to John1122's topic in Tennessee Valley
Option 1(and there will sure be options 3,4, and 5!) is that the trailer vortex spins out to sea. That is the 18z version. Option 2 is what happened at 12z. The trailing vortex followed and dug out a huge trough which allows a third vortex to drop into. We need that first vortex (even if it goes to the FC...to dig less and kick earlier). I think the first vortex digging into the SW is legit. I am not sure I buy the second and third vortices doing the same - that smacks of feedback. If the second and third vortex simply "don't go to Baja" then the trough likely digs into the EC. Take a minute and looks at the little vortices which modeling is juggling. There are four rotating around the EPO ridge - not counting the Four Corners low. This set-up is an absolute thorn to work out. The downstream effects are huge. It will be interesting to see how this works itself out. OK, enough stream of though posting. It is Friday night, and I am chilling. Will check back later. -
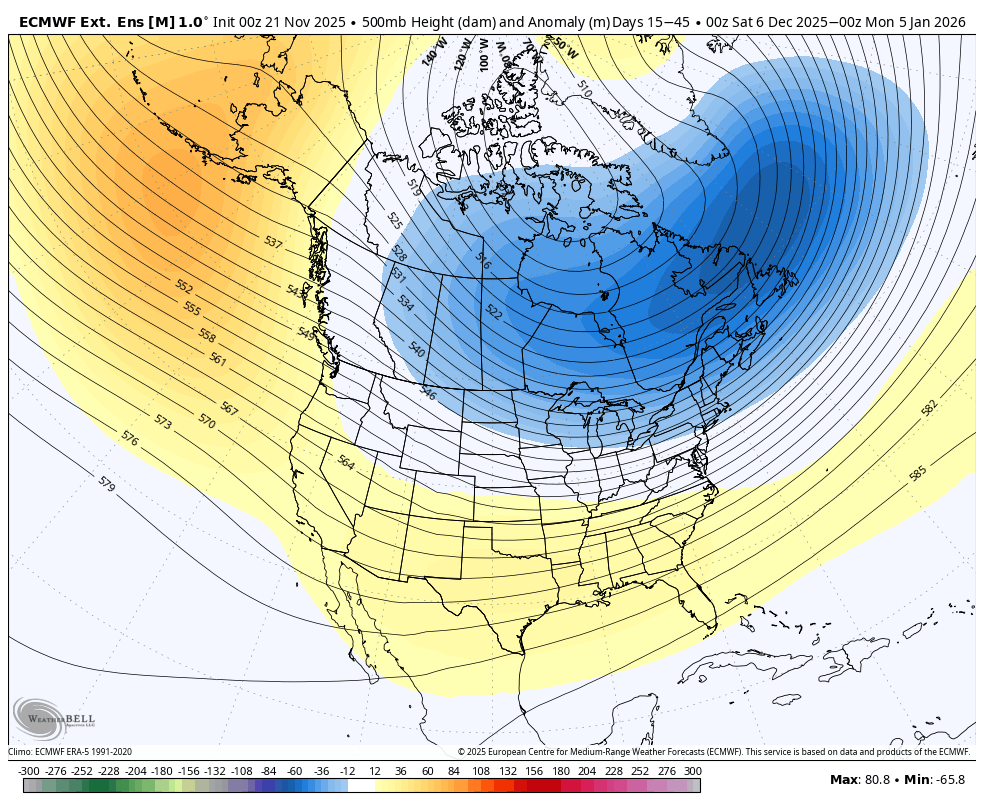
Fascinating the cold in the SW and the Baja. The deep troughs on the West Coast this year, and the last several, have been an issue leading to a SER. That 15 to 45 day map is interesting showing a cold anomaly from Alaska to the Baja.
-
December 2025 Short/Medium Range Forecast Thread
Carvers Gap replied to John1122's topic in Tennessee Valley
Night and day differences when the SW doesn't have multiple lows cutting off...I don't know which is right. But the 18z GFS gives me some hope that the multitude of cutoffs in the SW may well be a feedback error. -
30 day temps on the Weeklies beginning on the 5th look good as well.

-
Exactly, when you start the 30 day on the 5th, you factor out the last few days of the SE ridge in early December.
-
December 2025 Short/Medium Range Forecast Thread
Carvers Gap replied to John1122's topic in Tennessee Valley
The second vortex (which follows the Four Corners low) is the problem. During the 18z run it literally cuts directly through the ridge in the GOA. At 12z, it cuts over the top and dives into Baja which deepens the western trough. You can see the variations on the panels of the ensembles. About half have a trough in the East and half have a ridge - thanks to that little vortex. The EPO ridge is so tall that it is rotating energy back under it which is causing westward flow of Cali. If that vortex doesn't sit over Cali, I do wonder if Santa Anna winds might develop as a result. edit: When the first Four Corners low doesn't dig as much, it doesn't really leave much room for the second to follow. All of this is something to watch on future runs. Until this gets worked out, everything from Weeklies to deterministic runs are going to be impact IMHO. Why? That series of cutoffs takes almost a week to resolve. In other words, there are 5-7 days of cutoffs if not more (on previous runs). If we are looking at just 24-48 hours of a single, cutoff low...that allows for the trough to form in the East. It is a great example of the butterfly effect. The difference between record highs at 12z and the PV heading south at 18z....look nor further than the SW sequence. -
E PA/NJ/DE Autumn 2025 Obs/Discussion
Albedoman replied to PhiEaglesfan712's topic in Philadelphia Region
well drought guy, here. These pity rain events is killing us now. Just issued a drought watch for my water supply. The bad thing is that it did not come from PADEP or the USGS, it came from my water authority LCA. This is getting serious as this affects the water bottling companies as well as 200,000 residents in the LV. Where is 2-3 in rainfall from a noreaster? WeE can not even squeeze out a popcorn fart for a decent rainfall event. Every time I look at the models, the snow potential keeps getting push back to the middle of December too. Welcome to the arid tundra region again. https://www.lehighvalleynews.com/environment-science/lehigh-county-authority-declares-drought-watch-asks-residents-to-reduce-water-use -
December 2025 Short/Medium Range Forecast Thread
Carvers Gap replied to John1122's topic in Tennessee Valley
Look at the different in the eastern half of the US. The first low(now in the Plains) is shallow and digs less. The second vortex spins off the Cali coast(westward). Not sure how much of that is believable, but this illustrates what happens when perpetual lows don't form in the SW.