All Activity
- Past hour
-

2026-2027 El Nino
40/70 Benchmark replied to Stormchaserchuck1's topic in Weather Forecasting and Discussion
Yea......look at the absolute value of each to obtain a general idea of how strong the event is, but more importantly, it's the relationship between the RONI and ONI that is indicative of the type of response that ENSO may induce around the hemisphere. The latter is what we really need to understand because knowing how strong said response will be is pretty useless if we have no idea what the response will be. I suspect we are going to need the RONI to be at least equivalent or greater than the ONI to avoid yet another muted Aleutian low/se trough couple response. If we have a very strong El Nino with a lagging ONI, as was the case in 2023, then you get a very strong RIDGING response over se Canada and an Aleutian low/se trough that is still meager. -
Chris, For actual El Niño intensity, why would you want to use ONI instead of RONI? Say, for example vs 1991-2020 means, tropical waters worldwide were averaging +2C and ONI was averaging the same, +2C. Per RONI, this would be right at perfect neutral. To me, that makes more sense in determining El Niño strength. The forcing from Nino 3.4 isn’t there when it’s neighboring waters are about the same. There’s no warm tongue when it is warm all around it
-
Not as deep. Those will forever remain with more expected next winter.
-
I agree to a point, but it seems likely we will get multiple opportunities over the next two weeks. Sometimes a few .5" rainfalls is better than one big 2" rainfall for busting drought. Hopefully we can stop the bleeding anyway
-
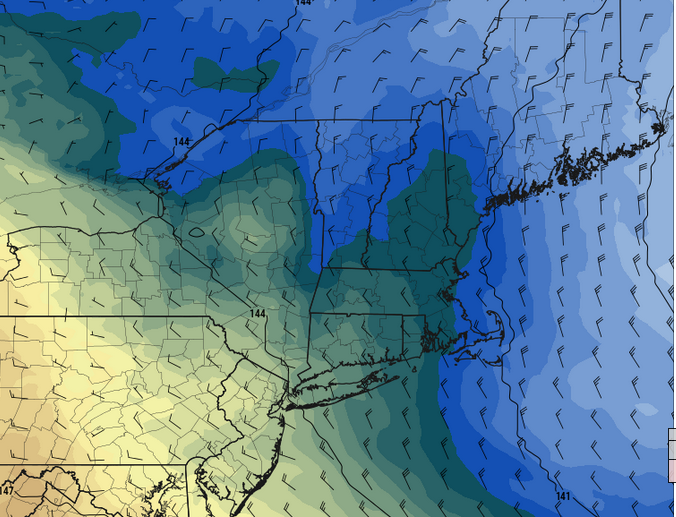
You can actually see the thermal processing of the lower levels on the 06z UKMET for Friday rather nicely... This lobe of modestly warmed 850 mb layout bulbing up over SNE around 21z is definitely because of the sun + compressed d-slope working it over. This is one of those 60 day dandies Brian was mentioning yesterday. I also recall mentioning a couple three days ago that the pattern didn't really look crushingly negative to me - more like neutral with an offsetting lean. It's just hard to get us BN frankly, unless we have more direct feeds of perpetual inject into the region - hint hint, which we did this last winter
-
Are the scars as deep as the ones you have from a series of failed winters?
-
More like the whole state.TN leads leads the nation with 46% being nocturnal tornadoes
-
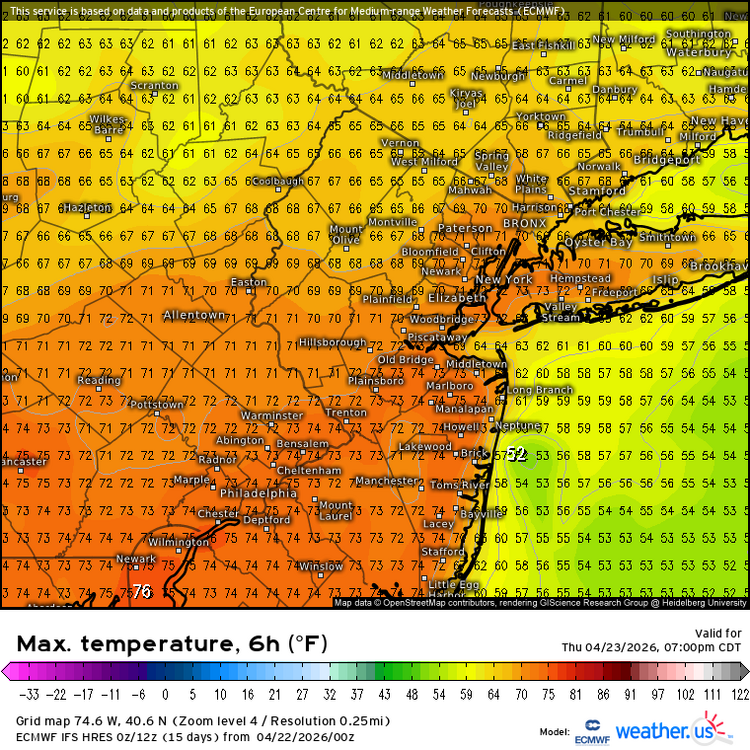
This air mass is both colder than normal, but also... rather prone to machine/automation busts. It's just because the sun is by now seasonally hugely potent, and growing. I was just looking at Friday... that's a general light WNW to NW down slope compression look under an 850mb -2 or -3. Jeez, I've seen it be almost 60 F over a snow pack in mid February due to full sun under 0C 850s. So, although-2 or -3 is a bit of a neg anom, the surface results can be offset quite a bit when compression from air down sloping happens under all that solar power dumping into the environment. Wouldn't shock me to see those MEX numbers verify too cool
-

2026-2027 El Nino
bluewave replied to Stormchaserchuck1's topic in Weather Forecasting and Discussion
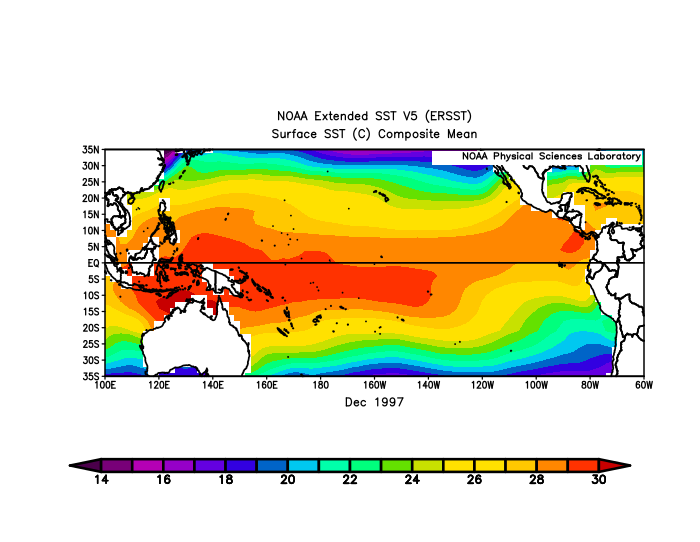
Yeah, could be related. Same for the El Nino trough in the East which was much weaker in 2015-2016 and 2023-2024. I also think the much warmer adjacent off equator and subtropical oceans could be warping the response also. Those subtropical seas were so much warmer this winter that the weak La Niña ridge in the Southwest was so much stronger than the 1995-1996 weak La Niña response. It’s a bit challenging to give a specific value to just how much each individual marine heatwave is contributing. I have also been noticing discussions already taking place about the new RONI index. I went back and reread the paper on RONI and seems like most of the value was with La Ninas where the off equator warmth was masking the La Niña response. But when it comes to the strongest El Niños they can appear weaker than the past ONI. But as we saw from 2023-2024, the weaker RONI didn’t correspond to a weaker ridge over Canada and the Northern Tier and any less warmth. Plus the global temperature jump was even more impressive than past even stronger ONI higher end El Niños. But we could make an argument that the weaker RONI and warmer off equator to subtropical SST warmth could have weakened the Aleutian trough and the trough in the East under the big ridge. This could also warp the rainfall response in some way than we normally get with such strong El niños related to the Southern Stream response. This is why we should probably still use the traditional ONI for the actual El Niño intensity and incorporate the RONI for the finer details like how the Aleutian Low and other troughs are responding. -

Central PA Spring 2026 Discussion/Obs Thread
Itstrainingtime replied to Voyager's topic in Upstate New York/Pennsylvania
Downpour here at work right now. -
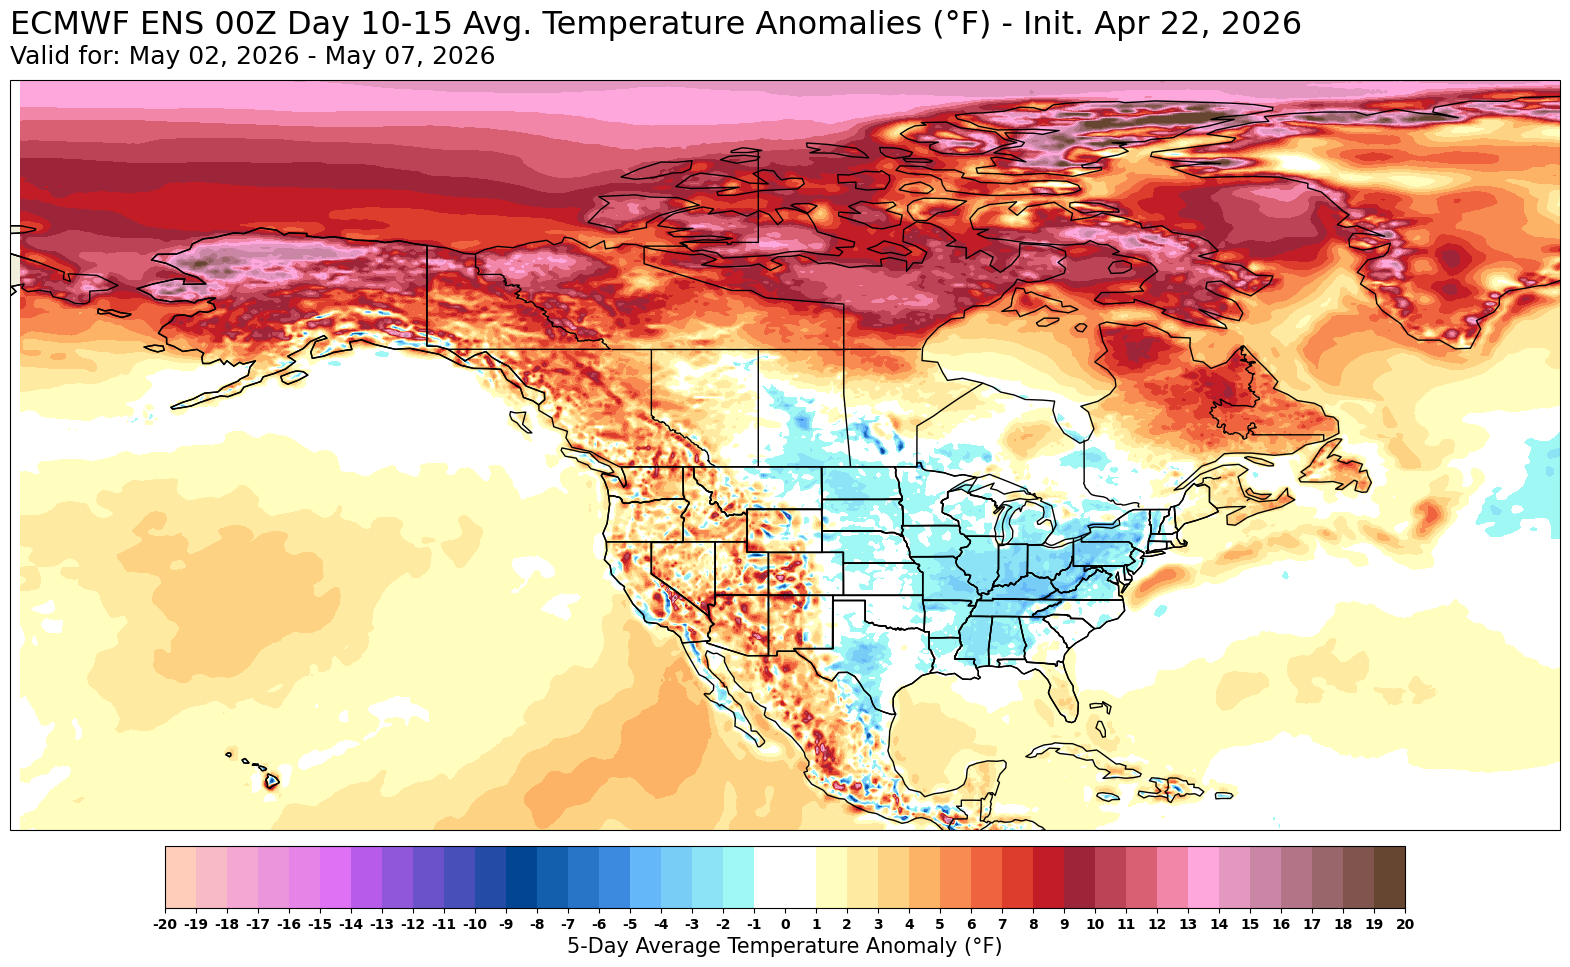
That is one heck of an evolution to kick off May. That is a pretty nasty block and a good looking block too...that's the type of blocking we want to see in Jan/Feb lol.
-
Not to be a downer and I will certainly take the increased rain chances but the first couple of systems next week are weakening cold fronts that will not result in widespread soaking rain. These have all trended weaker up until the day they move through all winter and spring so my hopes are not high. Any rain is good but I don’t think we see much potential for real relief until the very end of next week.
-
Not to be contrarian or argumentative but ... that just looks like background CC ( or expectation thereof ) to me. Remember, those products are not trying to equate color with the 'OMG' factor. Ha. Seriously, those are probabilities for occurrence. They don't address magnitude. For ex, those "warm" regions verified +.01 for JJA, that is considered a success in claiming there was 50, 60 ...90% chance for above normal. That's it. Nothing more. I will add that this has been explained a hundred times...yet people still post those CPC outlook graphics like look out! We're red hot! These are probabilities... probabilities... probabilities..., for above normal at all... at all... at all...
-
When I’m on vacation with kids I want good weather. I was in Orlando for Hurricane Erin in 95. That was cool.
-
2026-2027 El Nino
40/70 Benchmark replied to Stormchaserchuck1's topic in Weather Forecasting and Discussion
This is why we are seeing less of an Aleutian low/se trough response. -
DSD on Thursday and good chance to eke out 60 there as well. Thurs to Monday 60 Perfect.
-
2026-2027 El Nino
bluewave replied to Stormchaserchuck1's topic in Weather Forecasting and Discussion
Probably related to the big expansion of the +30C warm pool in the Pacific which is several degrees warmer than we would get back in the old days with the strongest El Niños before the oceans warmed so much.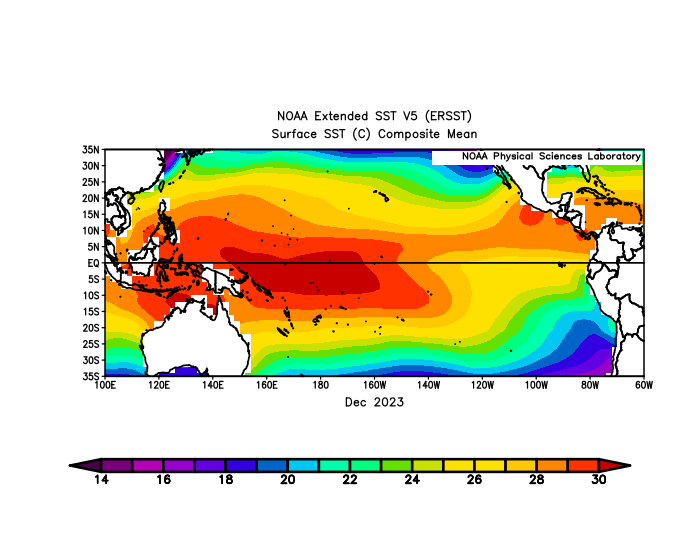
-
Currently 38° with light drizzle so that’s fun.
-
Another nice weekend incoming. Friday to Sunday. Sunny and 60.
-

Occasional Thoughts on Climate Change
Typhoon Tip replied to donsutherland1's topic in Climate Change
I found this to be an interesting article... https://phys.org/news/2026-04-climate-decline-hot-cold-extreme.html (https://link.springer.com/article/10.1007/s00704-026-06200-3) Dr. John R. Christy, Alabama State Climatologist (retired); professor of atmospheric and Earth science at The University of Alabama in Huntsville I'm curious if this may ever be corroborated by other's findings. **Also ... bear in mind the study is regarding "extremes" It doesn't address the longer term climate averages rising. Those are created by the daily stuffing, the vast majority of which are not extreme, per se. I can see a pathway toward reducing the "extremeness" of extreme events, while the bulk temperatures results are warming over time. It would come from increasing the water vapor content. This is basic Meteorology: in order to store more water vapor requires more energy. Raising the global energy level ( planetary energy imbalance ) by way of packing green house gases faster than the background geological processes can compensate, raises temperature. GW incarnate. This provides the necessary energy to evaporates more water and keep it in the atmosphere. I would be really keenly interested in a DP comparison variation of Dr Christy is finding, if the lowering extreme magnitudes might also have correlative relationship with any rises in integrated Dew Point (relative to sigma levels) since 1899. The idea being, as DP ambience becomes more and dense over time, it has a modulating impact on ambient temperature. This is actually rather low-bar atmospheric thermodynamics. The magnitudes of extremes of hot and cold are modulated less due to the thermodynamics involved with the energy needed to keep water in vapor form. When the ambient cold sourcing has high WV content it's just not going to be as cold, because it's holding more thermal latency. Contrasting, as the DP (temp and water vapor integral) rises the temp always comes down; that is because therms are "borrowed" from the kinetic temperature in order to keep the water in gaseous form. 98/80 has equivalent energy to 115/68 ..etc. The shortened version is a 'trade off' so to speak. Is the extremeness of extreme events trading magnitude for high WV content. -
I must be the only human in existence who wishes for stormy weather when he goes away lol
-
We got some rain..not alot but everything soaked, had to use wipers coming into work.
-
Jeff, I have a question out of curiosity. It may just be me, but it seems like almost all severe weather threats in East TN take place in the late evening/overnight hours. Afternoon severe weather events appear to be somewhat rare. Is there any truth to this, and what causes this?
-
At least for the next few weeks, it looks like the warmer days will be in the 70s rather than the 90s. Plenty of blocking setting up which should cap the higher end temperature potential. These impressive temperature swings seem to have increased in frequency starting around January 2005 with how quickly the record warmth reversed to significantly colder. But the warmest temperatures during the swings most of the time is more impressive than the coldest readings. Climatological Data for NY CITY CENTRAL PARK, NY - January 2005 Click column heading to sort ascending, click again to sort descending. Sum 1160 781 - - 1035 0 4.67 15.3 - Average 37.4 25.2 31.3 -2.4 - - - - 3.5 Normal 39.5 27.9 33.7 - 970 0 3.64 2005-01-01 60 40 50.0 14.8 15 0 0.00 0.0 0 2005-01-02 50 37 43.5 8.5 21 0 0.00 0.0 0 2005-01-03 58 49 53.5 18.7 11 0 0.45 0.0 0 2005-01-04 51 46 48.5 13.8 16 0 0.06 0.0 0 2005-01-05 46 35 40.5 6.0 24 0 0.28 T 0 2005-01-06 41 34 37.5 3.1 27 0 0.62 0.0 0 2005-01-07 42 36 39.0 4.8 26 0 T T 0 2005-01-08 41 35 38.0 3.9 27 0 0.59 T 0 2005-01-09 40 33 36.5 2.6 28 0 0.00 0.0 0 2005-01-10 48 39 43.5 9.7 21 0 0.00 0.0 0 2005-01-11 40 35 37.5 3.8 27 0 0.25 T 0 2005-01-12 39 35 37.0 3.4 28 0 0.12 0.0 0 2005-01-13 59 38 48.5 15.0 16 0 0.00 0.0 0 2005-01-14 66 34 50.0 16.6 15 0 1.03 0.0 0 2005-01-15 34 26 30.0 -3.4 35 0 0.00 0.0 0 2005-01-16 31 27 29.0 -4.3 36 0 0.00 0.0 0 2005-01-17 28 18 23.0 -10.3 42 0 0.03 0.5 T 2005-01-18 18 9 13.5 -19.7 51 0 T T 0 2005-01-19 26 9 17.5 -15.7 47 0 0.03 0.8 0 2005-01-20 30 20 25.0 -8.2 40 0 0.00 0.0 0 2005-01-21 20 9 14.5 -18.6 50 0 0.00 0.0 0 2005-01-22 25 6 15.5 -17.6 49 0 0.93 8.5 0 2005-01-23 26 9 17.5 -15.7 47 0 0.25 5.3 13 2005-01-24 24 8 16.0 -17.2 49 0 T T 14 2005-01-25 33 20 26.5 -6.7 38 0 0.00 0.0 13 2005-01-26 37 17 27.0 -6.2 38 0 0.01 T 13 2005-01-27 18 9 13.5 -19.8 51 0 0.00 0.0 13 2005-01-28 22 5 13.5 -19.9 51 0 0.00 0.0 11 2005-01-29 34 15 24.5 -8.9 40 0 0.00 0.0 11 2005-01-30 38 24 31.0 -2.5 34 0 0.02 0.2 11 2005-01-31 35 24 29.5 -4.1 35 0 0.00 0.0 11

- 779 replies
-
- 1
-

-
- april showers bring may..
- rain
- (and 2 more)
- Today
-
This was a really interesting seasonal update. Would love to know their thinking for such a small max in the Apps, lee and piedmont regions, but I assume they’re counting on a lot of diurnal convection and high elevation initiation. Sign me up. Other than snow, nothing beats a 90° day getting its knees taken out by some drifters off the mountains, leading to a nice rain cooled 75° evening on the porch. .