All Activity
- Past hour
-
-

"Don’t do it" 2026 Blizzard obs, updates and pictures.
NeonPeon replied to Ginx snewx's topic in New England
Neither do I. -

Clipper Fires In Wednesday Feb 25 Disco/ Obs
FXWX replied to Damage In Tolland's topic in New England
It flips around too much for my liking. Too many Big run to run changes; if 0z mesos follow suite then I would take note. -

"Don’t do it" 2026 Blizzard obs, updates and pictures.
vortex95 replied to Ginx snewx's topic in New England
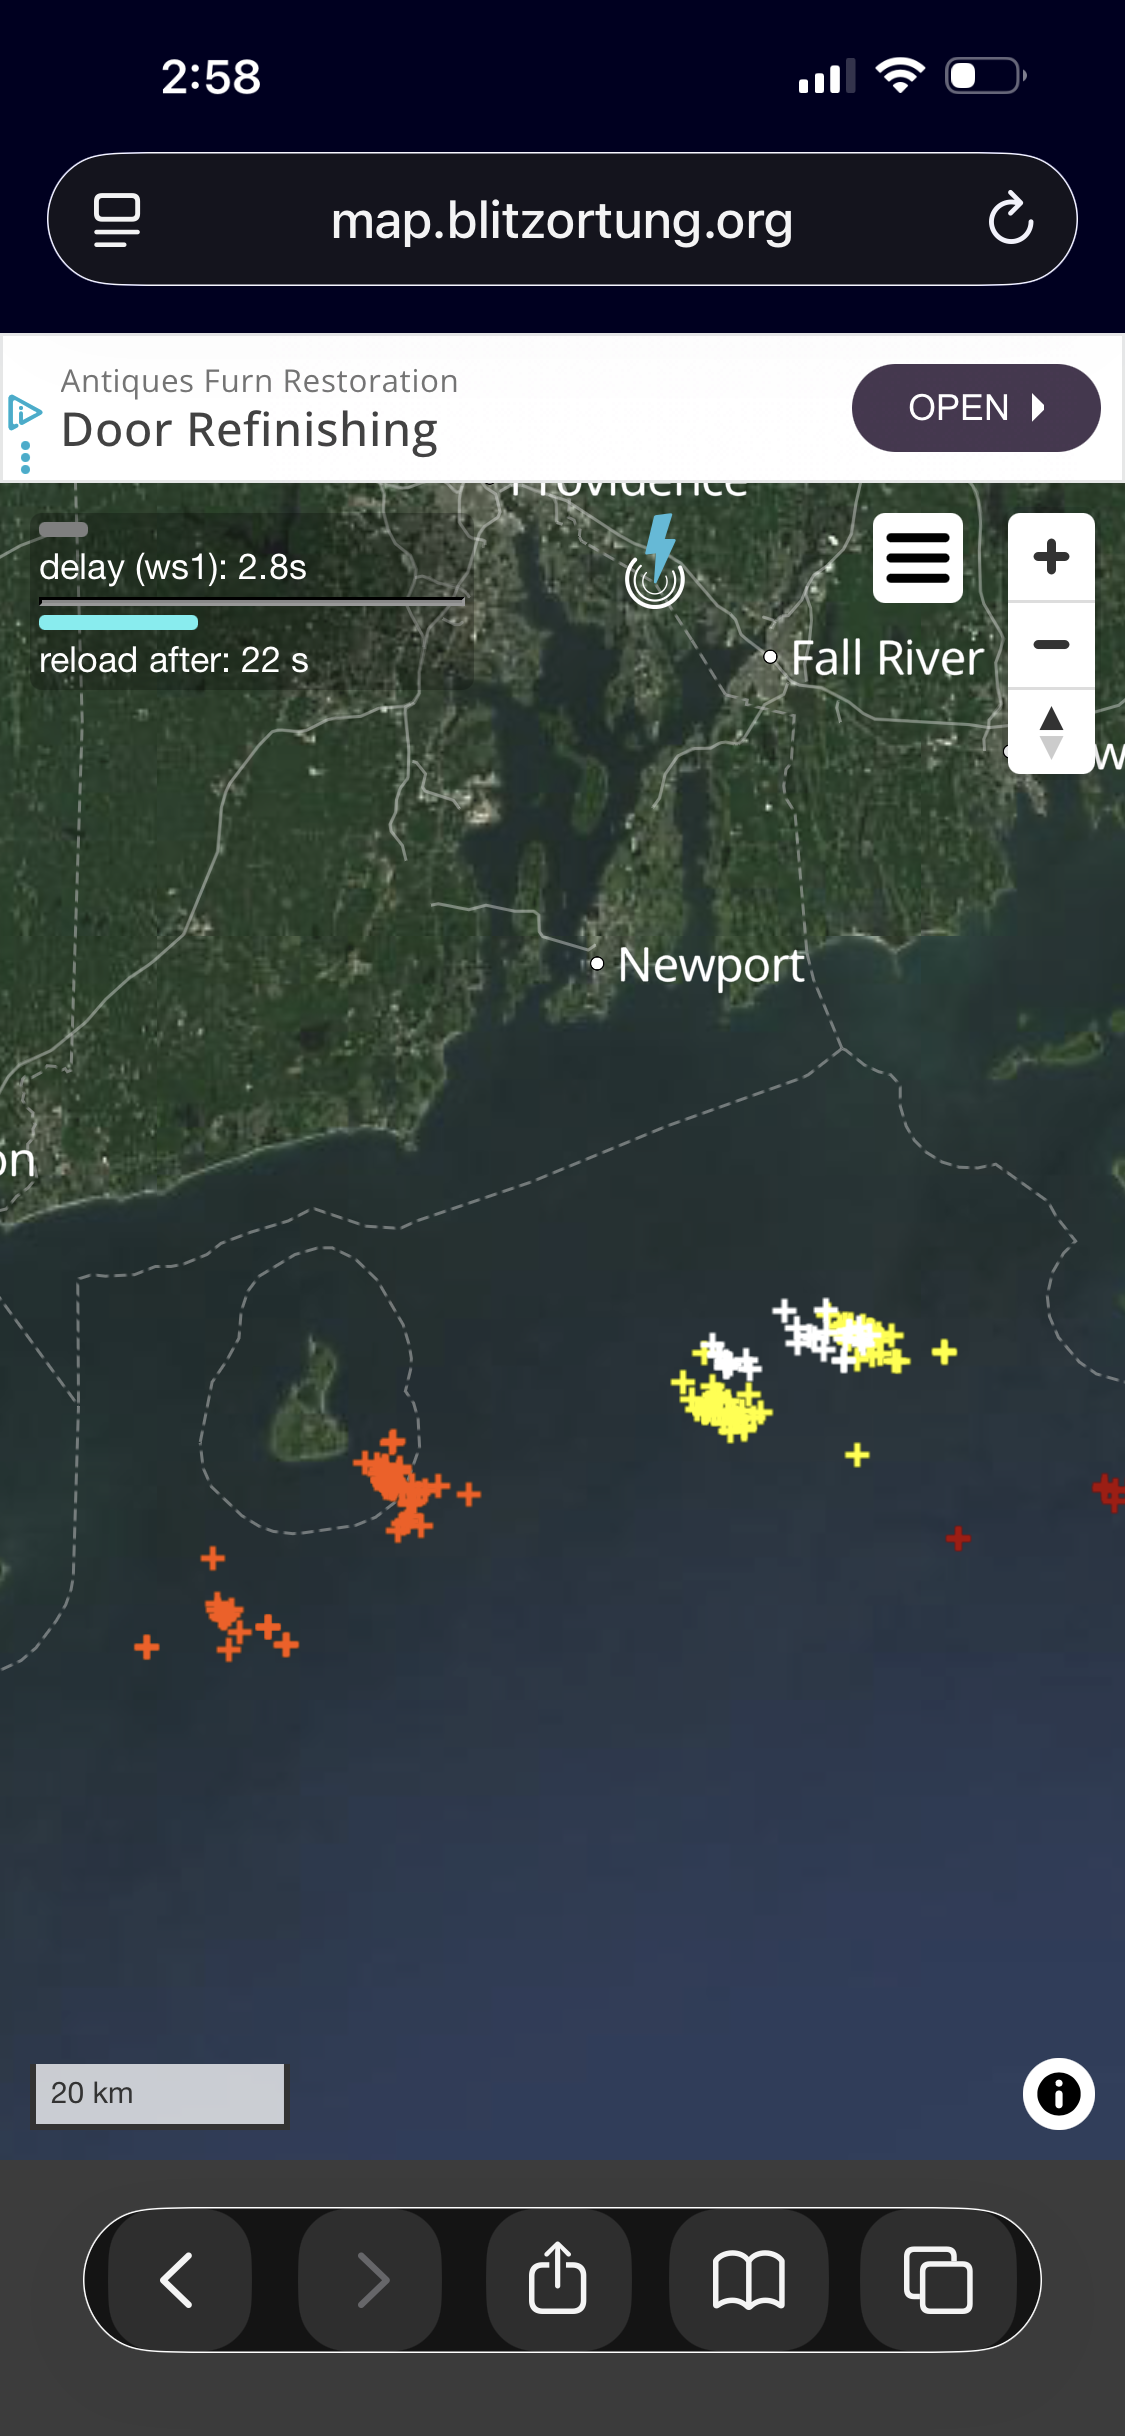
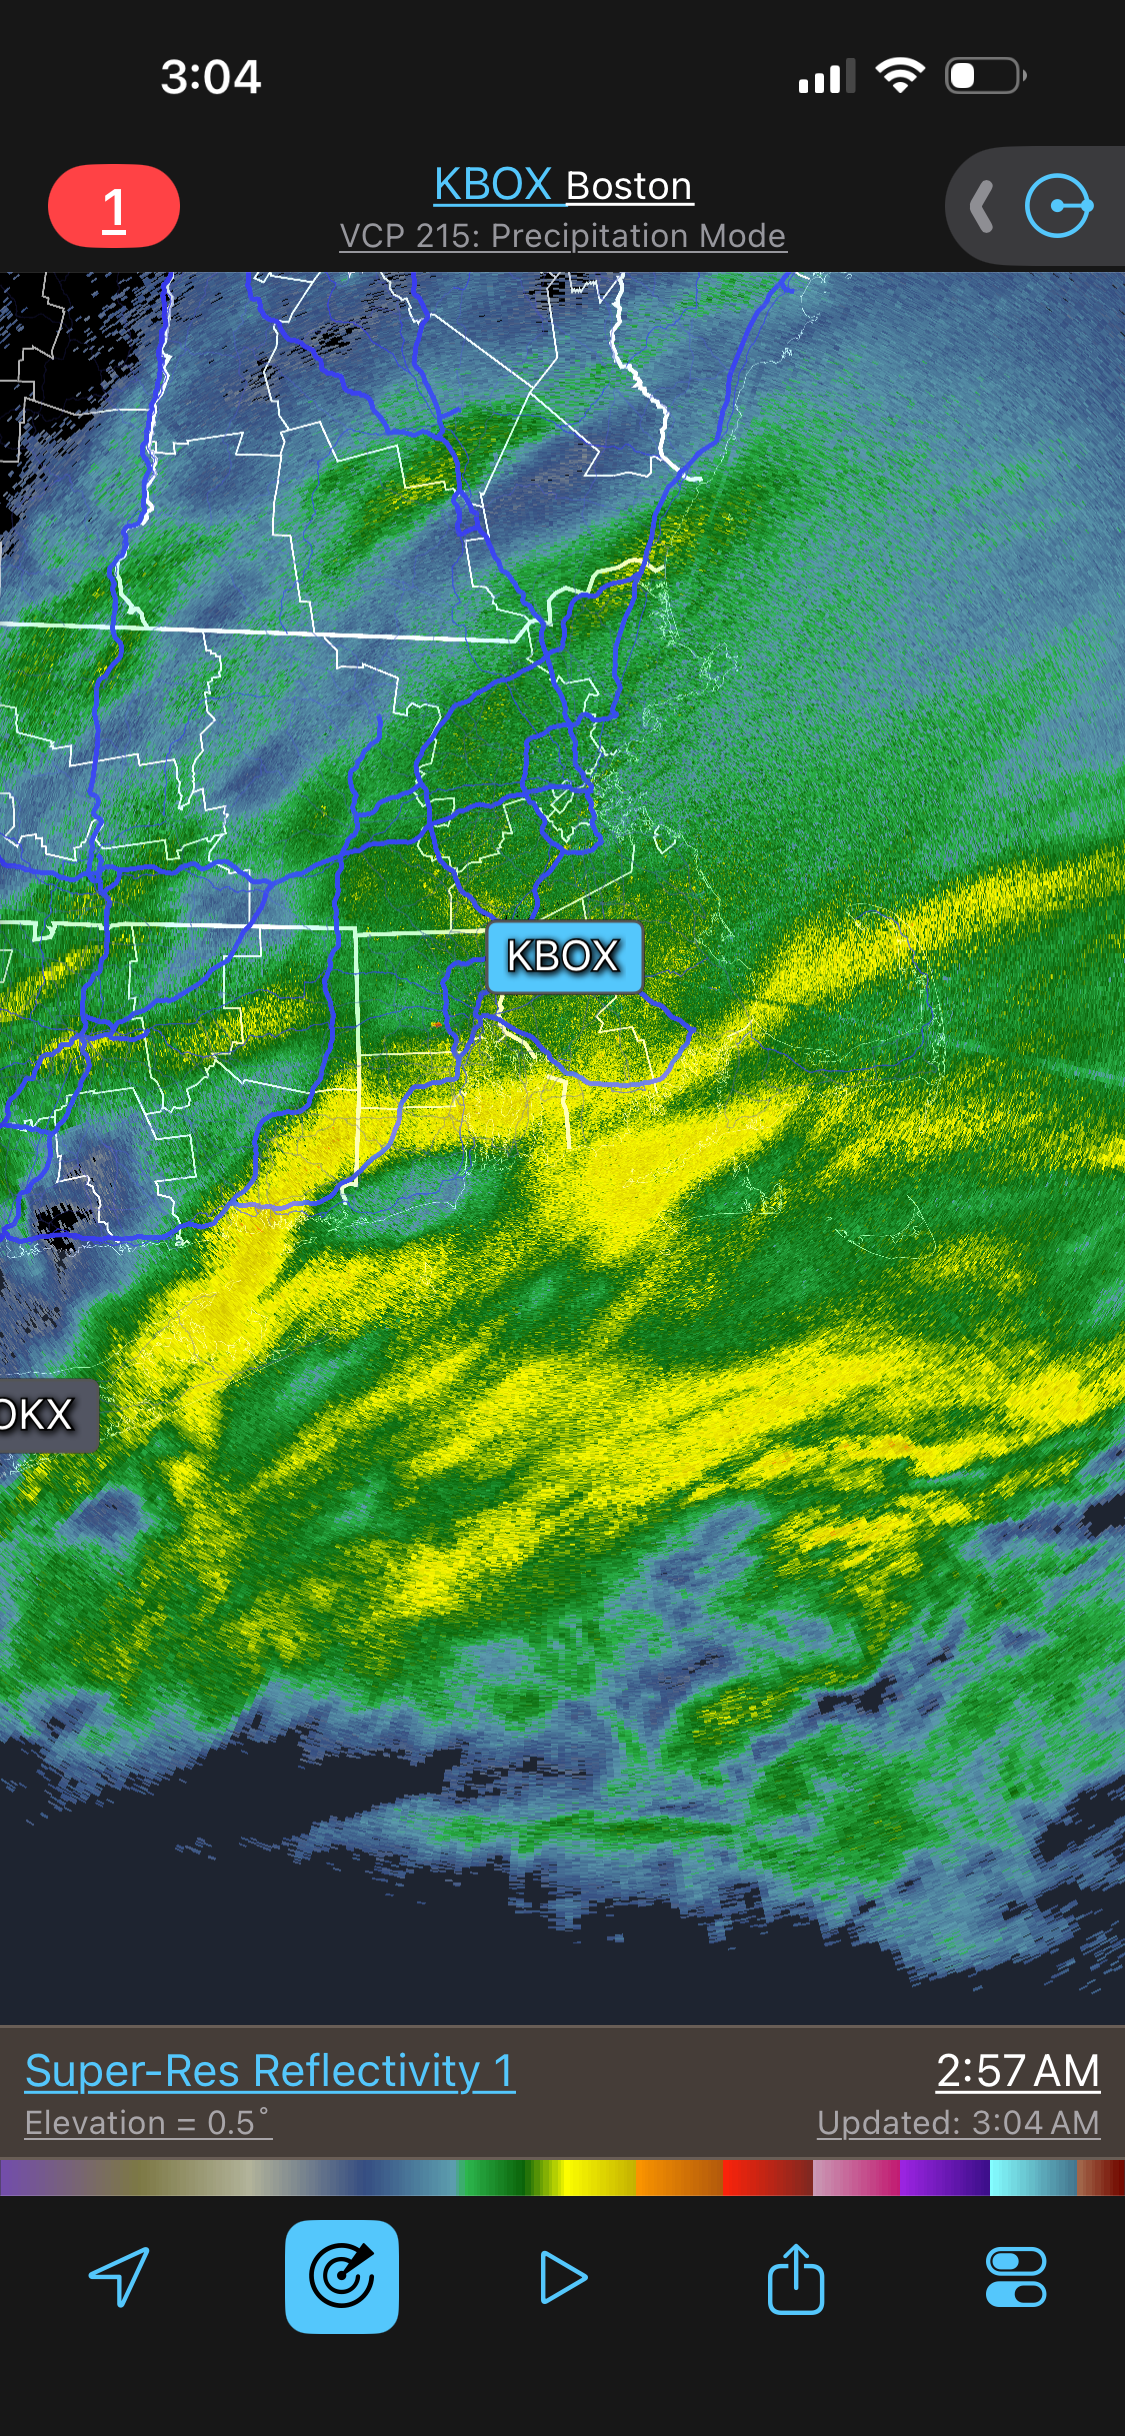
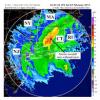
Just catching up on reading all these ob posted for this storm. Attached is the CG plot from around 3am Monday. That is a *lot* of CGs for S+ bands well N in the cold sector of a coastal, looks like several dozen over a 2 hr period. I can't recall that so many near or over SNE for a snowstorm, even the Bliz of 93. On the BOX radar from 257am Mon attached, the uber snow weenies here I bet can answer this question. That much solid 30 dBZ in multiple bands for for a SNE snowstorm? Often it is more peppered dBZ 30-35 within 20-29 dBZ for bands like this, but not so solid. So how does this radar rank for S+ weenie bands? And BOX radar was not running "hot." I checked OKX at the same time and the dBZ matched over SE CT.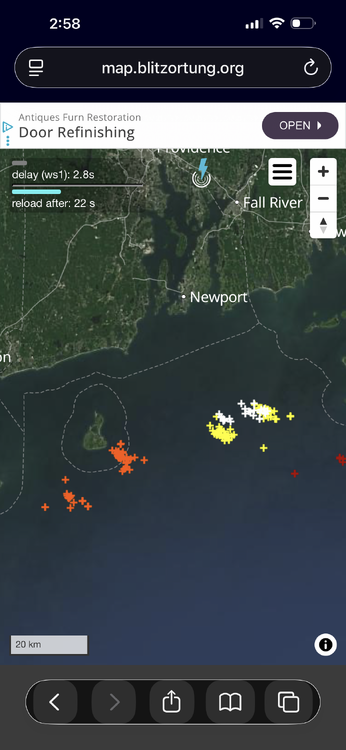

-
Pittsburgh/Western PA WINTER ‘25/‘26
Rd9108 replied to Burghblizz's topic in Upstate New York/Pennsylvania
Looks like we are 10 inches above normal compared to the normal this time of year. Still time to add on. Can we get 50 or even 60. Still plenty of time. -

"Don’t do it" 2026 Blizzard obs, updates and pictures.
powderfreak replied to Ginx snewx's topic in New England
It is intriguing to think of the societal impact if that SE Mass firehose was a bit north and going from BOS to HFD… instead of like Long Island to PVD/TAN ENEward. I would’ve enjoyed that low tracking over PVD to BOS, lol. -

Central PA Winter 25/26 Discussion and Obs
Jns2183 replied to MAG5035's topic in Upstate New York/Pennsylvania
The Regime Transition Probability Map is a visualization of a Markov Chain transition matrix, designed to quantify the likelihood of shifts between specific atmospheric states. It represents a century of regional snowfall data processed through a K-Means clustering algorithm. Statistical Mechanics of the Map * Axes: The vertical axis (Current Cluster) defines the point of origin, representing the weather regime of the most recent event. The horizontal axis (Next Cluster) represents the predicted destination for the subsequent atmospheric event. * Probability Density: The numerical values and corresponding blue shading represent the probability (0.0 to 1.0) of a transition occurring between any two clusters. A value closer to 1.0 (darker blue) indicates a high statistical probability, while a value closer to 0.0 (lighter blue) suggests a rare or unlikely transition. Current Regime Analysis: Transition from Cluster 3 Following the high-intensity coastal event on February 23, the atmospheric state is currently positioned in Cluster 3 (Extreme Synoptic). Analyzing the Row 3 data provides the following probabilistic insights: * Pattern Persistence (3 to 3): The probability located at the intersection of Row 3 and Column 3 quantifies the likelihood of the atmosphere remaining in a high-intensity coastal redevelopment cycle. * Regime Decay (3 to 2): Historically, late-February Cluster 3 events exhibit a strong statistical trend toward Cluster 2 (Clipper / Fast-Moving). This represents a transition from high-payload moisture systems to lower-accumulation, high-ratio arctic systems. * Inland Transition (3 to 1): The probability of shifting to Cluster 1 (Miller B / Overrunning) indicates the likelihood of the next system following an inland track rather than the coastal track observed yesterday. Probabilistic Representation The map demonstrates that weather patterns are not random but operate within a set of statistically favored transitions. For a Cluster 3 point of origin, the high concentration of probability in the Cluster 2 column suggests a regime shift toward diminished regional totals. This indicates that while extreme events like the one yesterday are significant, they are statistically followed by a period of lower intensity as the seasonal atmospheric steering flow begins its spring transition. Sent from my SM-S731U using Tapatalk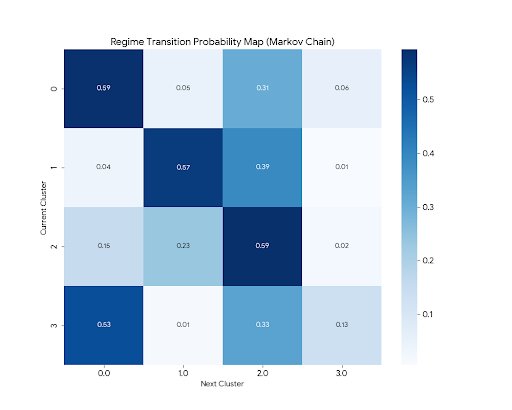
-

Clipper Fires In Wednesday Feb 25 Disco/ Obs
512high replied to Damage In Tolland's topic in New England
6" yesterday (and Chris we are well over 60" so far, last year year 42 1/4"+/-, year before 32") I happy with this season so far, despite missing on yesterday big dog.) -
Is we back? February discussion thread
WeatherGeek2025 replied to mahk_webstah's topic in New England
me too how can u say no to snow! wtf -
"Don’t do it" 2026 Blizzard obs, updates and pictures.
WxWatcher007 replied to Ginx snewx's topic in New England
Quiet hurricane season inbound. Wow, sucker hole across CT. Now this is a winner. Us valley dwellers get screwed way too often in all kinds of setups. -
@The 4 Seasons, not sure if I told you, but couple friends in Warren and Goshen both measured, 13" and 14.7" respectively, I see a 6" total that looks like it's about Northfield area, and I can say personally I saw way more than that unless they forgot to update, but it's out of place, and mine is 15.2" not sure who recorded the 15.6, but like I said, I'll take the extra stat pad. Couple of coaches I know in New Milford were both over 19" but map already shows it. just an update for the archives.
-
Well this town goes from like 300' to over 1000' and I'm at 540'. I'd def take your location on the hill over mine. 1k to 1k I bet there isn't much diff. Our latitude helps in swfes and maybe we catch the stray streamer but we also get subsidence here more often and are further away from the moisture in ocean storms.
-

E PA/NJ/DE Spring 2026 Obs/Discussion
MJO812 replied to PhiEaglesfan712's topic in Philadelphia Region
Not sure how long it will last with the PV taking a big hit. -
I will take it
-

Clipper Fires In Wednesday Feb 25 Disco/ Obs
Brian5671 replied to Damage In Tolland's topic in New England
HRRR getting drier FWIW -

Is we back? February discussion thread
Damage In Tolland replied to mahk_webstah's topic in New England
Mine is 60” . I’d have to believe Burptown is higher than here . More like 65-70 -
Clipper Fires In Wednesday Feb 25 Disco/ Obs
FXWX replied to Damage In Tolland's topic in New England
Not shocked given some ongoing issues in that area. I do think 3 inches is the possible, but I have stayed under that other than indicating spotty areas; yet to be determined. Odd they used wording of heavy band of snow... They are one of my clients and I did not use the term heavy nor 3"expected. Concerns over ongoing road issues and a period accumulating snow; certainly! Enjoy the time with the rugrats, can never get enough time with the little ones. -
What did you get?
-
gonna be a helluva lot longer than that.
-
Central PA Winter 25/26 Discussion and Obs
Jns2183 replied to MAG5035's topic in Upstate New York/Pennsylvania
If anyone wants it I have daily snowfall, snow depth, max temperature, min temperature. data so far for 1/1/1925 to 12/31/2025 from about 35 stations across Virginia, Maryland, Delaware, Pennsylvania, New Jersey, New York, Connecticut, Rhode Island, Massachusetts. I was able to use Google Colab and python script to combine it all in csv. It's big for a csv, over a 100mb. I converted it into a paraquat file to use more easily in python and that's just over 9mb. Regime 0 (Steady Coastal - Miller A): Features three sub-regimes. Variant 0.1 is the outlier here, representing high-moisture coastal systems that dump significantly more than the baseline. Regime 1 (Miller B / Overrunning): Highly frequent but generally lower in average intensity. Variant 1.2 is the heavy-hitter for this category, often associated with redeveloping systems that "capture" deep moisture. Regime 2 (Clipper / Fast-Moving): This is your most frequent baseline. Variant 2.0 represents the "peak" clipper—fast, cold, and efficient, occurring nearly 500 times in the century. Regime 3 (Extreme Synoptic): The "Big One" category. Even its "weakest" variant (3.0) averages nearly 3 inches of snow, while the primary peak (3.1) averages 4 inches across the entire regional station network. The graphic also includes the Event Counts for each sub-cluster, allowing you to see which atmospheric setups are common versus which are rare historical anomalies. Sent from my SM-S731U using Tapatalk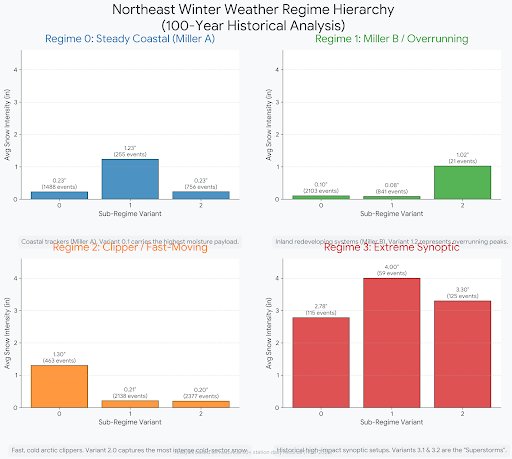
.thumb.jpg.1236cfa62f159471d7d85f175087788f.jpg)
-
compared to some of the snow maps, sure. but most guidance hit well. i remember when the euro had that thing locked in from a week+ out, and only lost briefly it for a run or two several days out.
-

Clipper Fires In Wednesday Feb 25 Disco/ Obs
Spaizzo replied to Damage In Tolland's topic in New England
I know several towns around here that are waiting until morning already called a delay. They’ll call it around 6 they still don’t get through school lot and yard cleanups because we had a parking ban and the lots are used for residents…If it’s snowing past 7/8 they’ll likely call it here . -
.thumb.jpg.6a4895b2a43f87359e4e7d04a6fa0d14.jpg)
Central PA Winter 25/26 Discussion and Obs
Yardstickgozinya replied to MAG5035's topic in Upstate New York/Pennsylvania
I'm not saying you don't speak the truth, but I have an unscientific hunch we're in for an anomalous spring. -
Tony, I have been on the New England section of this board a lot more recently. You'll find that the uber of uber snow weenies all here, and the passion has not waned. "CoastalWx" probably tops them all, at least for number of posts he has done over the last 15 years (take a look at his stats). Boris
-
let's go to mid March with a bang, then need to get some melting so garden work can begin! still a ways a way but like the trend so far.


.jpg.fbdd40b4b77d3a2ff5dcff085992813b.jpg)
