All Activity
- Past hour
-

Spooky Season (October Disco Thread)
ineedsnow replied to Prismshine Productions's topic in New England
Euro also has something coming up.. atleast the pattern isn't as bad for this one -
These departures are against are warmest normals. They're like +5 or better compared to 90s averages
-
Cool. Just let the 31st be dry.
-
NOAA has a Pacific Ocean heat "blob" Blobtracker Web site. It tracks large areas of heat under the ocean's surface. These areas can affect weather "thousands of miles away." Right now, there is a very large blob of heat stretching from Alaska to California. I found the whole thing...fascinating. Link is the article, NOAA Blog tracker link below: https://www.kuow.org/stories/return-of-the-blob-heat-wave-spans-pacific-ocean https://www.integratedecosystemassessment.noaa.gov/regions/california-current/california-current-marine-heatwave-tracker-blobtracker
-
Chubbs- A reminder, once again....As you may recall- a seperate thread was created for your ongoing quest to debate Chester County Pa with the resident troll here. If you could take that "debate" there, along with the troll- I think many of us who don't care about Chester County Pa weather site trivia would be better off for it. Thanks
-
Not too bad considering the torch we had to endure
-
Not looking good for a second severe season here. I feel like I live in California with this weather to be honest
-
Most areas in the +1 to +3 range for the first two weeks of October. FWN….+2.1° TTN……+1.2° SMQ…..+2.1° NBW….+3.1° EWR…..+2.6° NYC…..+1.7° JFK……+1.6° LGA……+0.9 HPN…..+3.4° ISP…….+3.2° BDR…..-0.2° HVN…..+3.2° DXR……+3.1° POU…..+1.6°
-
Chuck's research shows a bias toward a +NAO during winter when October is negative. I'd like to know where DT gets his idea of the opposite. Don't get me wrong, I'm pulling for DT's opinion to be right. Just wondering the basis of his opinion.
-

Spooky Season (October Disco Thread)
CoastalWx replied to Prismshine Productions's topic in New England
Good luck -

Central PA Fall Discussions and Obs
Mikeymac5306 replied to ChescoWx's topic in Upstate New York/Pennsylvania
It's been active. Just active in the Atlantic. -

-
It is finally over. Residual fog this AM but the birds are back chirping away.
-
Spooky Season (October Disco Thread)
ineedsnow replied to Prismshine Productions's topic in New England
Next frame is even better i would take that -

-

Spooky Season (October Disco Thread)
MJO812 replied to Prismshine Productions's topic in New England
-
6z gfs

-
Globalism can refer to cultural, political or economic exchange. Our over-reliance on Asia has imported a large number of invasive species.
-
Spooky Season (October Disco Thread)
ineedsnow replied to Prismshine Productions's topic in New England
When both the Euro and Gfs have something.. we watch.. so far out though - Today
-
That looks alot like Sandy
-
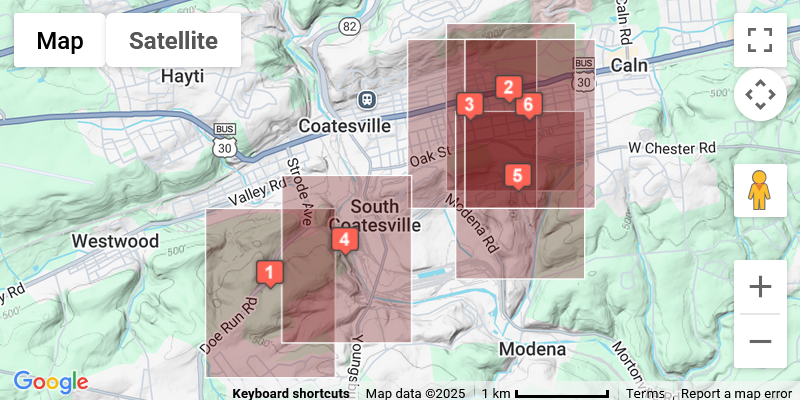
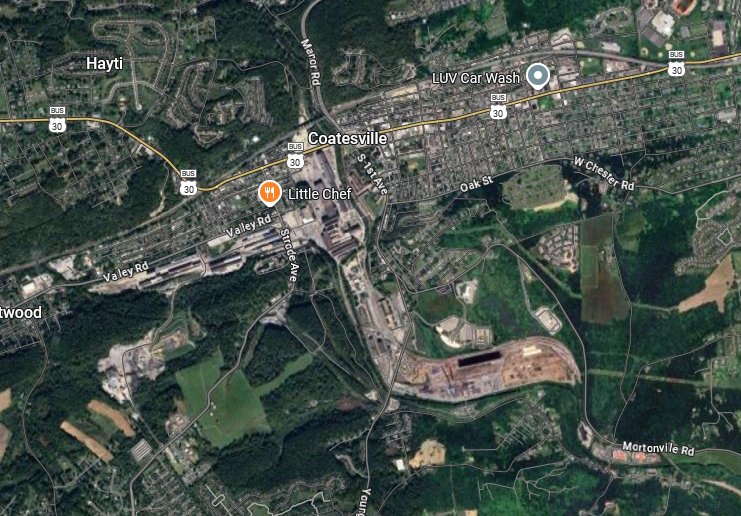
Yes, data adjustment is needed and successful. Here is a map of Coatesville 1SW COOP station locations from NCDC, illustrating the large range in station local site conditions for this one COOP station. The COOP data was collected by volunteers whose lives changed with time, resulting in station changes. Also attached a satellite views showing the complexity of local land use. Coatesville is a steel town. The link below provides information on the steel mill. When the Coatesville Coop first collected data in 1894 the steel mill was the largest in the US. The mill reached its largest size during WWII with over 6000 employees. The Coatesville 1SW COOP station was active from 1894 to 1982. The stations are numbered starting with site #1, the most recent which was active from 1948 to 1982. Site #6 is the oldest. Pictures of sites 1 and 2 are shown a couple of posts above. You aren't going to get an accurate picture of Chester County's climate if you assume that all of these stations are exactly the same. Fortunately we have thousands of weather stations in the US. Which makes it easy to separate weather and station moves using well established procedures. https://en.wikipedia.org/wiki/Lukens_Steel_Company
-

Central PA Fall Discussions and Obs
Mount Joy Snowman replied to ChescoWx's topic in Upstate New York/Pennsylvania
Low of 50. Some nice crisp fall nights ahead. -

Spooky Season (October Disco Thread)
Damage In Tolland replied to Prismshine Productions's topic in New England
Euro looks solid -
Spooky Season (October Disco Thread)
ineedsnow replied to Prismshine Productions's topic in New England
GFS and the Euro now have something late month -
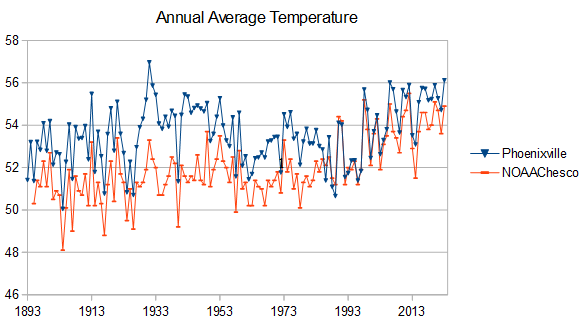
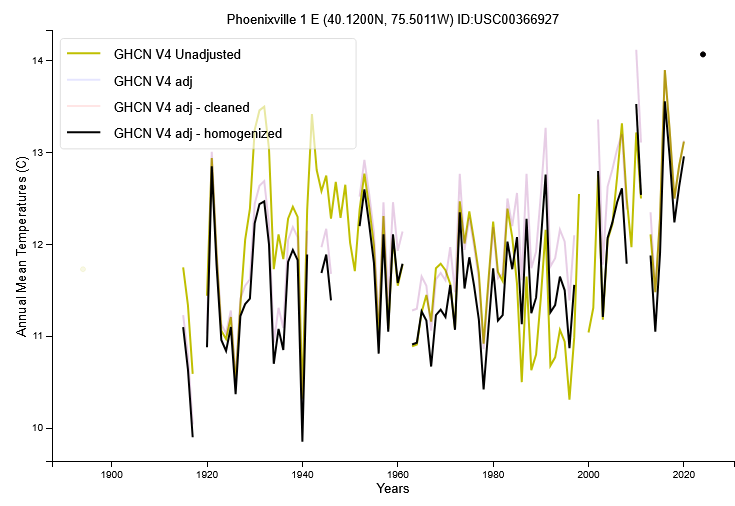
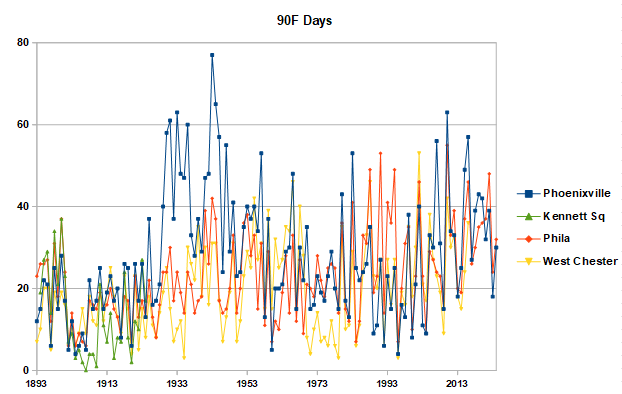
We don't have any Chesco stations that haven't had major changes. But one station, Phoenixville, provides consistent data for 1890-1926 vs present. Phoenixville has had moves and station changes, but has remained on the local water property site since 1893. This site, with a small reservoir, has not seen any significant development during the period of station operation. There have been major station changes at Phoenixville however, which we have documented previously on this site. The station ran spuriously warm between 1927 and 1949, particularly on summer afternoons; and, ran cool in the 1990s. There is also a fair bit of missing data Charts below: 1) Phoenixville and NOAA Chesco showing good agreement on the roughly 4F Chesco temperature rise between the 1890s and present. 2) Adjusted and unadjusted temperatures for Phoenixville showing the roughly 4F warming in both the adjusted and unadjusted data, but with large adjustments for 1927-49 and the 1990s as discussed above, and 3) Annual 90F days for Phoenixville and other stations showing a large spurious spike at Phoenixville in the 1927-48 period, illustrating the station warmth during this period. We've been going over the Chester County data in detail for over a year. Well documented in the Chester County thread. I would be glad to answer any questions if you are interested. The raw data in Chester County paints a very consistent picture of warming that is captured accurately by NOAA. The fact that Paul (Chescowx) can't find warming tells us more about himself than Chester County's weather.