All Activity
- Past hour
-

Augdewst 2026: Summer's Last Stand
RUNNAWAYICEBERG replied to Prismshine Productions's topic in New England
Is TWives expecting just some drizzle? -
I don’t really have any other options with the trees and hills. It’s fairly accurate even in the sun except possibly earlier in summer
-
SPC mentions the Mid-Atlantic in its Day 4-8 disco for Thursday and the weekend. Doesn't sound like anything huge... but the threat is there Day 4-8 Convective Outlook NWS Storm Prediction Center Norman OK 0329 AM CDT Mon Aug 03 2026 Valid 061200Z - 111200Z ...DISCUSSION... ...Day 4/Thursday... Broad troughing is forecast from the northern Plains through the Great Lakes with a series of disturbances moving through that airflow pattern. Elsewhere, an elongated vorticity ribbon will progress from the central and southern Appalachians into the Northeast. At the surface, a front initially from the southern Great Lakes into the southern Plains is forecast to weaken. Over the eastern CONUS, southerly winds will maintain a broad corridor of 70+ F dewpoints along and east of the Appalachians, which will contribute to moderate instability by afternoon. Aided by the approach of the disturbance aloft, thunderstorms are expected to increase in coverage through the afternoon with some severe weather possible. Generally weak vertical shear and the absence of a coherent front in the region lead to uncertainty in where the greatest threat may materialize. An isolated severe threat may also develop along the front from the Ozark Plateau into the southern High Plains, and in AZ during the afternoon and evening. ...Day 5/Friday... An intense mid/upper-level low is expected to evolve over central Canada with upper highs situated over the Great Basin and off the Mid-Atlantic Coast. Between those features, corridors of stronger mid-level flow are forecast from the northern Rockies into the northern Plains, and to a lesser extent over the Northeast. Some severe weather threat may again materialize from the Mid-Atlantic into southern New England in the vicinity of a surface trough. However, the strongest vertical shear is forecast to be displaced to the north of the stronger instability, leading to uncertainty in the extent of the severe weather threat. Isolated severe storms also appear possible along a front moving into the upper MS Valley. ...Days 6-8/Saturday through Monday... The various 00Z ensemble means indicate an upper low initially over Hudson Bay shifting east into northern QC with persistent ridging over the southern CONUS. Between those features, a belt of enhanced mid-level flow is forecast across the northern tier of states with some signal for continued troughing through Sunday over the Great Lakes into the OH Valley. At the surface, there is ensemble member clustering in surface low positions over the northern Plains along a front extending into the upper Great Lakes. There is a model signal for the front to continue into the Great Lakes and Midwest, where some severe weather threat appears possible. A separate severe weather risk may also persist from the Mid-Atlantic into New England. ..Mead.. 08/03/2026
-
.thumb.gif.f92b16c631a1d15d405ed77b33f0710d.gif)
Augdewst 2026: Summer's Last Stand
Torch Tiger replied to Prismshine Productions's topic in New England
Ripping, heaviest of summer -

Central PA Summer 2026 Discussion/Obs Thread
Mount Joy Snowman replied to Voyager's topic in Upstate New York/Pennsylvania
Yeah it's been a few weeks, as we keep getting caught in the middle. I managed to squeeze out .21" yesterday but we were up in Morgantown for most of the day where they got much more. Low of 73 as the muggies roll along. #DogDays -

Augdewst 2026: Summer's Last Stand
dendrite replied to Prismshine Productions's topic in New England
Had to change tblizz’s icon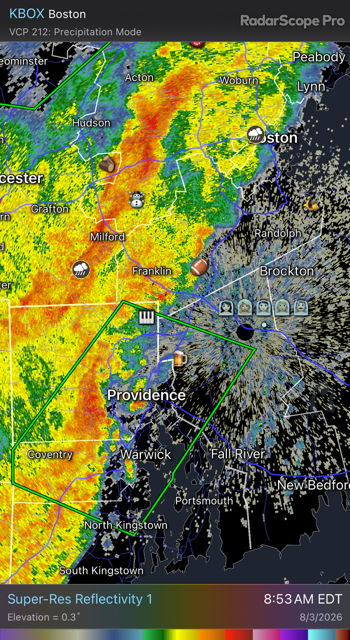
-
Sure thing. Unlike SPC, the marginal flood risks are so benign that I'm not sure it's worth including.
-
Records: Highs: EWR: 101 (2006) NYC: 97 (2005) LGA: 100 (2006) JFK: 99 (2006) Lows: EWR: 57 (1953) NYC: 55 (1927) LGA: 59 (1953) JFK: 56 (1964) Historical: 1864: A waterspout over Albemarle Sound, NC passed perilously close to the Union Fleet at anchor. The crews of the ships watched "in awe" as the whirlwind dissipated as it moved onshore. (Ref. Wilson Wx. History) 1885 - A tornado hit Philadelphia and Camden along its eight mile path. (David Ludlum) 1885: A tornado causing estimated F3 damage hit Philadelphia and Camden along its eight-mile path. Six people were killed and damage totaled $500,000 dollars. Other tornadoes causing estimated F2 damage touched down in Cecil County, Maryland, New Castle County, Delaware and Bucks & Chester Counties in Pennsylvania. (David Ludlum) 1894: After two record heat waves in July, record cool weather arrives. Lansing, MI fell to 32° for a rare summer freezing temperature. (Ref. Wilson Wx. History) 1898: Philadelphia, PA had one of their worst thunderstorms ever when 5.84 inches fell in just 2 hours. The hydraulic pressure in the city sewers caused by the force of the accumulated runoff created overflows via toilets, basins, and sinks to rise to second floor levels in some cases. (Ref. AccWeather Weather History) 1899: A tropical depression was born in the tropical Atlantic. Before it finally dissipated a record 33 days later, it became known as the San Ciriaco Hurricane after a Puerto Rican village the storm devastated. Its life as a hurricane was 27.75 days, a record for the Atlantic Basin beating Hurricane Ginger of 1971 by three-quarters of a day. (Ref. Wilson Wx. History) 1960: A home in Wauponsee Township, IL was struck by two tornadoes within 4 hours. The first one struck around 7 PM and the second around 11 PM. The house sustained significant damage to the roof, wiring and appliances. (Ref. AccWeather Weather History) 1964: Muskegon, MI set an August record and tied their all-time record high temperature at 99°. The temperature hit 100° at Grand Rapids, MI a record for the date. Owen, WI set their all-time record high with 101°. (Ref. AccWeather Weather History) 1970 - Hurricane Celia struck the coast of Texas producing wind gusts to 161 mph at Corpus Christi, and estimated wind gusts of 180 mph at Arkansas Pass. The hurricane was the most destructive of record along the Texas coast causing 454 million dollars damage, and also claimed eleven lives. (David Ludlum) (The Weather Channel) 1974: Brooklyn, CT -- Lightning struck and killed a youth when he was running from a tent toward home at 2:40 a.m. (Ref. Lightning-The Underrated Killer.pdf) 1975: Boston, Massachusetts had a 83 °F temperature the warmest minimum temperature. (Highest minimum on Boston's records) (Ref. NOAA Boston Weather Events) 1981: Severe thunderstorms tore across portions of central and eastern South Dakota. Near Hoven, a steel bin building was lifted off the ground by a small tornado and carried about 30 feet before it wrapped around a tree. In Faulkton, winds gusted to 97 mph at the Faulkton airport. The extremely high winds destroyed an airport hanger and damaged a grain elevator. At Redfield, 70 mph winds leveled an outdoor movie screen and flipped a plane. (Ref. Wilson Wx. History) 1986: The minimum temperature of 69° is first below 70 °F recorded in the past 28 days at DCA. (Ref. Washington Weather Records - KDCA) 1987 - A severe thunderstorm moved across Cheyenne, WY, during the mid afternoon. The thunderstorm produced hailstones up to two inches in diameter causing more than 37 million dollars damage. The eastern U.S. sweltered in the heat. A dozen cities reported record high temperatures for the date, including Paducah KY with a reading of 102 degrees. Beckley WV established an all- time record with an afternoon high of 93 degrees. (Storm Data) (The National Weather Summary) 1988 - Thunderstorms developing ahead of a slow moving cold front produced severe weather from the Central High Plains to the Upper Great Lakes Region. Thunderstorms around Fort Collins, CO, produced wind gusts to 74 mph along with marble size hail. Sixteen persons were injured in the storm, most of whom were accidently locked out of their office building, having evacuated it when the fire alarm went off, apparently triggered by lightning. (Storm Data) (The National Weather Summary) 1989 - Thunderstorms representing what remained of Hurricane Chantal drenched Wichita, KS, with 2.20 inches of rain in four hours during the early morning. Thunderstorms developing in Minnesota produced wind gusts to 85 mph at Baudette during the afternoon, and softball size hail at Lake Kabetogama, during the evening. Jamestown, ND, reported a record hot afternoon high of 103 degrees. (Storm Data) (The National Weather Summary) 1993: Chesterfield County, VA lightning struck and killed a 30-year-old man as he mowed his lawn. (Ref. Lightning - Virginia Weather History) Workers desperate to save the historic town of Prarier du Rocher, IL during the Mississippi River Flood deliberately broke a 1,000 foot hole in a levee near the town to divert water headed toward the town from a levee break upstream. The quick action worked, saving the town. (Ref. Wilson Wx. History) 1994: Fairbanks, AK recorded their hottest August temperature ever with 93°. (Ref. AccWeather Weather History) 1995: Hurricane Erin was nearing the coast of the Florida Panhandle. The hurricane had emerged into the Gulf Mexico the previous day after crossing the Florida Peninsula. By early morning, Erin's sustained winds reached 100 mph in a small area near its center. A 98-mph wind gust was observed at Mary Esther Field and Fort Walton Beach, FL. The storm came ashore near Pensacola, FL later that morning causing six fatalities and an estimated $700 million damage. The barrier island stretching from Pensacola Beach to Navarre Beach absorbed the brunt of the storm as it came ashore near Pensacola. Sustained winds of 94 mph and gusts up to 103 mph were measured at Pensacola during the height of the storm. Seven people were reported missing at sea. 2002: Two campers at Natural Chimneys Regional Park in Augusta County, VA were struck and injured by lightning. (Ref. Lightning - Virginia Weather History) 2003: Severe thunderstorms moved over parts of the Chicago Metro area during the early afternoon. The storms produced golf ball size hail along with heavy rain and flooding. 4.14 inches was reported in just 90 minutes six miles east of O’Hare Airport. Four to six feet of water covered the closed Kennedy Expressway. Several tents were blown down at an outdoor festival in Roselle. These storms continued into the evening producing more large hail. The National Weather Service at Romeoville reported nickel size hail for five minutes and 1.60 inches of rain in just 30 minutes. (Ref. Wilson Wx. History)
-
78 cloudy southerly wind Dewpoint 75. 1.70 in the bucket. On / off rain/ storms today in this very humid flow with cutoff to our west and atlantic ridge to our east. Overall higher heights on S/SW flow with Strong Atlantic ridge hugging the coast the next 10 days with above normal temps and humidity with rain chances warm - hot at times. Period 8/6 - 8/13 looks to have heatwave potential and include the next strong 95+ heat in the 8/9 - 8/11 range.
-
Augdewst 2026: Summer's Last Stand
dendrite replied to Prismshine Productions's topic in New England
A couple of 4”+ totals around ASH now. Love to see it. -
Augdewst 2026: Summer's Last Stand
dendrite replied to Prismshine Productions's topic in New England
Dry hands? -
Slight risks will likely be the min and I’ll parse through the data to find some of the more notable Slight Risk days across the country. Moderate and High Risks are basically automatic, so those are more low hanging fruit. Appreciate the comment and getting my brain jogging on the next project
-
Augdewst 2026: Summer's Last Stand
CT Valley Snowman replied to Prismshine Productions's topic in New England
Would rather jack in the winter but that basically doesn't happen here. -

Augdewst 2026: Summer's Last Stand
Lava Rock replied to Prismshine Productions's topic in New England
0.69". Badly needed. Hopefully can score another 0.5" at least. -
 The 1946 station move looks like a train switching from one track to another. Nice. Here is a view of surface temperatures from NASA's ECOSTRESS instrument on the space station. Coatesville 1 SW generally moves progressively from hotter to colder microclimates.
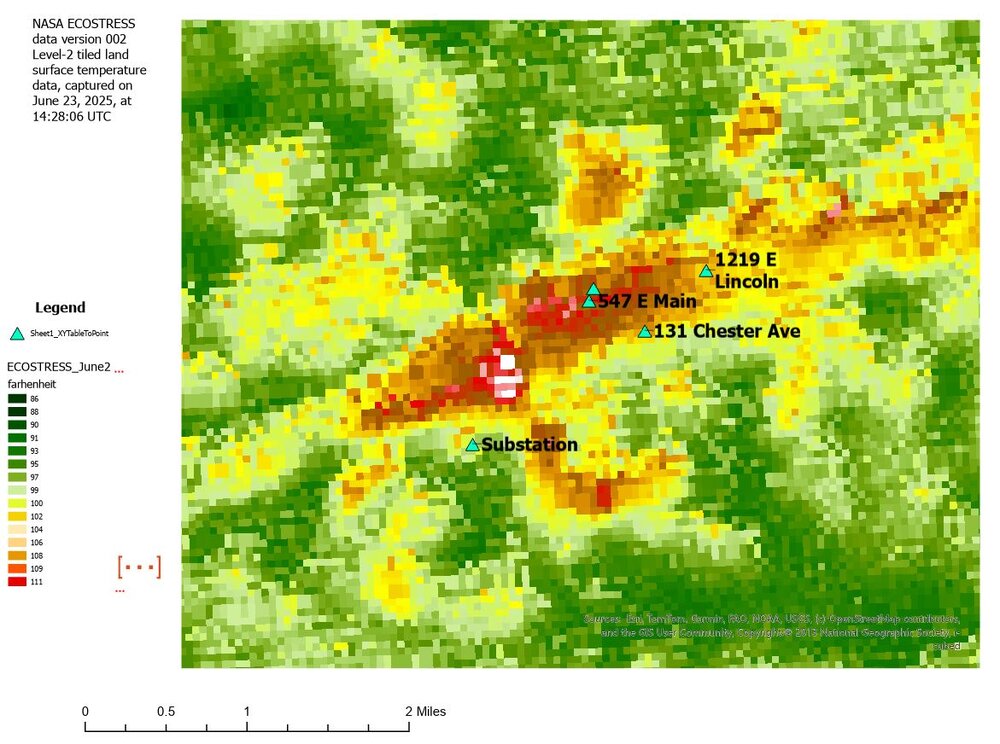
-
3.65
-
E PA/NJ/DE Summer 2026 Obs/Discussion
BBasile replied to PhiEaglesfan712's topic in Philadelphia Region
Doing a little better this morning. Up to 0.6" now. -
Yesterday’s 91 cinched the 4 week mark for PHL. Thirty is the average number in a given summer for Philadelphia. I am surprised the Franklin Institute does not have a higher number than 28 given that it’s smack dab in the middle of Center City.
-

Augdewst 2026: Summer's Last Stand
Brian5671 replied to Prismshine Productions's topic in New England
it's as far north as philly-that won't miss us -

Augdewst 2026: Summer's Last Stand
Sey-Mour Snow replied to Prismshine Productions's topic in New England
Stuff to the SW starting to blossom again -
Augdewst 2026: Summer's Last Stand
Brian5671 replied to Prismshine Productions's topic in New England
looks wet going forward too... -

Augdewst 2026: Summer's Last Stand
SouthCoastMA replied to Prismshine Productions's topic in New England
0.04" -

Augdewst 2026: Summer's Last Stand
Ginx snewx replied to Prismshine Productions's topic in New England
August 55? -
Augdewst 2026: Summer's Last Stand
dendrite replied to Prismshine Productions's topic in New England
Many were pegged this morning. -
Augdewst 2026: Summer's Last Stand
Brian5671 replied to Prismshine Productions's topic in New England
close to 20 inches of rain here in the last 30 days or so and no tropical storm/hurricane influence