All Activity
- Past hour
-
(002).thumb.png.6e3d9d46bca5fe41aab7a74871dd8af8.png) All three stations cooled at statistically the same rate as the surrounding stations. Additionally, in looking closer at potential TOB adjustments one may wonder why the West Chester 2NW and Coatesville 1SW records which predominantly relied on morning (AM) observations...so one would think the Raw TOB Distortion of an AM reading captures a naturally lower minimum, meaning the raw data was technically already too cool correct? The NCEI Adjustment you would think logically would be to correct for morning bias at Coatesville and West Chester by warming the historical record. However, NCEI's automated, grid-wide homogenization algorithms actually did the opposite by applying additional sweeping chilling adjustments to both of these stations data from 1895 through 1982.
All three stations cooled at statistically the same rate as the surrounding stations. Additionally, in looking closer at potential TOB adjustments one may wonder why the West Chester 2NW and Coatesville 1SW records which predominantly relied on morning (AM) observations...so one would think the Raw TOB Distortion of an AM reading captures a naturally lower minimum, meaning the raw data was technically already too cool correct? The NCEI Adjustment you would think logically would be to correct for morning bias at Coatesville and West Chester by warming the historical record. However, NCEI's automated, grid-wide homogenization algorithms actually did the opposite by applying additional sweeping chilling adjustments to both of these stations data from 1895 through 1982. -

2026-2027 Super El Nino
snowman19 replied to Stormchaserchuck1's topic in Weather Forecasting and Discussion
I agree Ray. I’m not understanding some of what I’m seeing on twitter calling for big west-based -NAO blocking this winter. Descending solar coming off a big max, high geomag, +QBO, super El Niño….sorry but that doesn’t scream -NAO blocking to me. But then again when you look at the account peddling that, it makes sense….. -

E PA/NJ/DE Summer 2026 Obs/Discussion
MGorse replied to PhiEaglesfan712's topic in Philadelphia Region
Got down to 56F early this morning. Currently 79F with a dew point of 53F. Nice! -
 Meanwhile, could be some fun in western zones tomorrow. Gotta get that warm front and its clouds through.
 -
 I always liked TK, but he’s def ACATT and definitely leans on the denying side.
 -
2026-2027 Super El Nino
snowman19 replied to Stormchaserchuck1's topic in Weather Forecasting and Discussion
I think it peaks strong come November -

2026-2027 Super El Nino
csnavywx replied to Stormchaserchuck1's topic in Weather Forecasting and Discussion
Record warm water volume this time: -

2026-2027 Super El Nino
GaWx replied to Stormchaserchuck1's topic in Weather Forecasting and Discussion
Do you have a guess for the +IOD peak? -

Central PA Summer 2026 Discussion/Obs Thread
canderson replied to Voyager's topic in Upstate New York/Pennsylvania
My Red Sox have won 13 straight. @Itstrainingtime’s O’s have won 7 straight. The meet tonight - let’s hope the O’s streak ends! -
2026-2027 Super El Nino
snowman19 replied to Stormchaserchuck1's topic in Weather Forecasting and Discussion
Here comes the +IOD….there are no road blocks ahead to stop this thing from strengthening and strengthening And with the projected TC forecasts, the WWBs and DWKWs are just going to keep coming -
The GFS, which has been playing catch up, has TD2 intensify a bit more than it did last run as it runs NW and then slides WSW below the LA coastline. AI GFS still weak.
-
I feel your pain. We’ve had some weird shield over us this week. I can’t even count how many times I’ve watched a storm miss me to the north through Dudley Shoals, and then 30 min later, Maiden.
-
 1 mg prednisone cost: TheraCore Pharmacy - TheraCore
 - Today
-
.thumb.gif.f92b16c631a1d15d405ed77b33f0710d.gif) Yeah only ~30 years on-air
Yeah only ~30 years on-air -
2026-2027 Super El Nino
40/70 Benchmark replied to Stormchaserchuck1's topic in Weather Forecasting and Discussion
Notice 1997-1998 didn't have a big +NAO? It occurred during ascending solar, not too far removed from solar min....not to mention -QBO. -
2026-2027 Super El Nino
40/70 Benchmark replied to Stormchaserchuck1's topic in Weather Forecasting and Discussion
@Stormchaserchuck1, I think I know why the connection between intense El Niño and +NAO seems overstated....the causation for the +NAO during intense El Niño is likely more due to higher-end El Niño being favored during descending solar/peak geomagnetic energy, rather then the intense El Nino itself. Descending solar/high geomagnetic is the actual "smoking-gun" behind the +NAO causation, however, intense El Niño with all of that warmth leaking east does inhibit -NAO, I'm sure. The combo together is lethal if you're hoping for big blocking. https://www.issibern.ch/teams/interplanetarydisturb/wp-content/uploads/sites/14/2015/01/Asikainen_03_2014.pdf -
2026-2027 Super El Nino
csnavywx replied to Stormchaserchuck1's topic in Weather Forecasting and Discussion
Yes. The keystone paper you're looking for is here: Influence of the state of the Indian Ocean Dipole on the following year’s El Niño | Nature Geoscience Made a note of it last year, but at that point it looked initially like a moderate event was most likely. wxchris on X: "The recent record/near record -IOD is collapsing. Warm water is sloshing east towards the WPac, putting the fully mature Nina on borrowed time. Expect whiplash. https://t.co/rZb3PjimBU" / X -
2026-2027 Super El Nino
GaWx replied to Stormchaserchuck1's topic in Weather Forecasting and Discussion
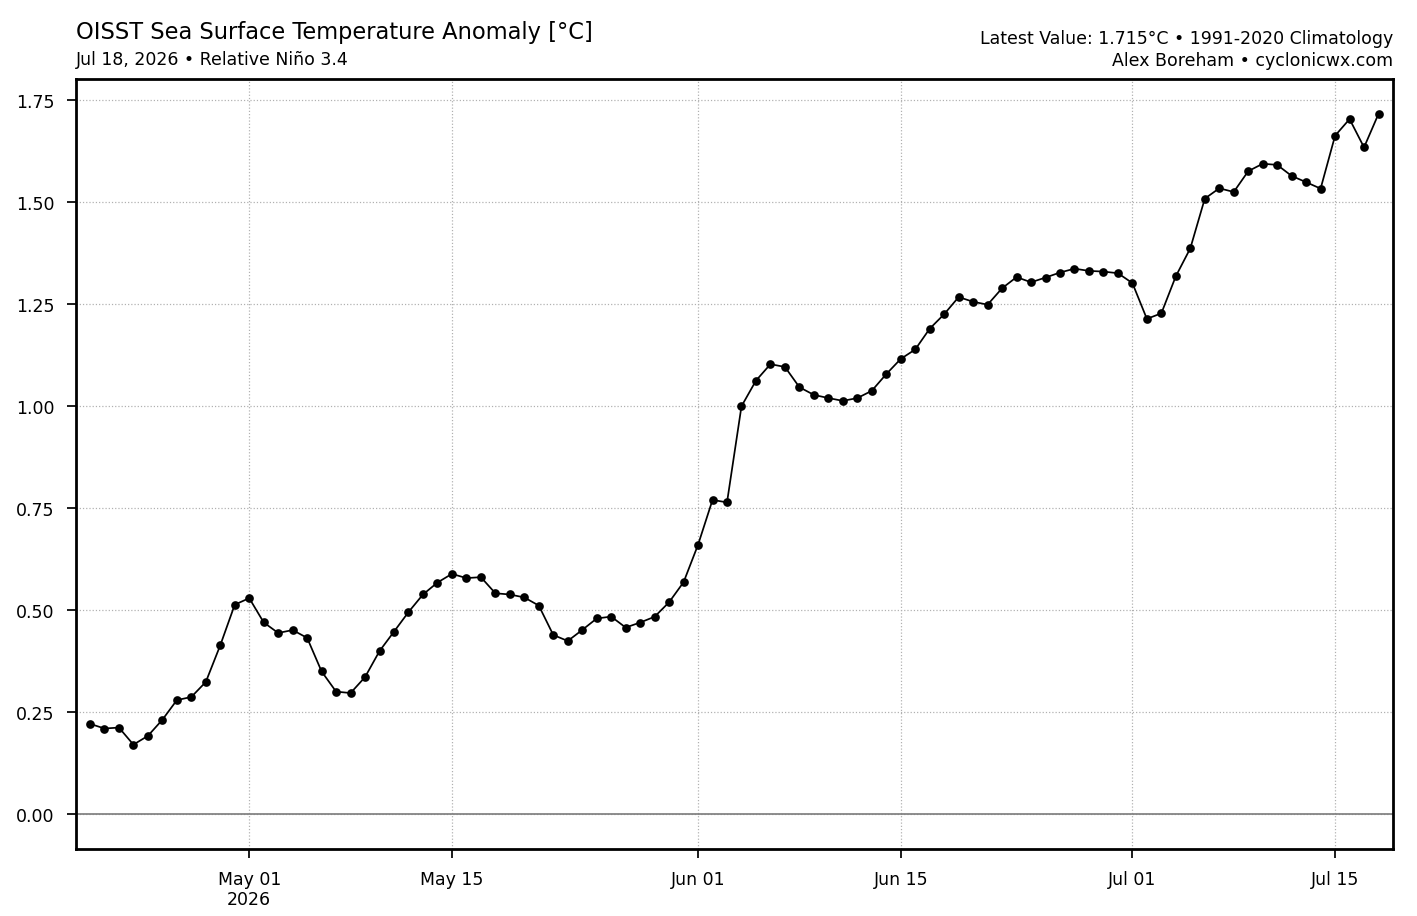
The weeklies keep coming in lower than my guesses as Nino 3.4 came in at only +1.4 for last week vs my +1.5 guess. This is surprisingly low when considering that it is OISST based. It is for the prior week averaged out, but still +1.4 looks low when comparing to this relative OISST graph. The avg of last week, the last 7 dots on the image below, is actually ~+1.6!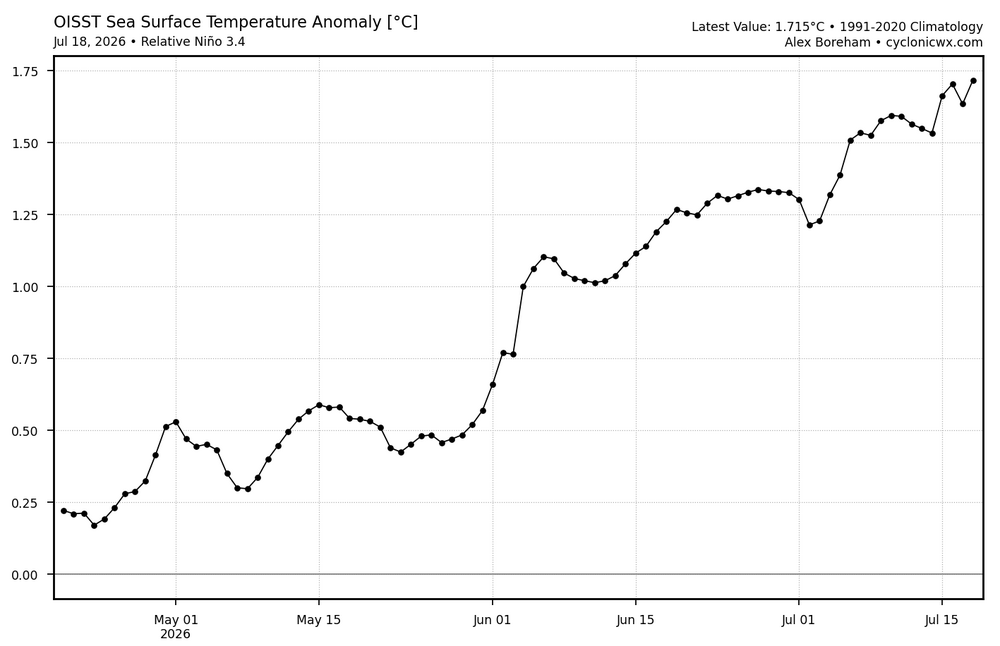
-
 There’s a reason why he could never keep a Met job lol
 -
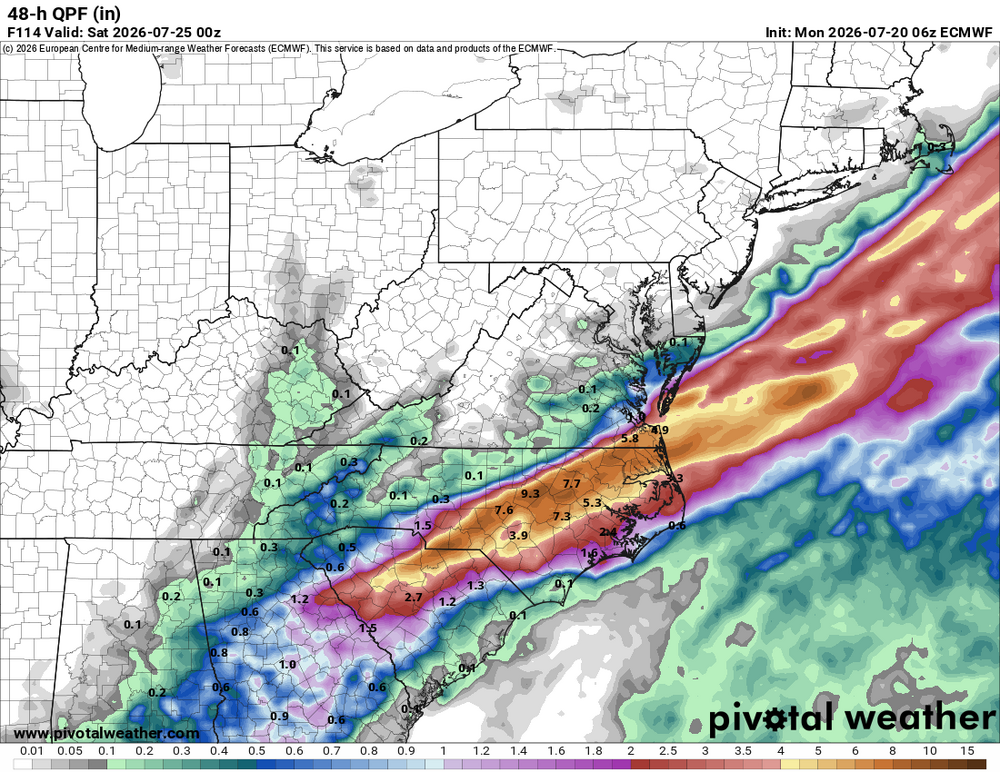
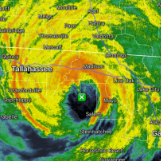
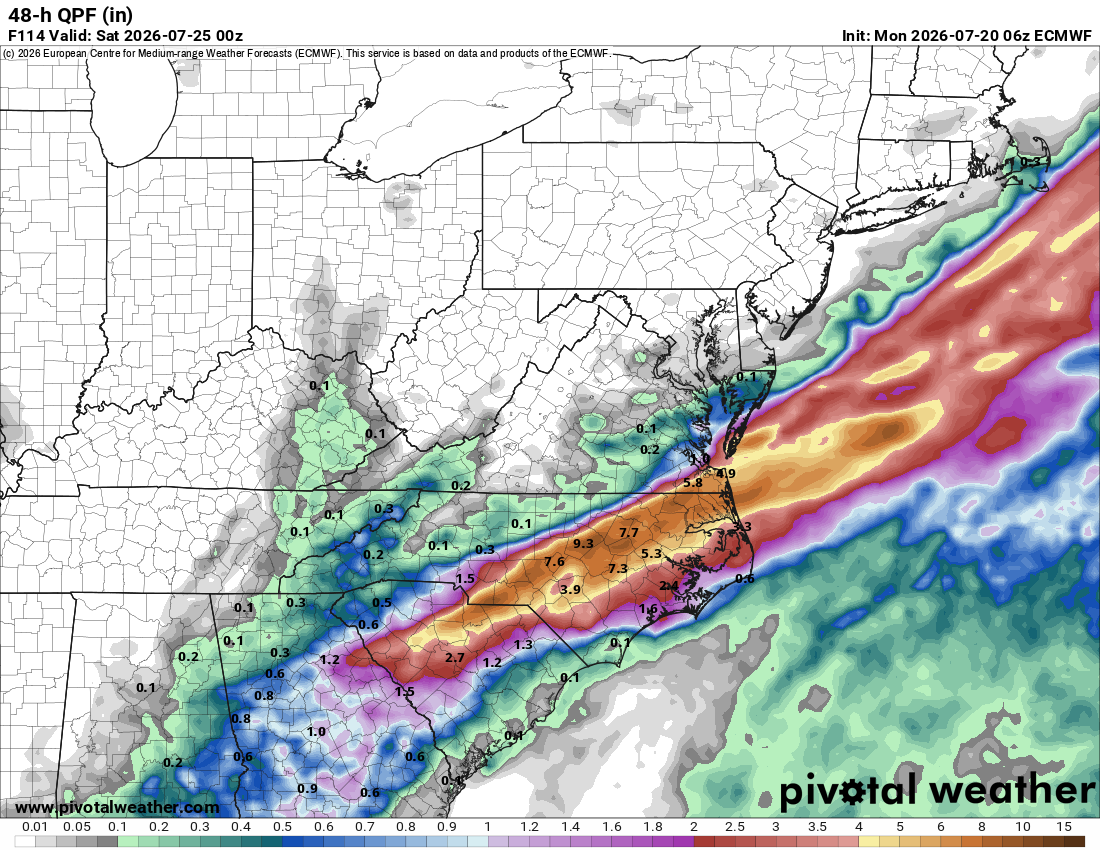
Tropical Depression Two Discussion Number 5 NWS National Hurricane Center Miami FL AL022026 1000 AM CDT Mon Jul 20 2026 Satellite imagery and surface observations indicate that the depression is becoming better organized, with the low-level circulation getting better defined and increased convective banding near the center. However, reports from an Air Force Reserve Hurricane Hunter aircraft and surface observations show that this has not yet resulted in strengthening. The maximum 925-mb flight-level winds reported by the aircraft so far is 34 kt, and the central pressure is near 1007 mb. Based on these data, the initial intensity remains 30 kt. The center of the depression seems to have reformed a little to the south during the past several hours. However, the overall motion is 310/3 kt. There is little change in the track forecast reasoning from the previous advisory. The tropical cyclone remains sandwiched between two mid-level ridges, one to its northwest centered over the Rockies and one to its southeast centered near the Bahamas. Over time, the ridge over the Rockies is expected to become the dominant steering feature as a longwave trough moves into the northeastern United States. This should result in the depression turning to the west-northwest and eventually west at a continued slow forward speed. The new forecast track brings the center near southeastern Louisiana in about 60 h and then reaches southeastern Texas by 120 h. The new forecast track is a little south of the previous track based partly on the current position and the possibility that the forecast northeasterly shear may help steer the center a little more southward. The depression is experiencing moderate northeasterly shear, and these conditions should continue for another 24-30 h. It is likely that there will be convective bursts near and south of the center during this time, and these should help intensify the cyclone to a tropical storm. After about 30 h, the northeasterly shear is forecast to increase, and the global models suggest it will get strong enough to destroy the vertical integrity of the cyclone. This should halt intensification and then cause some weakening. The new intensity forecast calls for a peak intensity of 45 kt in 36 to 48 h, and this is in the upper portion of the intensity guidance envelope. The forecast also calls for the system to survive through 120 h. However, it could dissipate between 72-120 h, especially if it tracks north of the current forecast and has more land interaction. It should be noted that the aforementioned shear is likely to give the cyclone a very asymmetric structure, with the bulk of the rainfall and much of the wind expected to occur to the south of the center. Key Messages: 1. The depression is expected to gradually strengthen and could bring tropical storm conditions to portions of the Gulf Coast from the Florida Panhandle westward to southeastern Louisiana beginning late tonight into Tuesday. 2. A Storm Surge Watch has been issued for the Alabama, Mississippi, and southeastern Louisiana coasts, where a life-threatening storm surge is possible. 3. Interests elsewhere in Louisiana and Texas should monitor the progress of this system, as additional watches could be required for portions of that area later today or Tuesday. 4. Areas of flash flooding will be possible through Friday along the Gulf Coast and adjacent inland locations from western Florida to the Middle Texas Coast, including southern portions of Alabama, Mississippi, and Louisiana. FORECAST POSITIONS AND MAX WINDS INIT 20/1500Z 28.5N 85.6W 30 KT 35 MPH 12H 21/0000Z 28.6N 86.0W 35 KT 40 MPH 24H 21/1200Z 28.9N 86.5W 40 KT 45 MPH 36H 22/0000Z 29.2N 87.2W 45 KT 50 MPH 48H 22/1200Z 29.4N 88.2W 45 KT 50 MPH 60H 23/0000Z 29.5N 89.5W 40 KT 45 MPH 72H 23/1200Z 29.5N 90.8W 35 KT 40 MPH...INLAND 96H 24/1200Z 29.4N 93.3W 30 KT 35 MPH...OVER WATER 120H 25/1200Z 29.3N 96.0W 25 KT 30 MPH...INLAND $$ Forecaster Beven
-
Had a low of 54. Refreshing
-
Yeah, the August average for the 2020s has been 10 days reaching 90°. We’ll have to see where the main ridge sets up and the what the wettest areas are. One of the warmest June 1st to July 16th periods along the East Coast. Monthly Number of Days Max Temperature >= 90 for NEWARK LIBERTY INTL AP, NJ Click column heading to sort ascending, click again to sort descending. Mean 1 2 8 15 10 2 0 35 2026 2 4 8 6 M M M 20 2025 0 0 10 20 8 1 0 39 2024 0 1 11 14 7 0 0 33 2023 2 1 1 14 5 6 0 29 2022 0 4 6 20 18 1 0 49 2021 0 4 12 11 13 1 0 41 2020 0 0 5 17 9 0 0 31
-
2026-2027 Super El Nino
GaWx replied to Stormchaserchuck1's topic in Weather Forecasting and Discussion
Thanks, Don. It’s very warm there, no doubt, indicative of a strong Nino. I prefer to compare the relative weeklies for the best apples to apples comparison to the strength of past events due to the GW effect on tropical oceans skewing the straight ENSO anomalies higher in more recent years: For the week centered on 7/15/26, the relative region 1+2 anomaly was at +2.8, a rise from the +2.6 of the prior week and the highest yet for this event. How does +2.8 compare to past events back to 1982 in mid July? 2023: +2.8 2015: +2.3 1997: +3.7 1982: +0.5 So, going back to 1982, 2026’s +2.8 is tied with 2023 for 2nd warmest anomaly in mid-July on a relative basis with 1997 being the warmest: https://www.cpc.ncep.noaa.gov/data/indices/rel_wksst9120.txt -
 Lots of low dew periods since May. That’s really what most care about.
 -