All Activity
- Past hour
-
was looking at vorticity rolling through/shear/instability...but mostly focusing on the shortwave rolling through as the driver for anything. If that shortwave is nothing or relatively weak then yeah we won't see much of anything
-
Ha. there are none. That's the point. Height are rising. what else are you looking at? SPC?
-
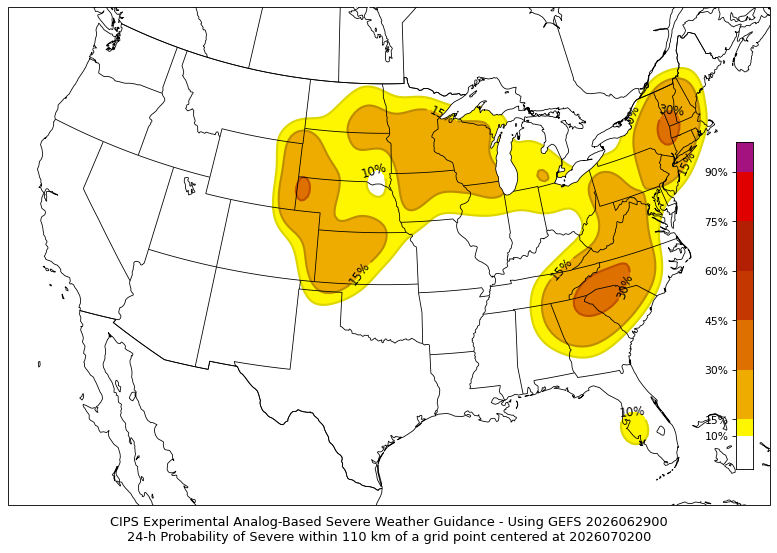
Actually I kind of like where that has the 30% area for D3. Looks like the instability gradient (talking about gradient between moderate and extreme instability) may be eastern NY into western New England. Something to watch because any development, particularly any cluster or complex, is going to ride that
-
Looks like the hottest days will occur as the ridge shifts into a position that will place our region in a westerly/downsloping flow. That should mean lowering dewpoints in the afternoon, which of course allows for more efficient heating. That's probably the rationale for rural areas (like my location) having forecast highs over 100. Typically the higher dewpoints inhibit that. Still don't buy 104 here.
-
Be honest, you triple checked one of the words in this post before you hit Submit, didn't you?
-
Not bad for a D3
-
Shwrs/stms have been developing regularly around the Lake this morning. Nice to see some decent rain.
-
If we hit 100, I will watch Superman IV. Twice.
-
June 29 1969: Worthington picks up over 6 inches of rain in 24 hours. 1930: Extreme heat develops in Minnesota. Canby got up to a sizzling 110 degrees. For Monday, June 29, 2026 1931 - The temperature at Monticello FL hit 109 degrees to establish an all-time record for the state. (The Weather Channel) 1954 - Hurricane Alice dumped as much as 27 inches of rain on the Lower Rio Grande Valley of Texas. The Rio Grande River at Laredo reached a level 12.6 feet above its previous highest mark, and the roadway of the U.S. 90 bridge was thirty feet below the high water. (David Ludlum) 1987 - Thunderstorms produced severe weather in the Ohio Valley and the Great Lakes Region, with reports of large hail and damaging winds most numerous in Ohio, Indiana and Michigan. Thunderstorms spawned four tornadoes in Michigan. A tornado near Clare MI was accompanied by softball size hail. In Colorado, an untimely winter-like storm blanketed Mount Evans with six inches of snow. (The National Weather Summary) (Storm Data) 1988 - Alpena, MI, reported a record low of 39 degrees while Jackson, MS, equalled their record for the month of June with an afternoon high of 105 degrees. Thunderstorms in the central U.S. soaked Springfield MO with 3.62 inches of rain, a record for the date. (The National Weather Summary) 1989 - Thunderstorms produced severe weather in the Southern and Central High Plains Region. Thunderstorms in Colorado produced softball size hail at Kit Carson, while pea to marble size hail caused ten million dollars damage to crops in Philips County, CO. (The National Weather Summary) (Storm Data) Observances: 29 Mon National Camera Day 29 Mon Hug Holiday 29 Mon Please Take My Children To Work Day 29 Mon International Mud Day 29 Mon Feast Day of Saints Peter and Paul 29 Mon International Day of the Tropics 29 Mon National Bacon Burnt End Day 29 Mon National Dieselbilly Day 29 Mon National Guy Day 29 Mon National Waffle Iron Day 29 Mon Outdoor Equipment Maintenance Day 29 Mon San Francisco's Birthday 29 Mon The Feast of Saints Peter and Paul 29 Mon Internal Autonomy Day 29 Mon International Fisherman Day 29 Mon St Peter's Day 29 Mon National Almond Buttercrunch Day
-

2026-2027 Super El Nino
GaWx replied to Stormchaserchuck1's topic in Weather Forecasting and Discussion
This is again indicative of a not nearly as E based El Niño as 1997-8 with the slope from E to W not nearly as steep. -

Central PA Summer 2026 Discussion/Obs Thread
canderson replied to Voyager's topic in Upstate New York/Pennsylvania
HBG has a legit shot to have 4 100 degree days in a row. That would obliterate so many records. -

2026-2027 Super El Nino
LakePaste25 replied to Stormchaserchuck1's topic in Weather Forecasting and Discussion
maybe let’s get through this season before talking about *next year’s* La Niña again? i’m hardly ready to even talk about this coming winter yet although that is tough to avoid because it’s talked about daily here -

Central PA Summer 2026 Discussion/Obs Thread
Mount Joy Snowman replied to Voyager's topic in Upstate New York/Pennsylvania
Low of 65. Looks like I'll finish June with 1.46" of rain, not as bad as I thought but still not good. I'm getting one last mow in today and then things turn crunchy for a while. -
Stacking hay this weekend and cleaning horse stalls.
-
We give the people what they want. Machine learning stuff basically has a chance every day through the 4th weekend.
-
True, height falls are relatively meager. Certainly one of the negatives to consider
-

2026-2027 Super El Nino
bluewave replied to Stormchaserchuck1's topic in Weather Forecasting and Discussion
Based on how consistent the CFS has been, expect the Euro to increase to the +3.5 to +4 traditional ONI range also on its release coming for July 5th. This makes sense given the all -time record SST warmth we are currently experiencing so early on. Continuing WWBs will allow this event to keep intensifying at a record rate. The forecasts will be more accurate as get further past the spring predictability barrier. -
Nah, Wed is a big time +d(hgt) day. That's gonna drop a ton of bricks on any vertical attempt. That day's likely to be that kind of blue sky that sounds like arcing electricity.
-
We’re about due for our annual one nighttime thunderstorm per year
-
Heatwave for me is temps 90+. Will be in the upper 80's Tues-Thurs then back to avg. Higher dews will make it rather muggy, and heat advs/warns will be out for higher indexes.
-

2026-2027 Super El Nino
PhiEaglesfan712 replied to Stormchaserchuck1's topic in Weather Forecasting and Discussion
If true, 2027-28 is going to challenge 1973-74 and 1988-89 for the strongest la nina. Both of those followed robust el ninos, and broke relatively long (over a decade) strong la nina droughts. Remember, we haven't had a strong la nina since 2010-11. Strong La Nina: 1955-56, 1973-74, 1975-76, 1988-89, 1998-99, 1999-00, 2007-08, 2010-11, (2027-28) -
Looks like right along the theta-e axis. What happens tomorrow night could end up setting the stage for Wednesday too, particularly when it comes to any potential remnant outflow boundaries. We'll have to see how things time with shortwave energy and even shortwave strength but Wednesday has potential to be a higher-end severe day I think
-
Euro seems to have scaled back the heat a bit. 102 on Friday for a peak
-
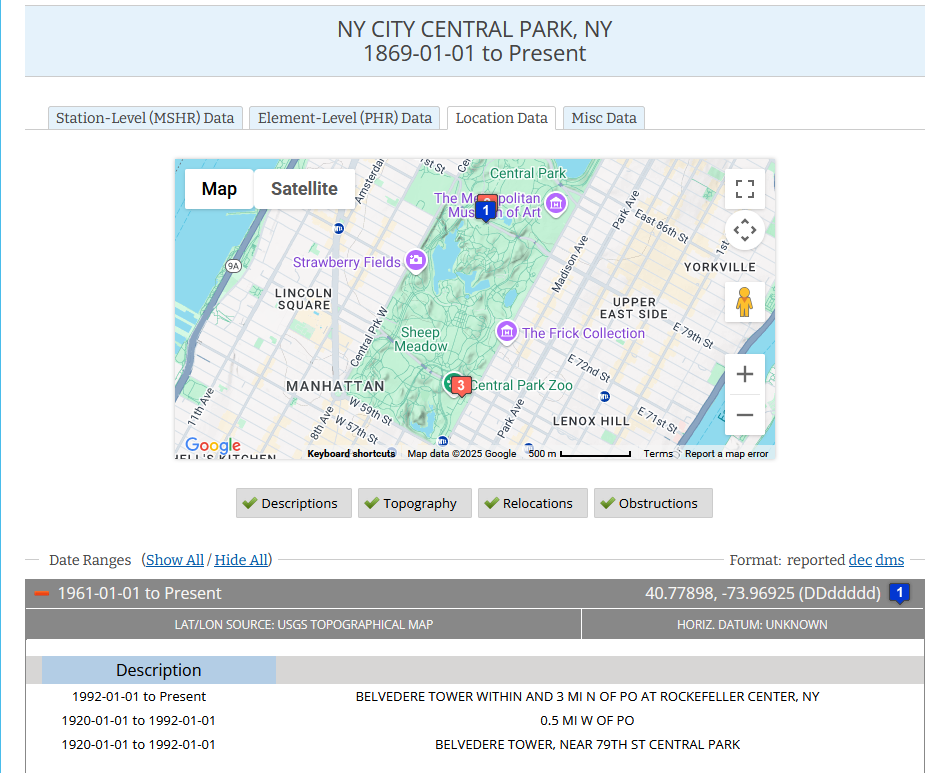
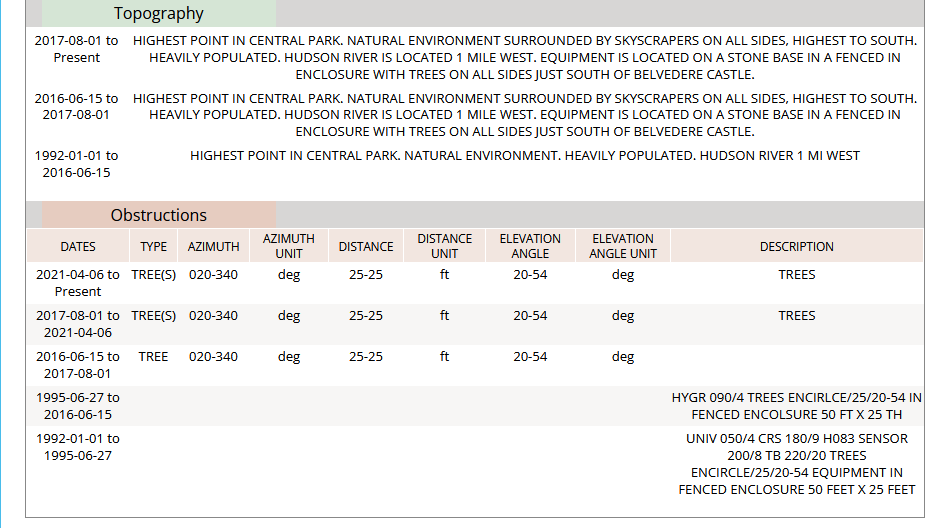
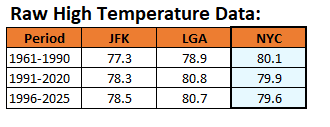
As an extreme air mass is poised to set temperature records across the New York City Metro Area during July 1-3, it is again worth noting that the strong cooling effect of Central Park's overgrowth of trees will make it exceedingly difficult for Central Park to reach 100°. It is likely that JFK Airport, LaGuardia Airport, Newark, and possibly Bridgeport, Islip, and White Plains could all reach 100°. Last June, the New York City area experienced its highest June monthly temperatures on record. JFK Airport topped out at 102° (old record: 99°, 1952, 1959, and 1964). LaGuardia Airport reached 101°, tying the mark set in 1952 and tied in 2017). Newark reached 103° (tying the record set in 2021). Bridgeport reached 97° (tying the record set in 2008). Islip topped out at 101° (demolishing the old mark of 96° from 1966 and 1994). White Plains reached 98° (tying the record set in 1952 and tied in 1953). A shaded Central Park reached just 99°. Based on a statistical regression equation (coefficient of determination: 0.941), for the 30-year period preceding the excessive tree growth (1966-1995), Central Park actually hit 100° on two days. Its peak temperature would have been 102° on June 24th, also setting a new monthly record (old record: 101°, 1934 and 1966). For good reason, homogenization is applied to long-term records to account for changes such as the tree growth that has been permitted to dampen Central Park's summer high temperatures. IMO, homogenization should be applied on a daily basis, given the persistent lack of interest in addressing the documented problem (as noted on NOAA's climate site inventory). How has tree growth affected Central Park? Even as average high temperatures during June have increased at JFK Airport and LaGuardia Airport during 1961-1990 to 1991-2020, they have decreased at Central Park. June Mean High Temperatures: Through June 28th, Central Park's mean June temperature is running 0.5° below that of JFK Airport, even as JFK is affected by the sea breeze. Only 2015 (0.03° margin) had a warmer mean June high at JFK airport. To date, Central Park's highest monthly temperature is 91°. Here's how it compares with the other sites in the New York City area: Bridgeport: 91°; Islip: 94°; JFK Airport: 96°; LaGuardia Airport: 98°; Newark: 97°; and, White Plains: 92°. Based on the statistical assessment, Central Park's monthly high is likely 97° (June 11-12). In terms of 90° or above days, Central Park stands at 2 days in June. Here's how that compares with the other sites in the New York City area: Bridgeport: 1 day; Islip: 2 days; JFK Airport: 2 days; LaGuardia Airport: 6 days; Newark: 7 days; and, White Plains: 2 days. The statistical estimate suggests 4-6 days are likely to have occurred this month.

-
Not impossible... Friday's more susceptible. Objective guidance has a slow leak in the ridge bubble, hissing as the flow pancakes going into Saturday; altho staying above normal overall. That goes from ridge suppression curvature, to more of a zonal W-E flow structure. No real cold fronts there... so heat languishes into the weekend, ** unless** the SW to WSW flow of 70+ DP plumes running up underneath, makes for statically more unstable environment from the IA all the way across and most importantly ... if it gets triggered. If the heat doesn't break from something like that, it may be a slow rot exit. Some machine guidance by the way still taps 90 on Sunday even though the ridge is remnant by then.