All Activity
- Past hour
-
88/76 heat index at 99
-

July 2025 Obs/Disco ... possible historic month for heat
CoastalWx replied to Typhoon Tip's topic in New England
2.3 is solid though….you aren’t getting +6 here in July. Furthermore the dews have likely helped from not getting to the upper 90s. So maybe high temps aren’t insane, but the heat index sure as hell is hot. -

July 2025 Obs/Disco ... possible historic month for heat
powderfreak replied to Typhoon Tip's topic in New England
Yeah, it's a very set 10-year adjustment. Maybe on some other page or stats they have some rolling average on their own? -

July 2025 Obs/Disco ... possible historic month for heat
ineedsnow replied to Typhoon Tip's topic in New England
I just hope we can manage to get a big cane this year -
July 2025 Obs/Disco ... possible historic month for heat
TheClimateChanger replied to Typhoon Tip's topic in New England
I'm saying the normal was raised by that amount above and beyond what the mean of the 30-year average was observed to be. Not that the normal was increased by that amount relative to 1981-2010. It increased by the amount of the observed increase, plus an extra degree or two at those locations. Other stations also had smaller extra bumps. I don't think this was done elsewhere. Generally, the normals line up with the calculated mean. -

July 2025 Obs/Disco ... possible historic month for heat
WxWatcher007 replied to Typhoon Tip's topic in New England
Maybe, but we have to play the delicate balance every year of ECONUS troughing and Atlantic ridging. -

July 2025 Obs/Disco ... possible historic month for heat
ineedsnow replied to Typhoon Tip's topic in New England
ya I agree with that.. I would be miserable without it -

July 2025 Obs/Disco ... possible historic month for heat
CoastalWx replied to Typhoon Tip's topic in New England
Yeah they don’t just go in and decide to change the norms. -

July 2025 Obs/Disco ... possible historic month for heat
powderfreak replied to Typhoon Tip's topic in New England
The lows matter greatly for folks without A/C or the ability to cool off at night. Sure, tucked into bed with the A/C humming you don't notice it... but then again sitting inside with A/C you won't notice 96F either, ha. I still know some people up here who do not have A/C and it has been brutal. Each year more and more schedule mini-split installations because of it. -

July 2025 Discussion-OBS - seasonable summer variability
bluewave replied to wdrag's topic in New York City Metro
Yeah, this is why we have been observing such a steep increase in extreme rainfall and flooding in recent years. https://pmc.ncbi.nlm.nih.gov/articles/PMC10083550/#:~:text=Meteorologists use the Clausius–Clapeyron,a 1 °C rise. The equation shows how warmer air can hold more moisture, which is crucial to forecast the increased strength of storms and the higher intensity of rainfall. “A key point about this equation is that it has an exponential in there,” says Peter Stott, a climate scientist at the UK Met Office. “An exponential curve, of course, goes up more steeply the further up you get. So quite quickly as temperature increases, you get into large numbers for additional rainfall.” So, the equation points at a wetter future. But as researchers are learning, that’s only the beginning. Future storms may produce even more rain than the venerable equation predicts. -
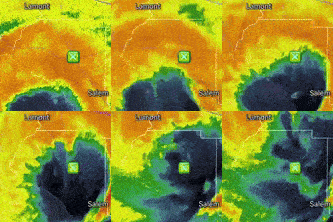
Is there some circulation offshore? All the cells seem to be moving in a circular motion.
-

July 2025 Discussion-OBS - seasonable summer variability
uofmiami replied to wdrag's topic in New York City Metro
That's a good joke, haha. NYC's UHI took over the NE. The anomalies on the lows in the NE are off the chart though, makes for a very hot summer, as we are experiencing. I think Bluewave posted the map where most of the NE is having a top 5 warmest July, which isn't a surprise with lows being so warm overall to normal. It's really a continuation of the high DP pattern we've been having ever summer now. -
July 2025 Obs/Disco ... possible historic month for heat
SJonesWX replied to Typhoon Tip's topic in New England
you can have my 92. Please, please take it -
NW Branch up near Kemp Mill - I use this site to monitor - https://waterdata.usgs.gov/monitoring-location/USGS-01650500/#period=P7D&showMedian=true&dataTypeId=continuous-00065-0
- 1,289 replies
-
- severe
- thunderstorms
-
(and 2 more)
Tagged with:
-

July 2025 Discussion-OBS - seasonable summer variability
steve392 replied to wdrag's topic in New York City Metro
Ohhh and it's absolutely disgusting out there. -

July 2025 Discussion-OBS - seasonable summer variability
steve392 replied to wdrag's topic in New York City Metro
My tomatoes just won't grow this year. Got actual tomatoes but the plant just won't grow. Peppers are very slow. My zucchini, pumpkin, cantaloupe and sweet potatoes are exploding. My corn is rebounding after squirrel damaged 5 stalks. -

July 2025 Obs/Disco ... possible historic month for heat
HoarfrostHubb replied to Typhoon Tip's topic in New England
88F here. High so far. A 90 would be appreciated -

July 2025 Obs/Disco ... possible historic month for heat
Torch Tiger replied to Typhoon Tip's topic in New England
-

July 2025 Obs/Disco ... possible historic month for heat
powderfreak replied to Typhoon Tip's topic in New England
I know but do you know what the actual normal value should be? Maybe it is 1.0 and 1.9F? I'm just trying to figure out how you know they are playing "loose and fast" with the normals. Those sound like very possible amounts for mean temp increases in a decade. -

2025 Atlantic Hurricane Season
BarryStantonGBP replied to BarryStantonGBP's topic in Tropical Headquarters
quote from SaintCategory5Kaiju regarding Andy hazleton -
Already a storm popping east of Mount Joy.
-

Central PA Summer 2025
Mount Joy Snowman replied to Voyager's topic in Upstate New York/Pennsylvania
Everything I've looked at seems to be pointing towards a later in the evening type event, like possibly even well after sunset. -

July 2025 Obs/Disco ... possible historic month for heat
Torch Tiger replied to Typhoon Tip's topic in New England
lol -

July 2025 Discussion-OBS - seasonable summer variability
Sundog replied to wdrag's topic in New York City Metro
I was going to joke how NYC's urban heat island has expanded to a third the size of the United States because only concrete apparently is responsible for elevated lows (nevermind the fact that UHI has been baked into the averages for decades) but your post is very informative so I didn't want to reduce it down to a joke. Just give me lower dewpoint temps PLEASE, I'll take mid 90s until the end of August if I can just keep dews under 55. -
There is a paper that now explains the synoptic events that drove the record heat, including Phoenix's record 31 consecutive days of 110° or above heat, in the Southwest (U.S. and Mexico) during 2023. In short, the combination of an abnormally warm Atlantic Ocean (dominant factor) and rising El Niño created a semi-permanent heat ridge. The paper explained: It was found that a large-scale, semi-persistent atmospheric blocking pattern was anchored over the region for most of the summer, a feature that enhanced incoming solar radiation, thermal heating, and sensible heating, deep subsidence, while reducing precipitation, thus increasing surface temperatures. The atypical features of this extreme event suggested that there were slow-varying large-scale forcings at play, potentially promoting its occurrence. It was shown that the homogeneous interbasin warm SSTs from the record warm Atlantic Ocean and a growing El Niño event in the Pacific modulated large-scale atmospheric circulation. These circulation changes thus promoted a semi-permanent anticyclonic blocking pattern, significantly increasing surface heating, which led to the growth and persistence of the heatwave. The paper can be found here: https://www.nature.com/articles/s41467-025-61859-y


