All Activity
- Past hour
-
Expectations are so low this season that I predict the only posts that will take place in the banter/complaint thread this winter will be Brian's daily almanacs.
-
I mean it’s November 12th
-
2026-2027 Record-breaking El Nino
EasternLI replied to Stormchaserchuck1's topic in Weather Forecasting and Discussion
~50% of the 12z eps with reversals at 10mb today. Increased % on the 12z GEFS today too from ~25% yesterday. Really curious how this all ends up. It doesn't automatically mean cold for anyone if that happens. Never does. It could mean torch... These things are never cut and dry. Just watching for now... -
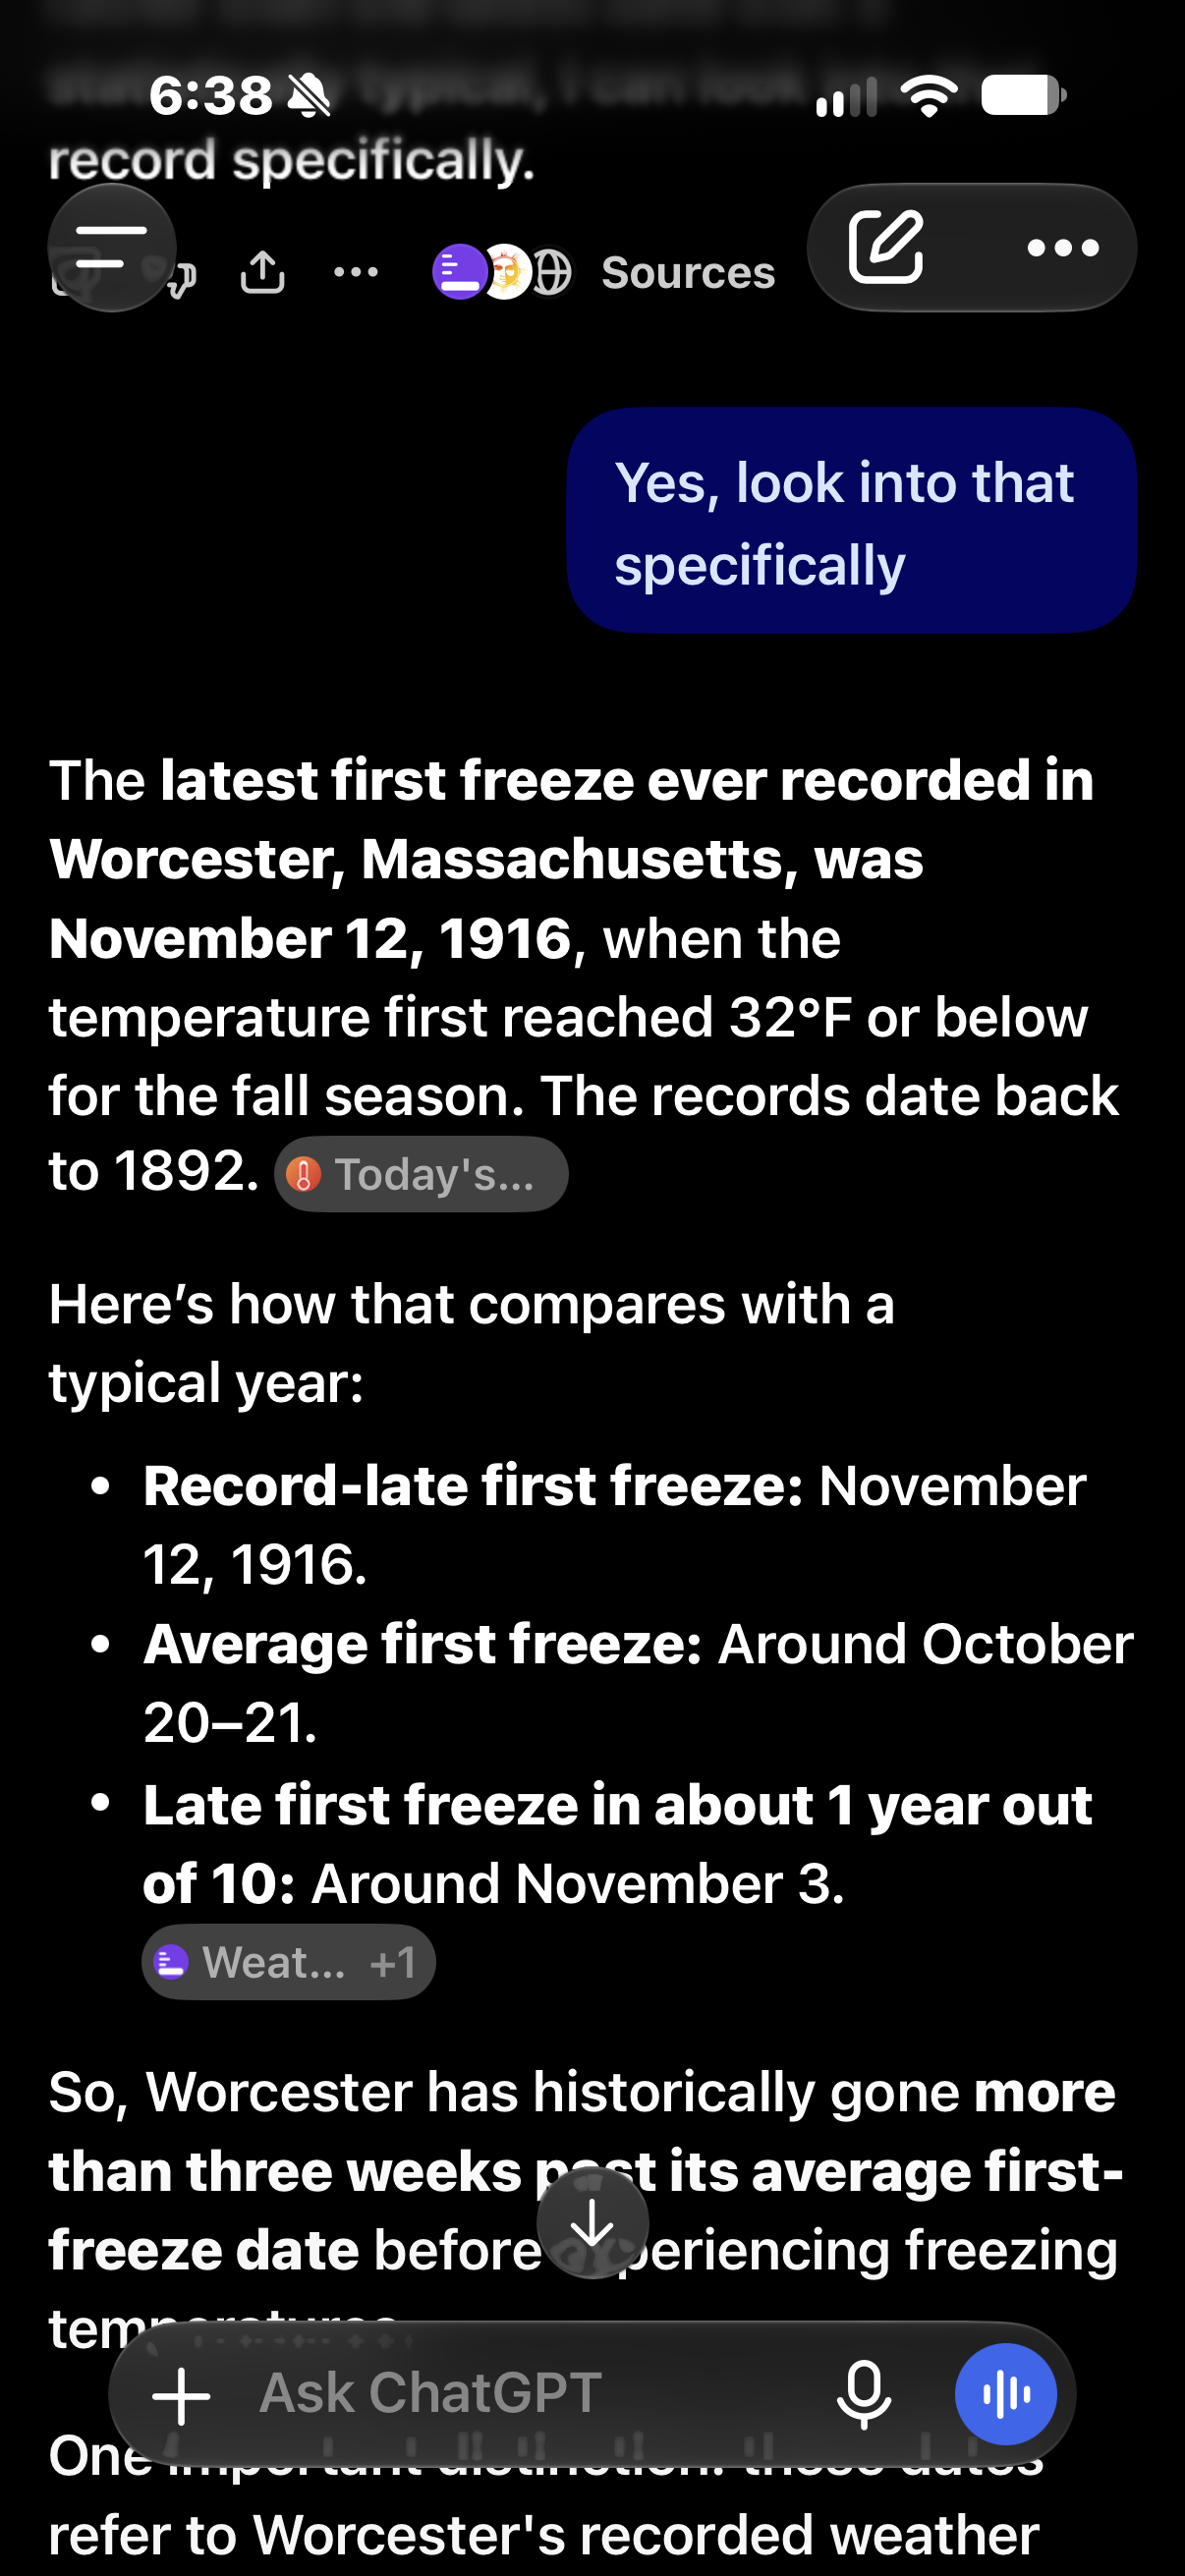
the metric for "very likely" is 90%; what is the "smashed" metric? is that one week ? are you forecasting a first temp of 32F or lower for Worcester on or after November 19 ?
-

Yellow Medicine County, MN - Climate Fact or Climate Fiction?
ChescoWx replied to Cobalt's topic in Climate Change
I have emailed them not to dispute at all - just to ask for the detailed data. They were only able to share to me about 1/3 of the support for the data. If you can help me fill in the other 66% please reach out to your sources. You may have just missed it but I am launching a new detailed study of all 48 contiguous US States and will welcome the data to close the gaps on these estimated data adjustments made to the raw data to bring them to 100% support! thanks Cobalt!! -

2026-2027 Record-breaking El Nino
michsnowfreak replied to Stormchaserchuck1's topic in Weather Forecasting and Discussion
No one, literally no one, is NOT saying winter will be warmer than normal. However, it diverges after that with some of the clown "predictions" we have seen. Take an outrageously anamolous month like Dec 2015 then extrapolate a "decade of warming" on top of it . The funny thing is, if you use a regression line for the past decade of winters here, they have COOLED 1.9°. Of course, a mild '16-17 & cold '25-26 play big into that, but using a regression line from point A to point B is literally THE favorite tool of a certain group (with point A always being 1970). -
 best pharmacy in india: ZenithIndus Rx - buy medicine online in india
-
It’s about time someone started this! Now I can stop trolling other forums for my fix. It’s kind of a relief to start with such low expectations—things can only go up from here!
-

2026-2027 Record-breaking El Nino
mitchnick replied to Stormchaserchuck1's topic in Weather Forecasting and Discussion
Today’s 10mb Euro weeklies prog. If you scroll forward using the R arrow, it brings the dome of warmth over the Pole into our side before dissapating. https://charts.ecmwf.int/products/extended-anomaly-10t?base_time=202610260000&projection=opencharts_north_pole&valid_time=202611020000 -

Yellow Medicine County, MN - Climate Fact or Climate Fiction?
Cobalt replied to Cobalt's topic in Climate Change
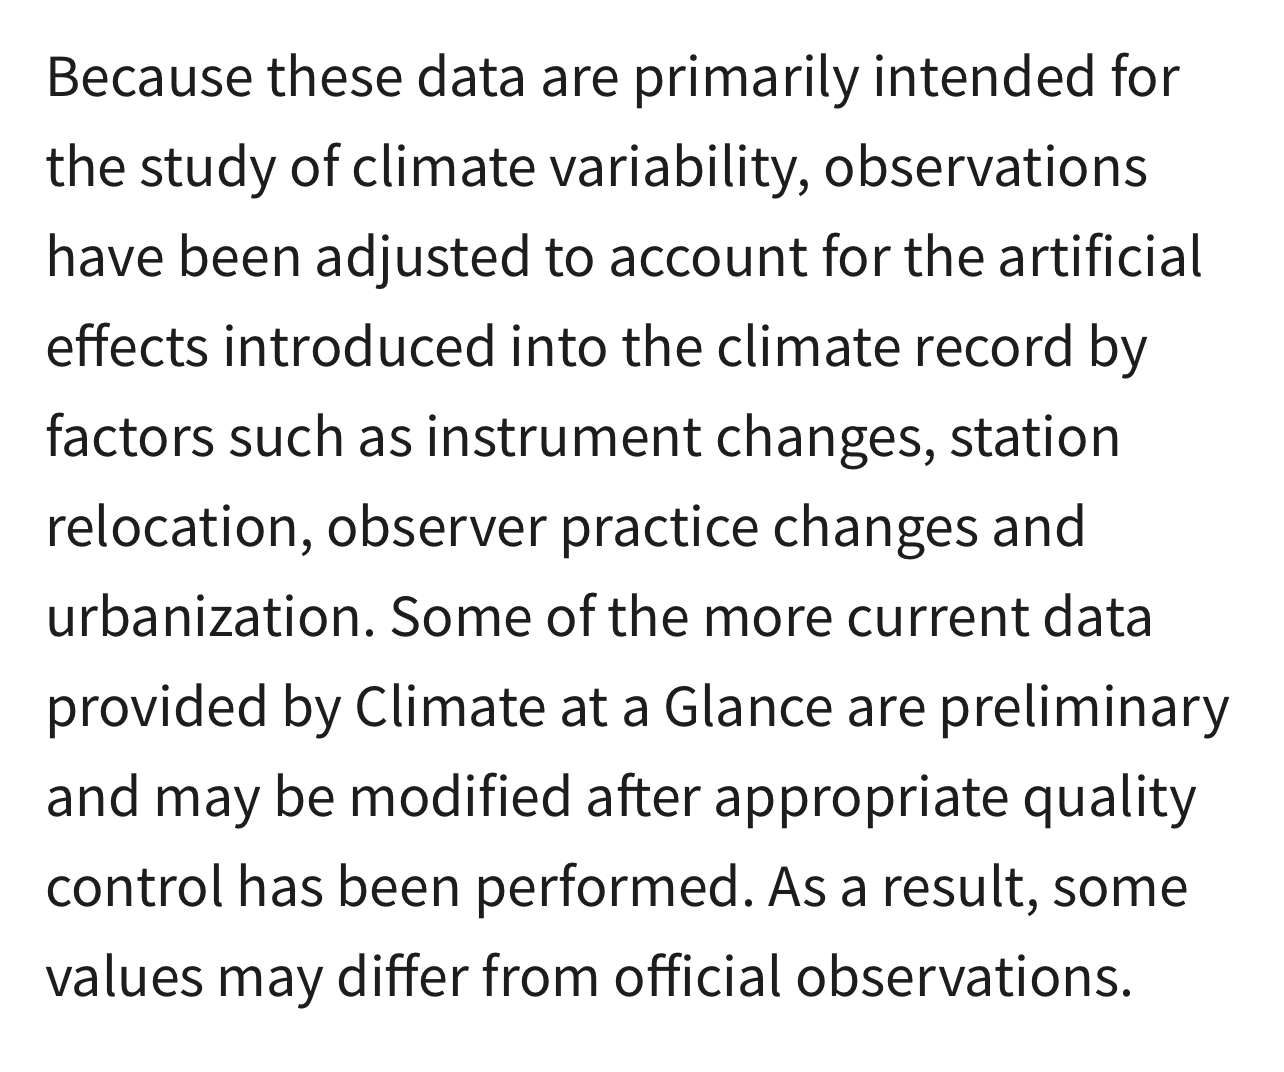
Yes, which there is no problem with, as per the methodology they've shared here. The rationale and its output is scientifically sound. I suggest you email them to dispute their methodology if you have a problem with it.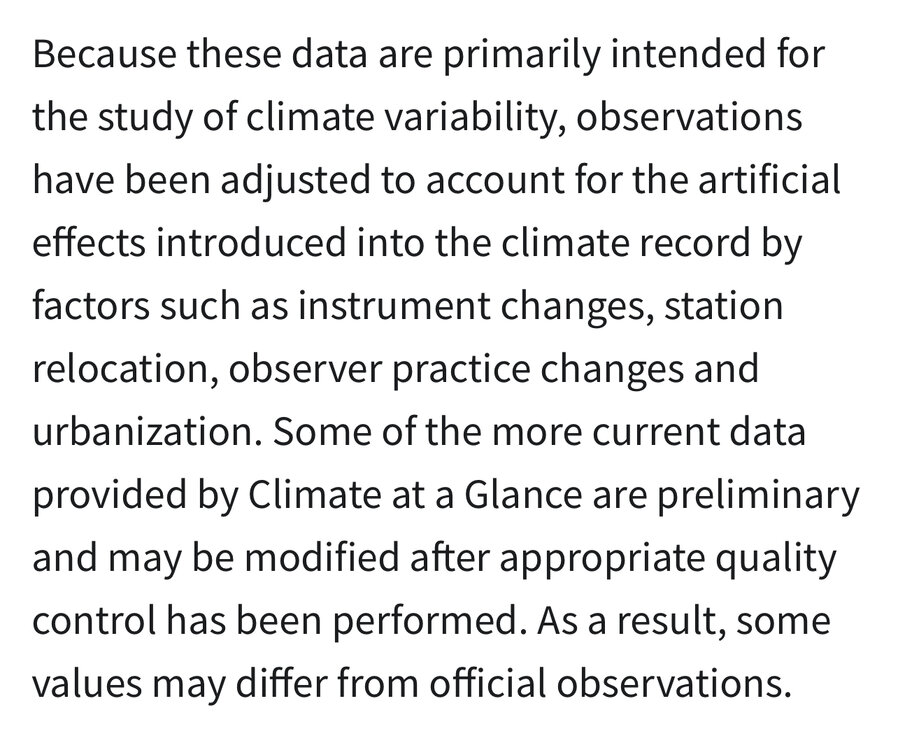
-
Yellow Medicine County, MN - Climate Fact or Climate Fiction?
ChescoWx replied to Cobalt's topic in Climate Change
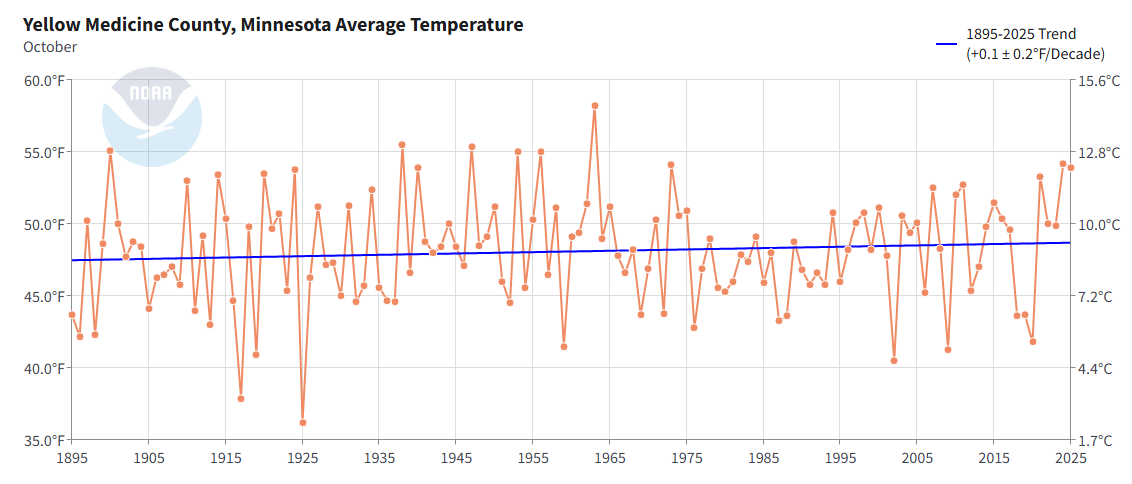
That is estimated NCEI adjusted data....even that data looks incredibly not alarming!! Even you can see that warming is minor at best and nothing at all to be concerned with correct?? Do you honestly look at that and tell me we have any issue there in that great Yellow Medicine county worth worrying about?? -
Yellow Medicine County, MN - Climate Fact or Climate Fiction?
Cobalt replied to Cobalt's topic in Climate Change
As we await the results of October's data for Yellow Medicine County, MN, here is a look at the prevailing trend for the county (population: 10,502) October is the month with the 10th highest (3rd least prevalent) warming trend in the calendar year, behind August and April.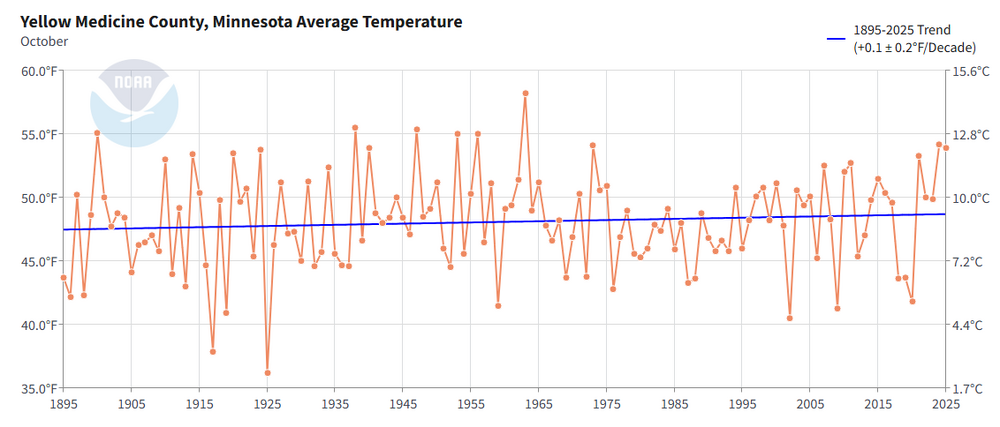
-
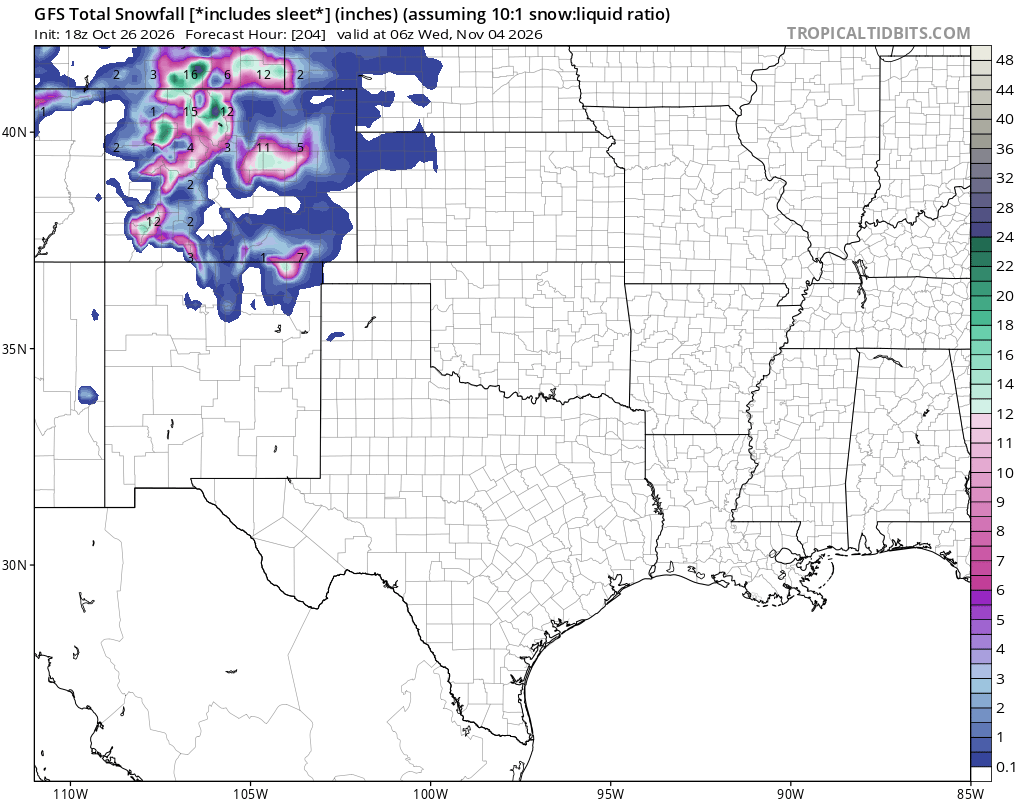
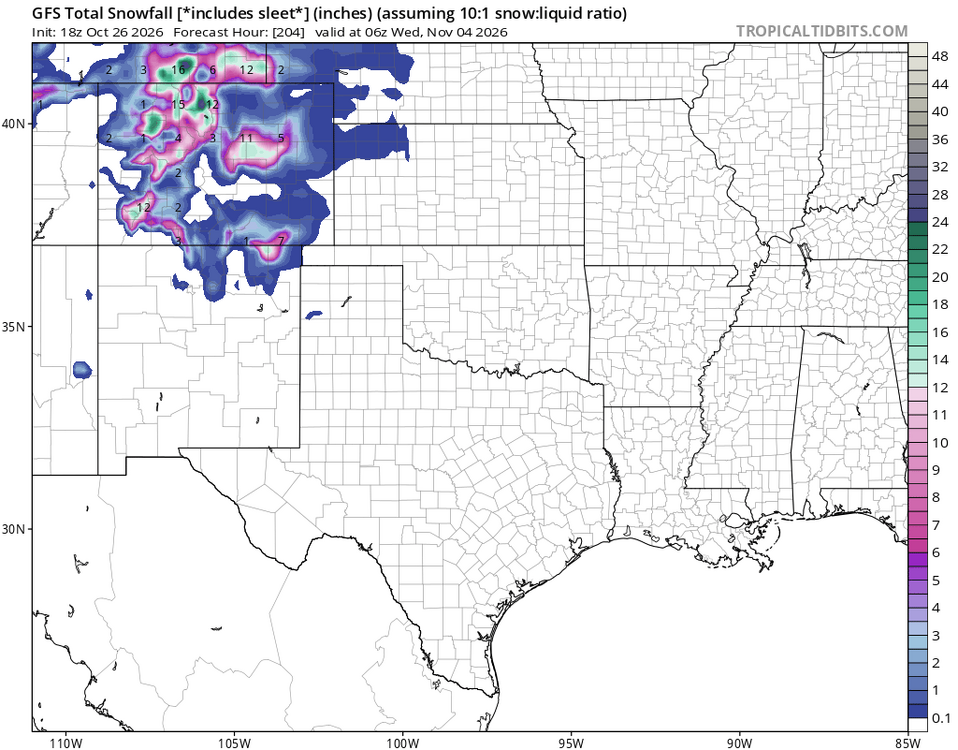
GFS now has snow. Big storm around Castle Rock, light to moderate event closer to Denver. Definitely something to watch.
-
Shame we don’t live at 10mb
-
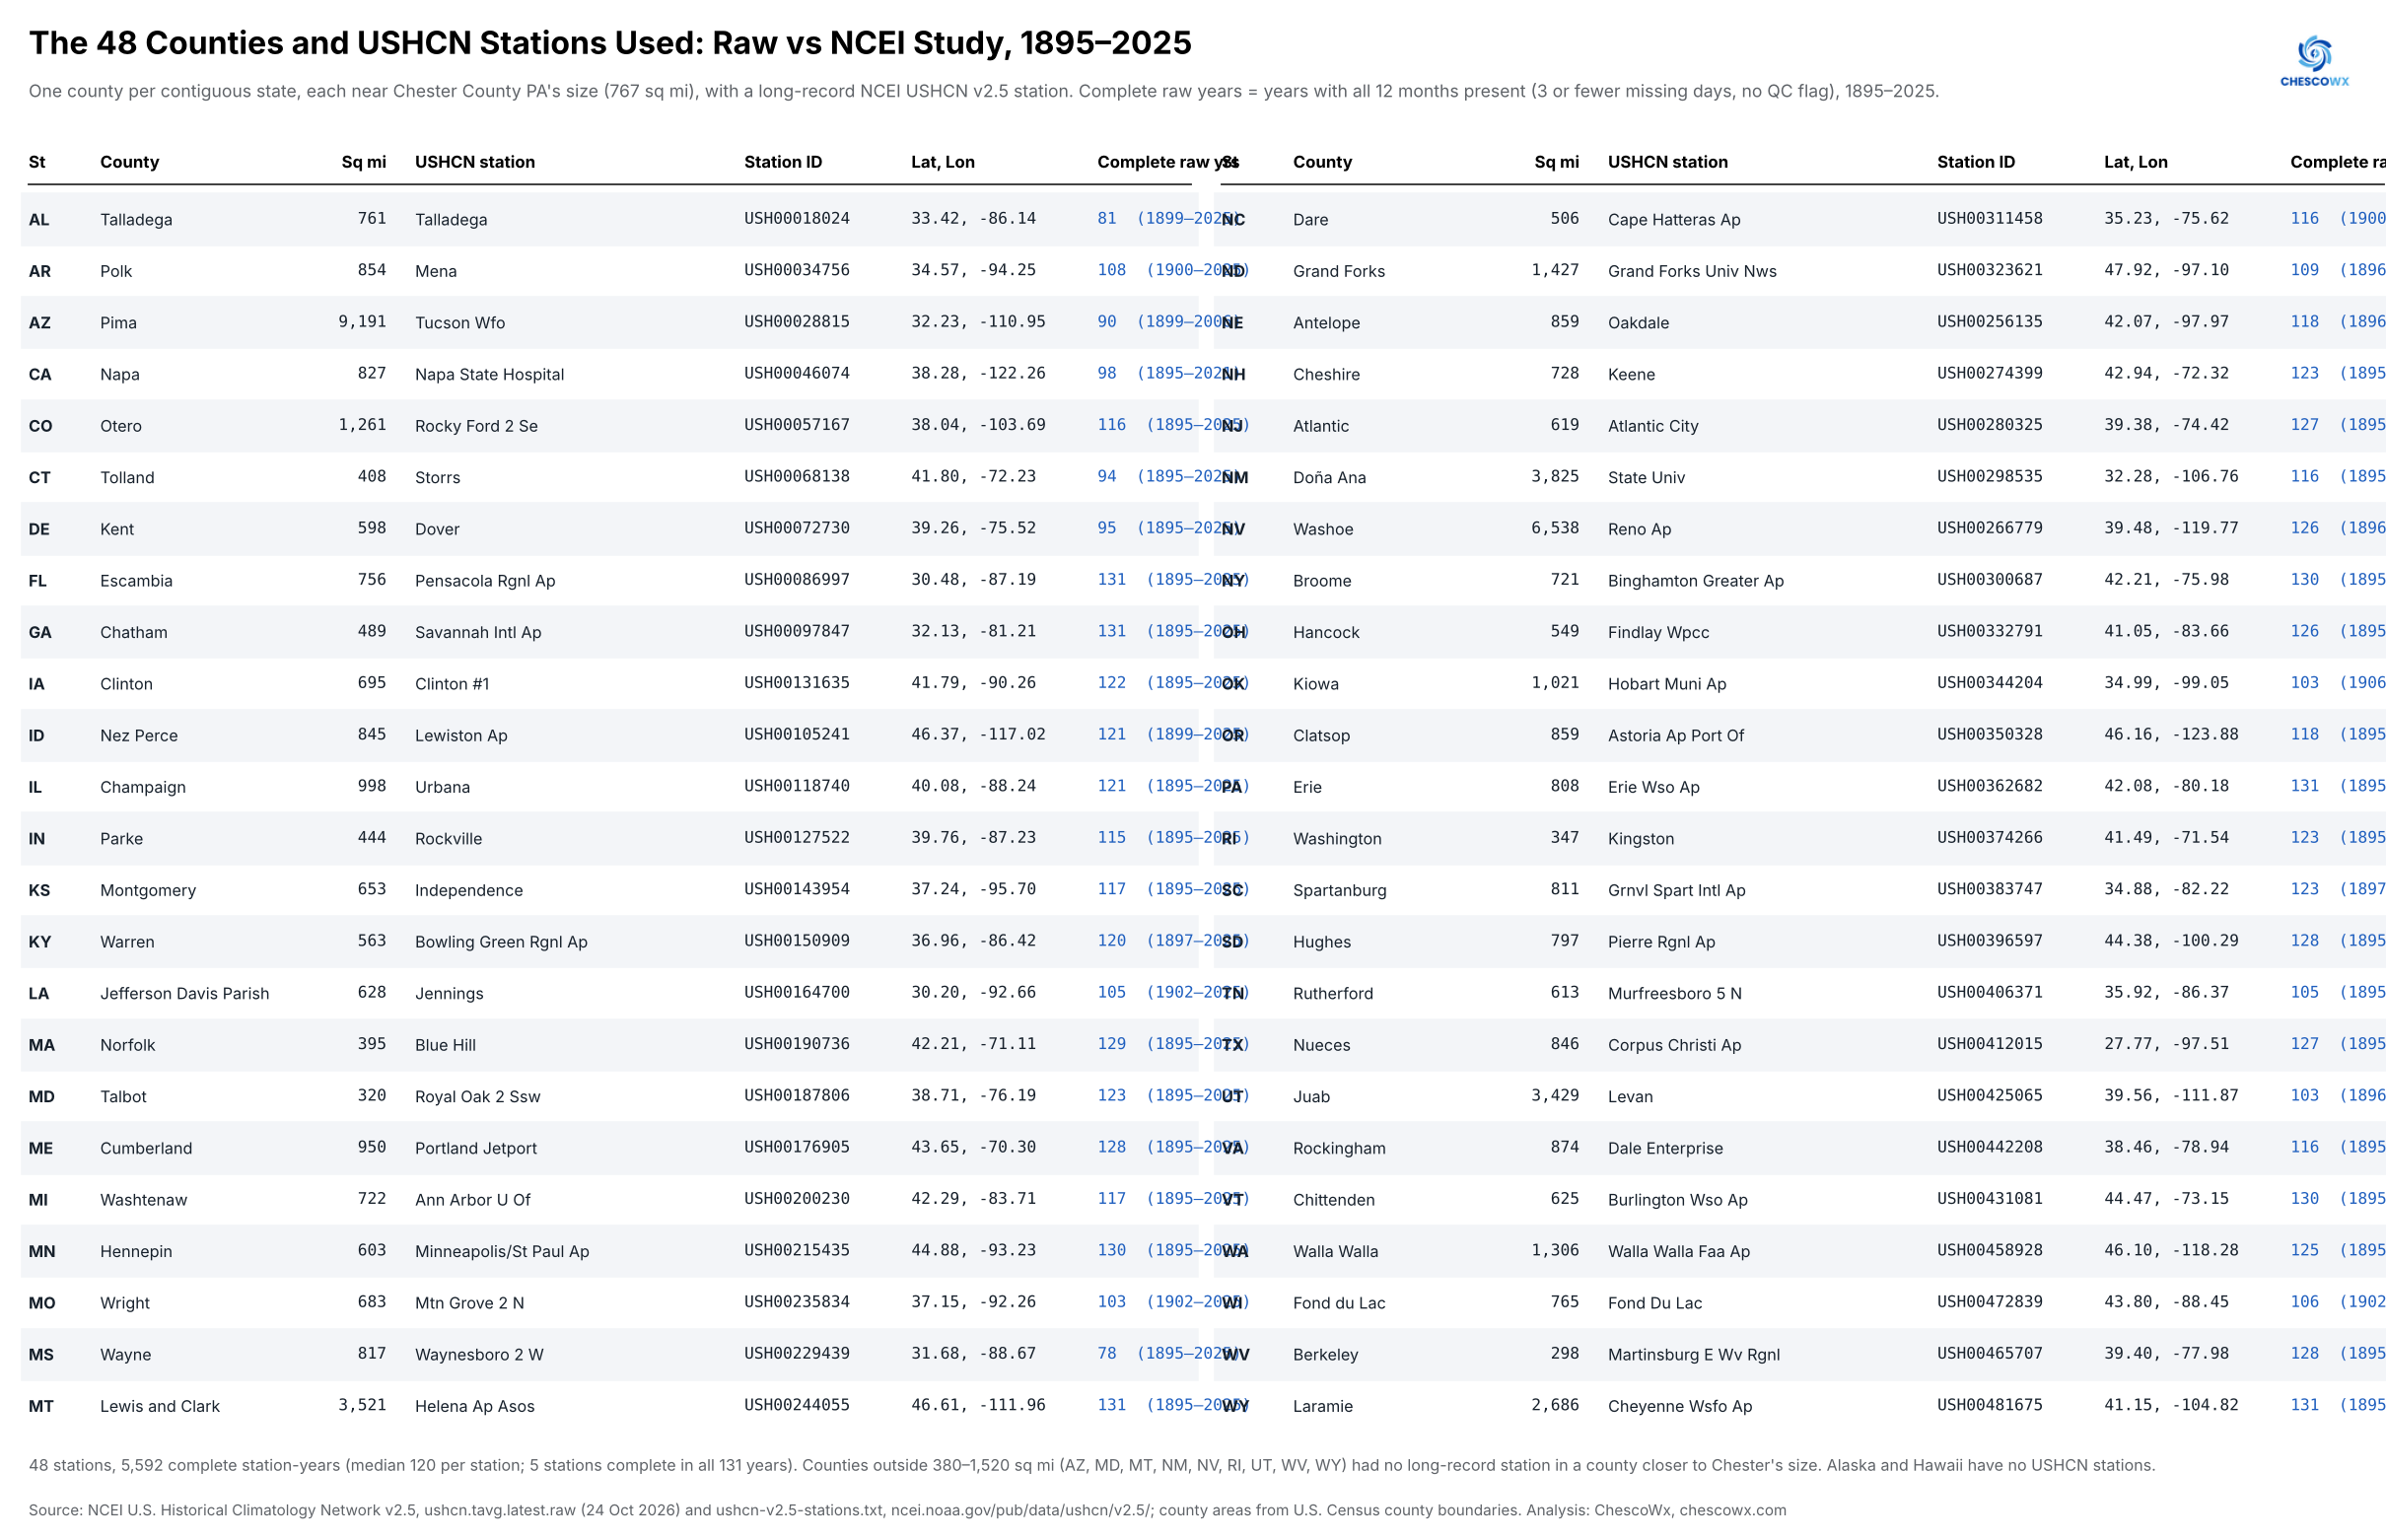
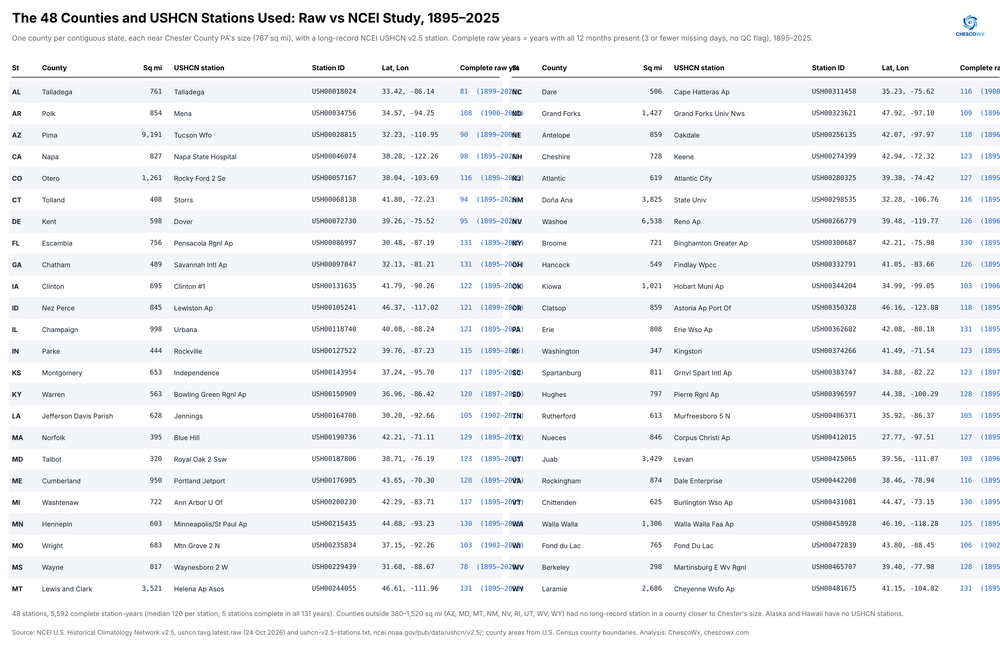
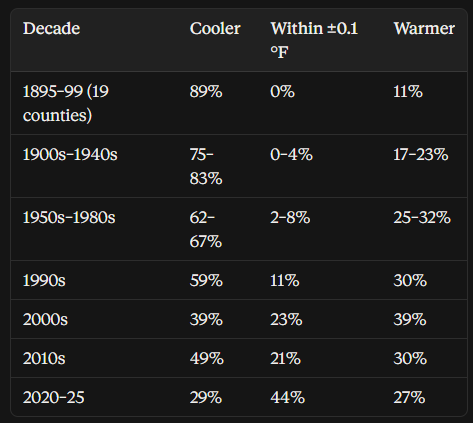
Thanks to all of you for the many suggestions to broaden the studies performed by the team at ChescoWx beyond a single county as we have done for Chester County PA! Based on this feedback we are excited to announce and start a US Nationwide complete state by state series to illustrate how the actual historical climate records with a focus on how much the annual average temperatures have been systematically adjusted by NCEI with the launch of the USHCN project back the later 1980's and 1990's. To be transparent at least for Chester County PA which was the original focus of the study the gap between the raw county record and NCEI’s Chester County series, we could only find support for about 1/3 of the Chester County NCEI post hoc adjustments based on documents we found, roughly another quarter could be the observation-time correction (not settled), and about 40% has no independent check. The actual Chester County climate data showed a slight but clearly not statistical warming trend from 1895 through 2025. While the revised NCEI data showed a clear statistically significant warming trend. If any of you are able to provide detailed support for any of the statistical and methodological data estimates which are what the homogenized NCEI adjustments represent... please provide this detail for these estimates by state if you can - thanks! We are undertaking this study following a just completed detailed review of 48 randomly selected based on similar size counties to Chester County PA. We selected 1 County in each of the 48 continguous US States. The findings in those 48 US Counties were consistent with what we saw here in Chester County PA. We found a clear consistent pattern across all 48 stations across the United States of clear cooling of the past records and general warming adjustments to more recent decades. Below are the consolidated findings and the detail of each of those selected 48 US Counties across the entire United States. Based on that finding (see below) of the share of counties where NCEI's adjusted value is cooler than the raw readings by decade....we will start a state by state review to see how many states show significant warming or not based on both the actual and adjusted NCEI data. First up will be my home state of Pennsylvania! I hope you all enjoy this upcoming study series!! All of these studies will also be presented and will be available for download at www.chescowx.com
-
This is how you establish cross polar flow and turn Canada into an ice box. A crucial first step for legit snow chances in these parts.
-
First flakes of season late Feb/ early Morch ?
-
Inject that into my veins
-
December 6th
- Today
-
Or if we’re lucky, another Dec 5th snowstorm
-
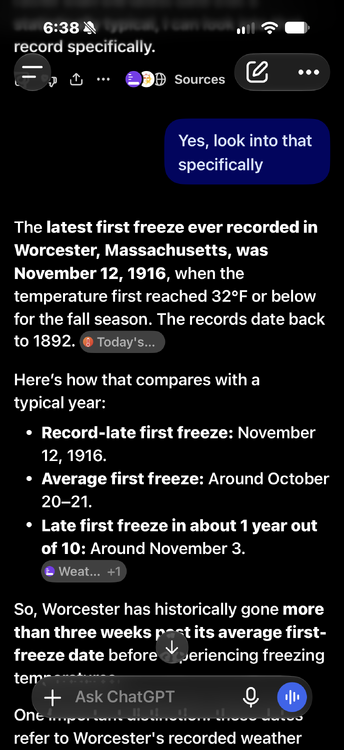
This is very likely to be smashed this year .
-
It is a pleasure to see you again.I hope all is well with you
-

2026-2027 Record-breaking El Nino
MJO812 replied to Stormchaserchuck1's topic in Weather Forecasting and Discussion
Thats what some people think on here but welcome to the forum. -
71 today
-

2026-2027 Record-breaking El Nino
ensonerd1233e343 replied to Stormchaserchuck1's topic in Weather Forecasting and Discussion
because + 12f is not happening the pv will eat into some of the warmth imo making a 12 f month very unlikely also other super ninos such as 72/82 did have warm decembers but they were not 2015 level 2015 is in fact an outlier