All Activity
- Past hour
-
Great area, just not for snow
-
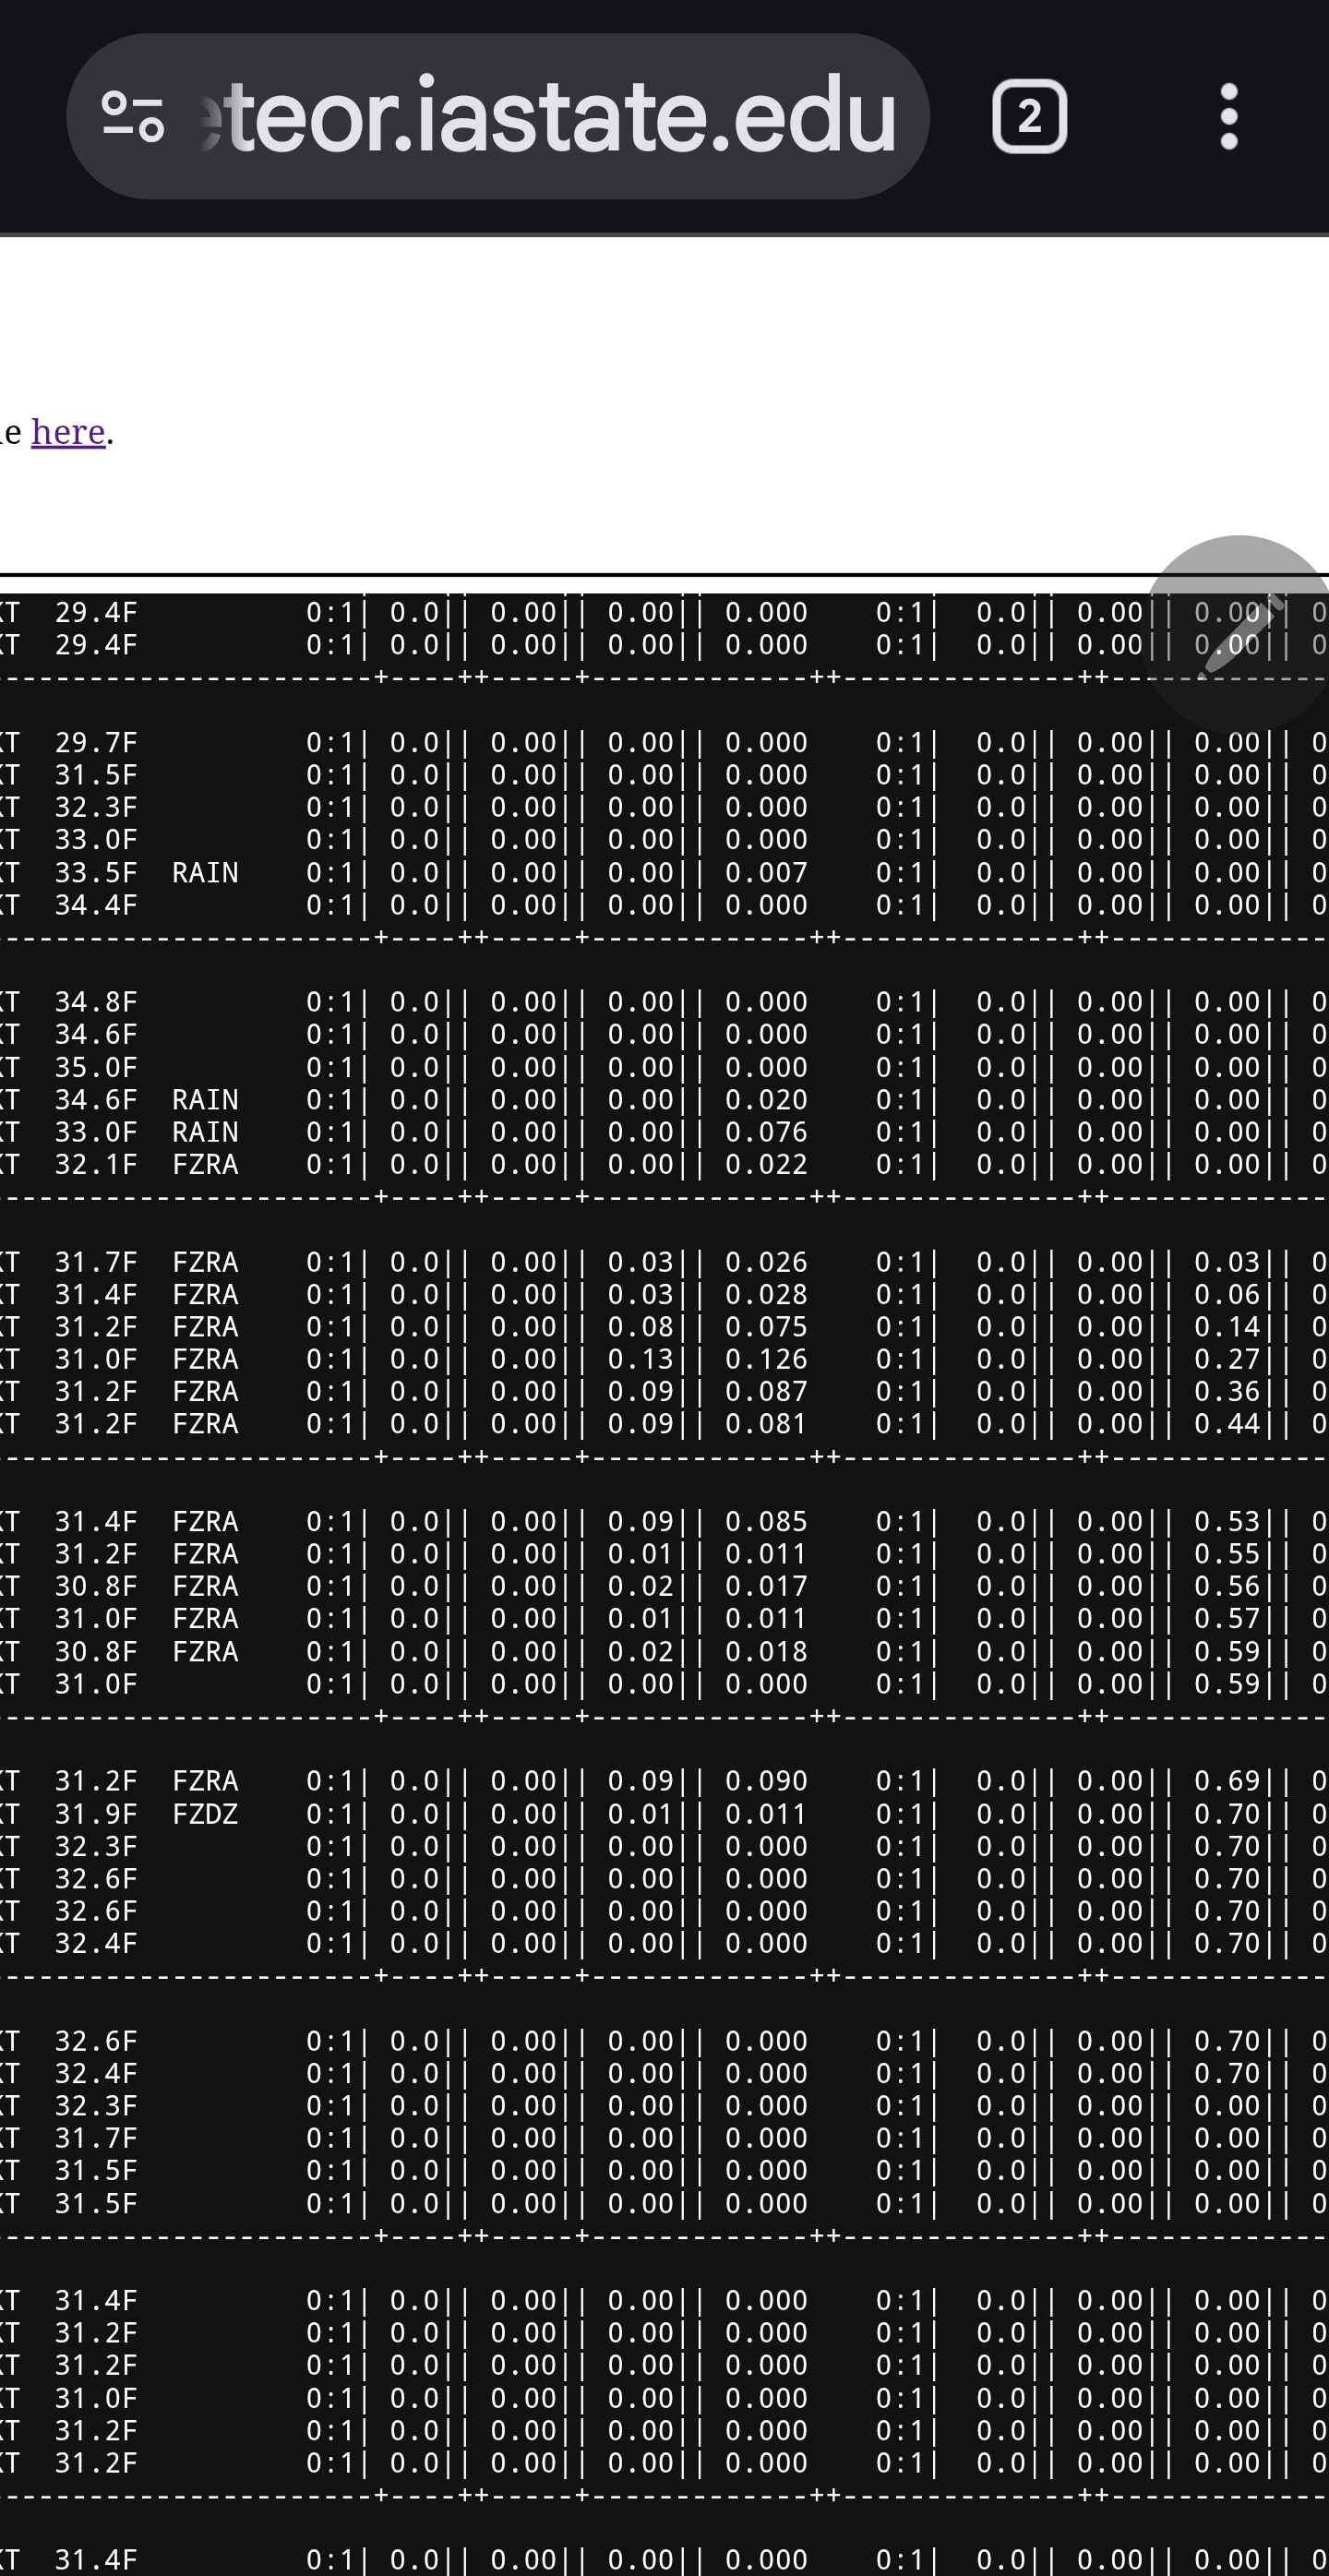
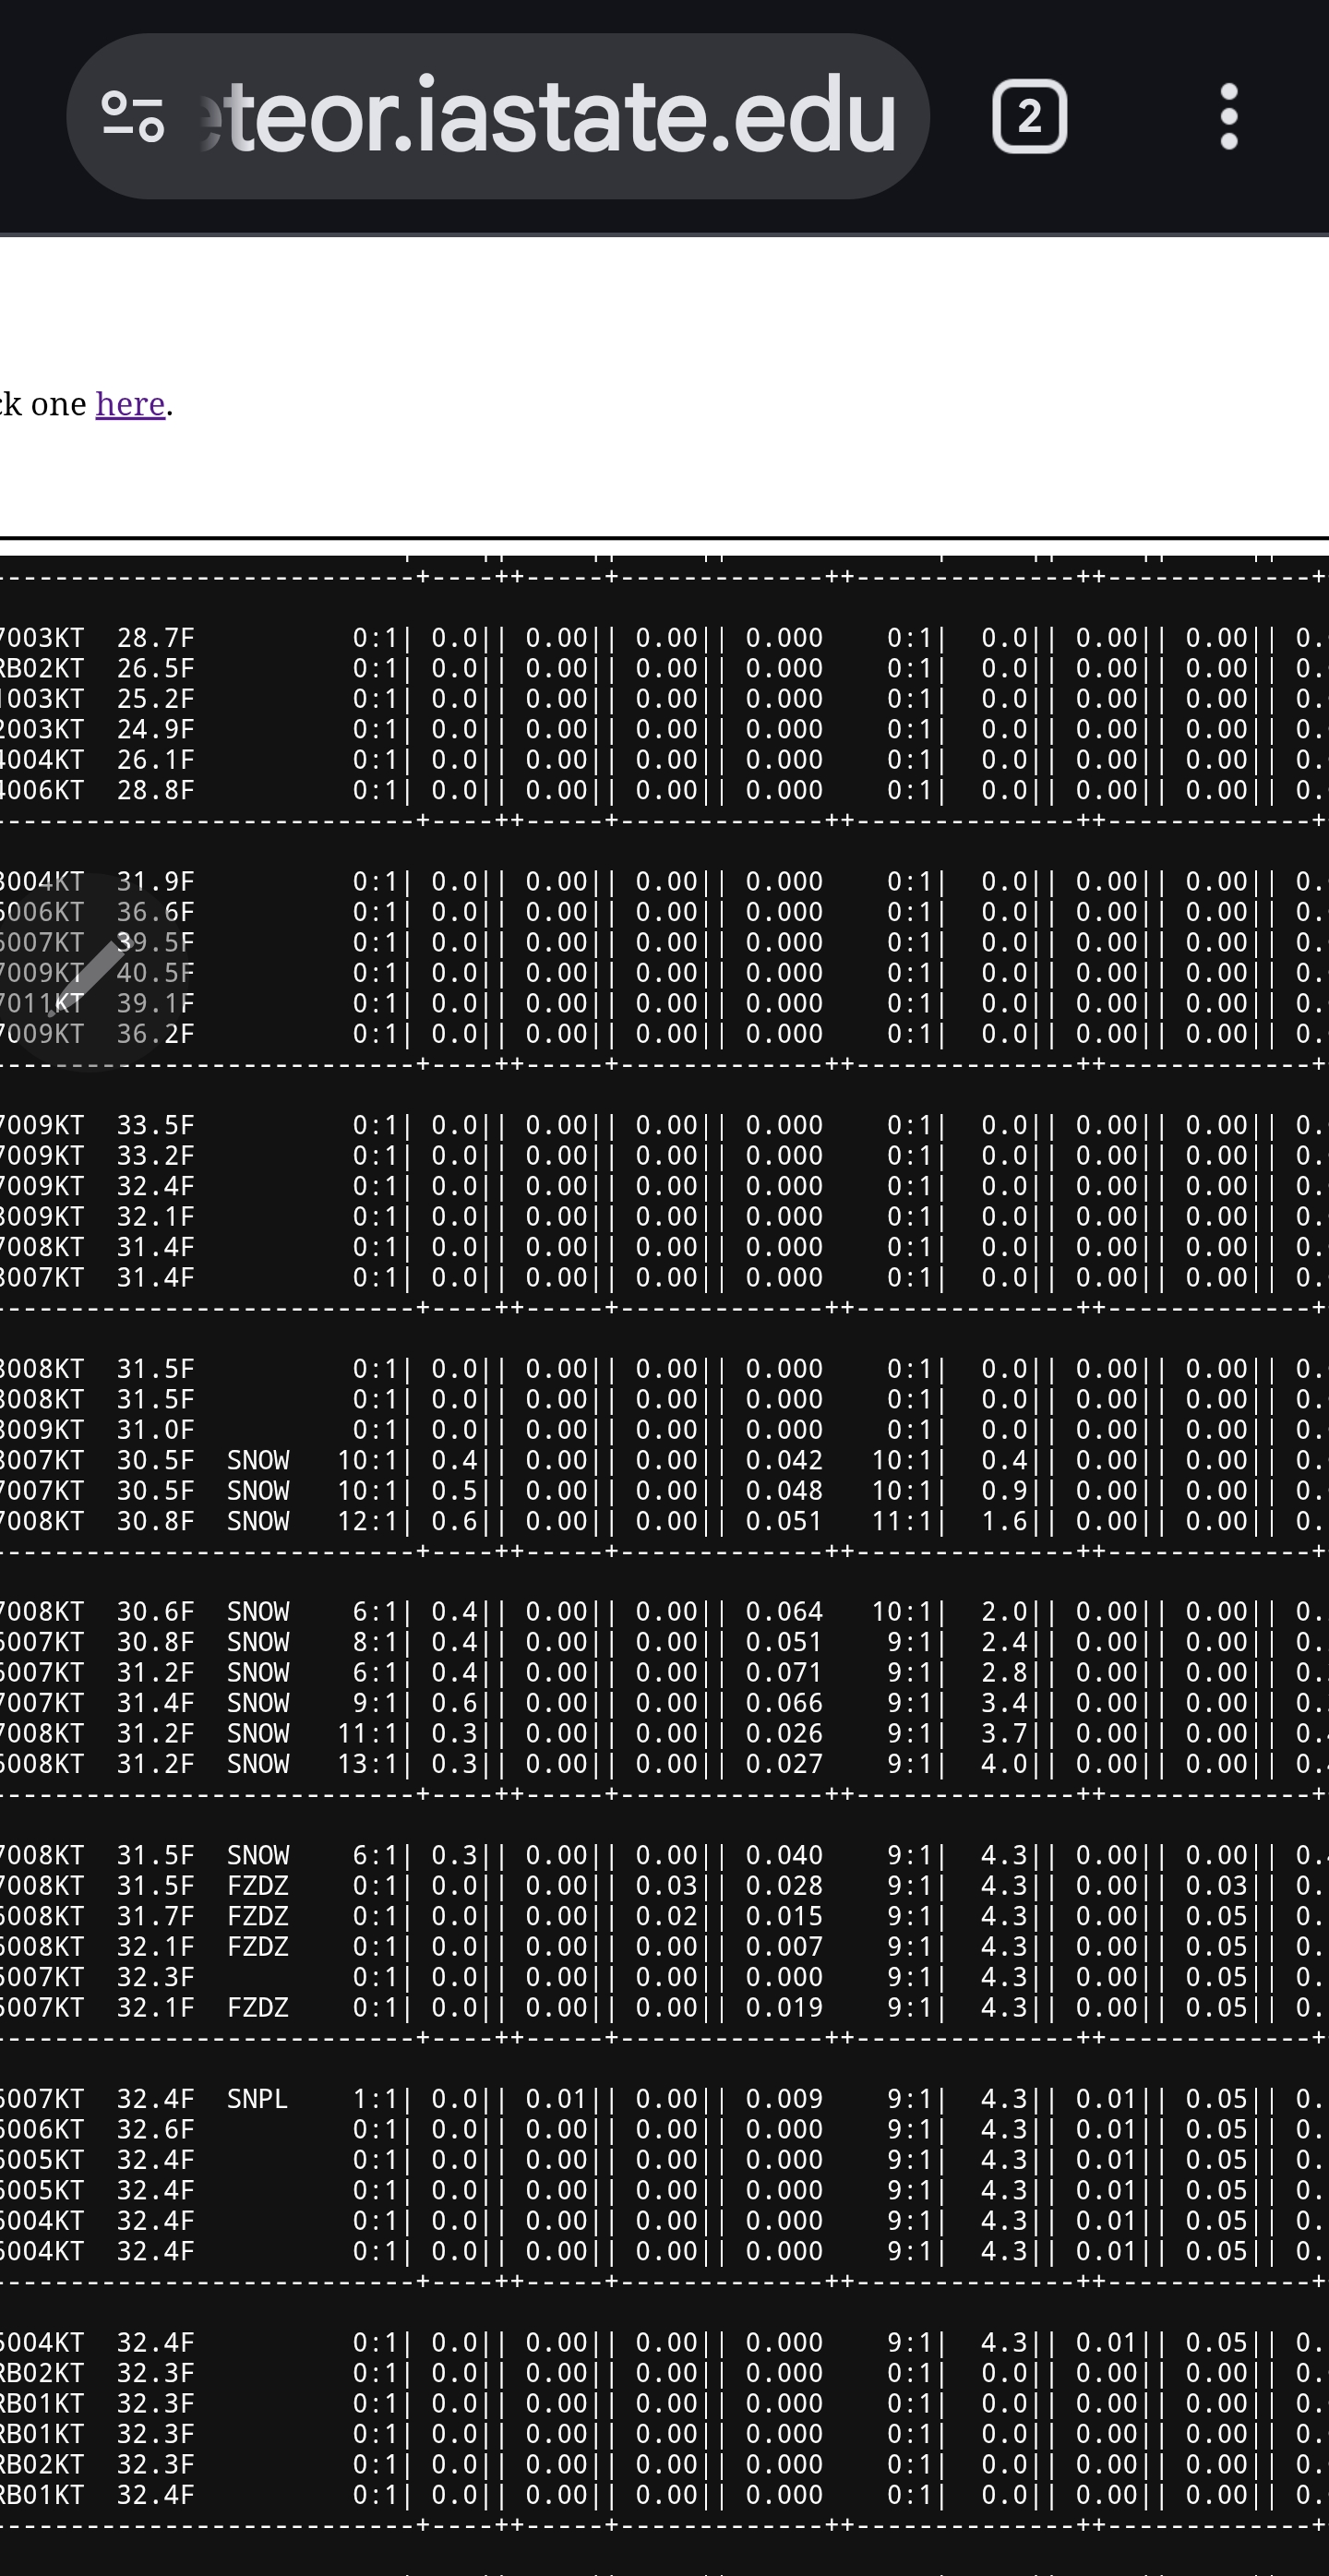
GFS is .67 freezing at BDL NAM is rain
-
Not quite a redux coming up next but some similarities. That looks like like a narrower snow production, possibly from Rt 2 N. Those areas in N CT up through the SW 'burbs of Boston probably don't fare so snow well. But they'll be cool and cooling off, so IP fest? Not a ton of either tho. The whole thing is moving really fast. There does appear to be a tiny 2 hour period of tuck potential.. It's interesting because as that shallow near surface slosh back is happening the total troposphere thicknesses are rising. Our regional topography can sometimes force the atmosphere to decouple, where the lower 150 mb may as well be a different planet
-

Central PA Spring 2026 Discussion/Obs Thread
Voyager replied to Voyager's topic in Upstate New York/Pennsylvania
March, and especially April, can be cruel months for warmanista's like me. -
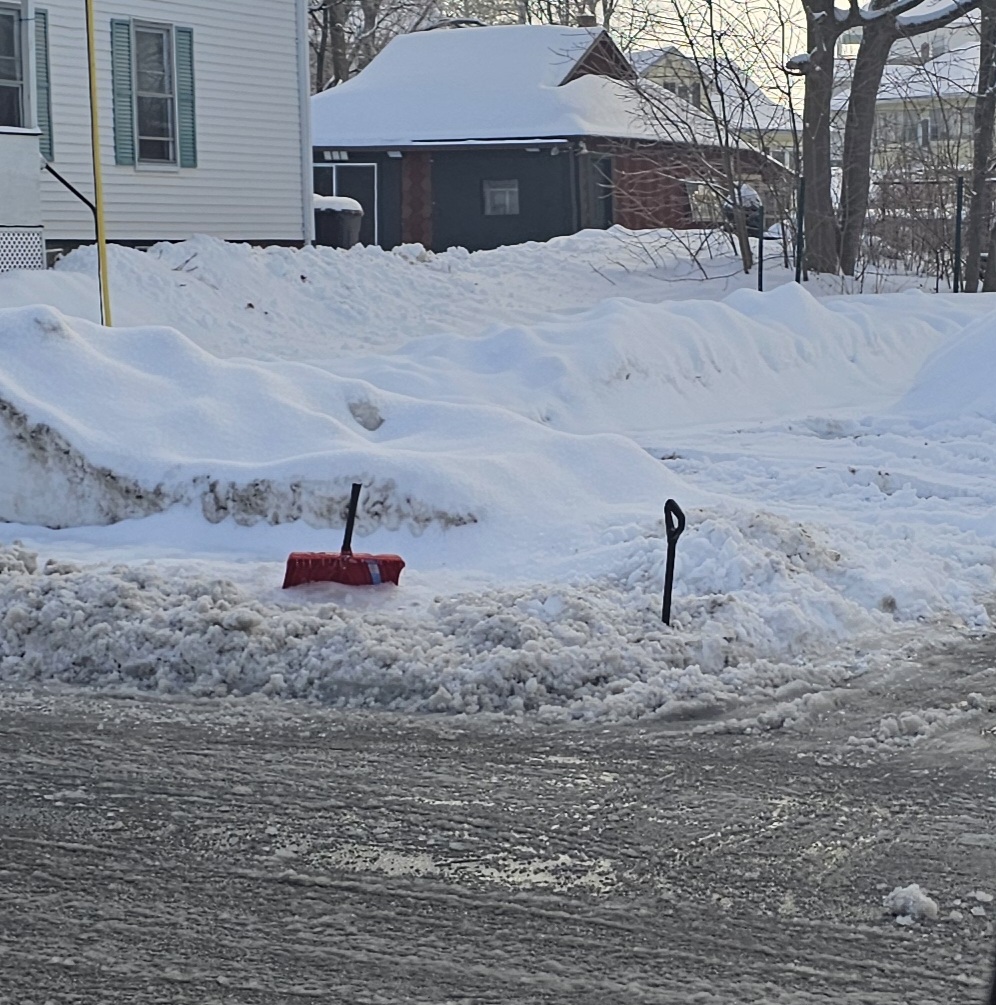
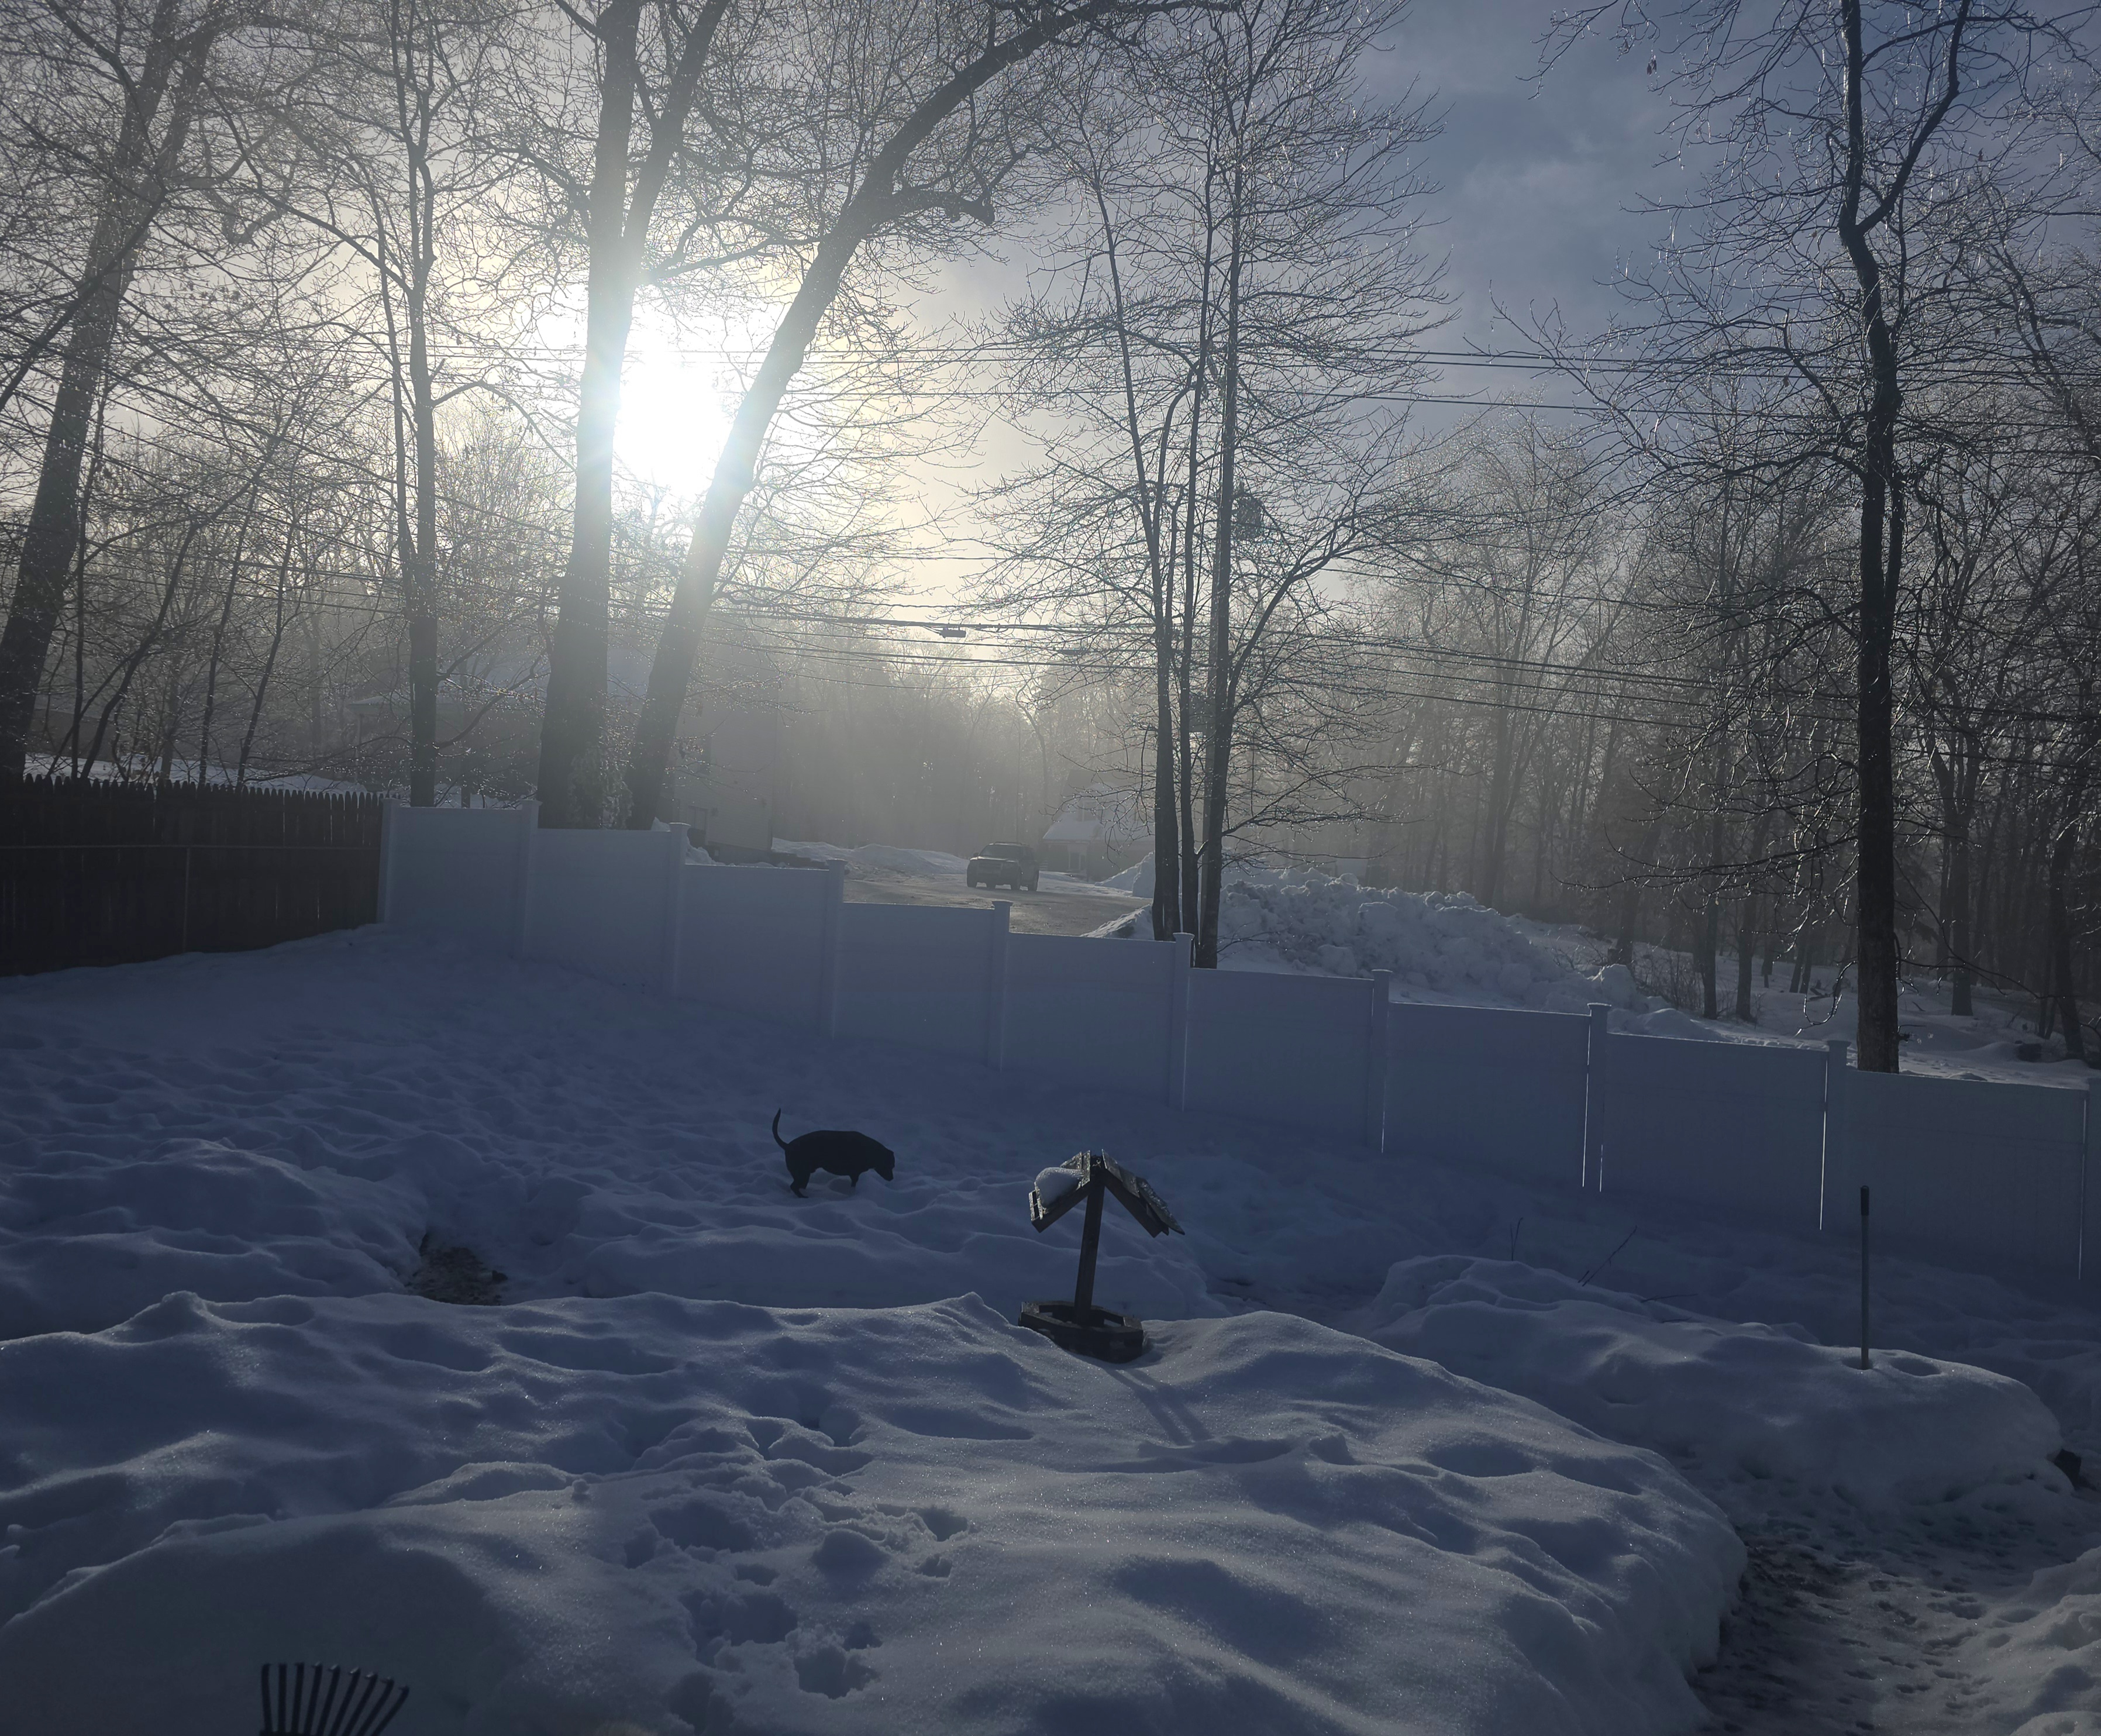
My drive in down Rt2 E was nice. Barely any traffic. Very scenic. snapped this pic in my hood.

-
Might be just a tad too far south for tomorrow night…how did the mid month look? Got a day off yesterday and a nice delay today due to the ice. Didn’t think that at all on Monday…this little system juiced up and stayed colder than forecast here..the tenor Carries on. Now let’s do 85 a week from now…that would be fun.
-
Lwm

-
Just looking forward to more zr . Won’t be any snow or sleet in CT
-
Celebrate Damage with Damage on the 40th anniversary of the release (3/3/86) of one of the greatest metal albums of all time.
-
Your pack will be epic

-
March is the worst
-
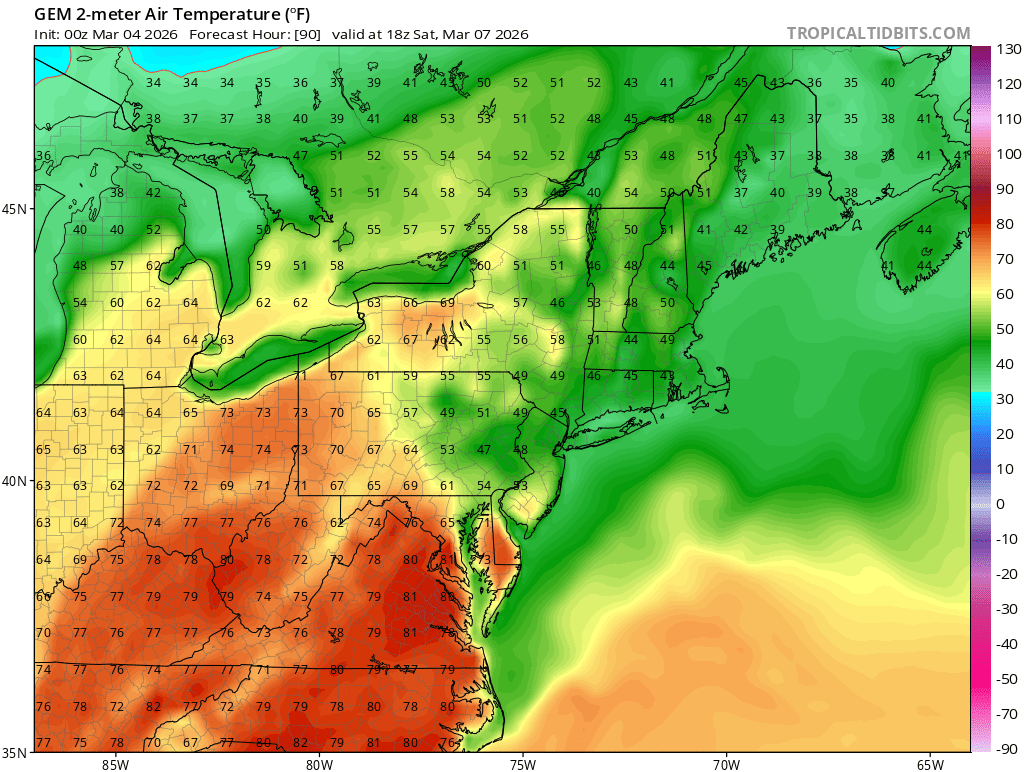
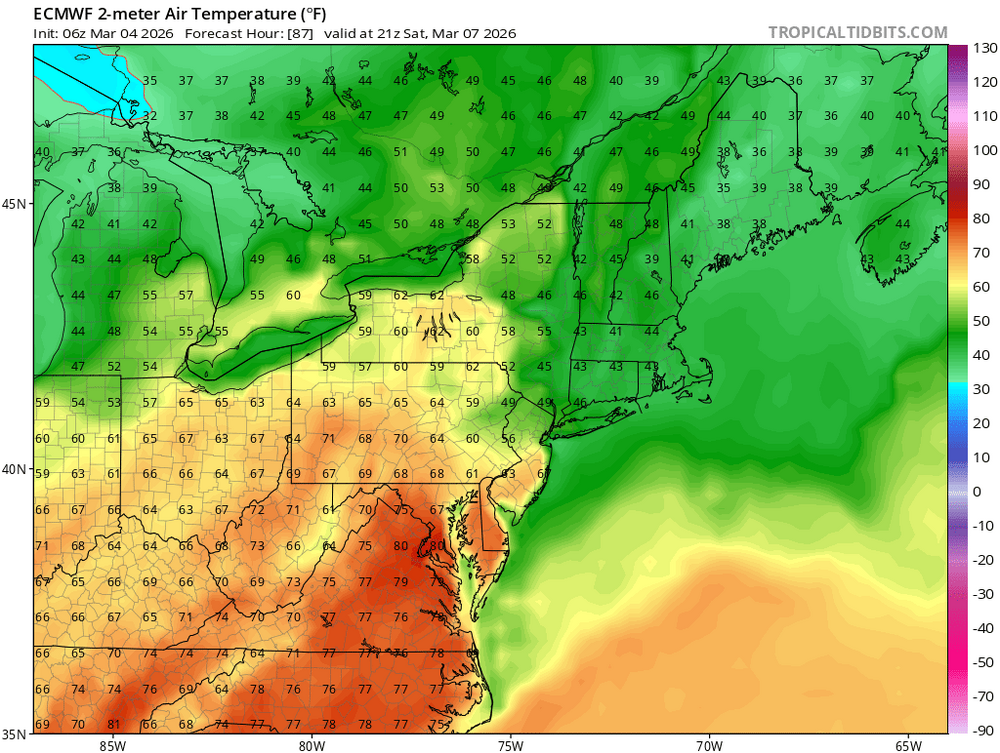
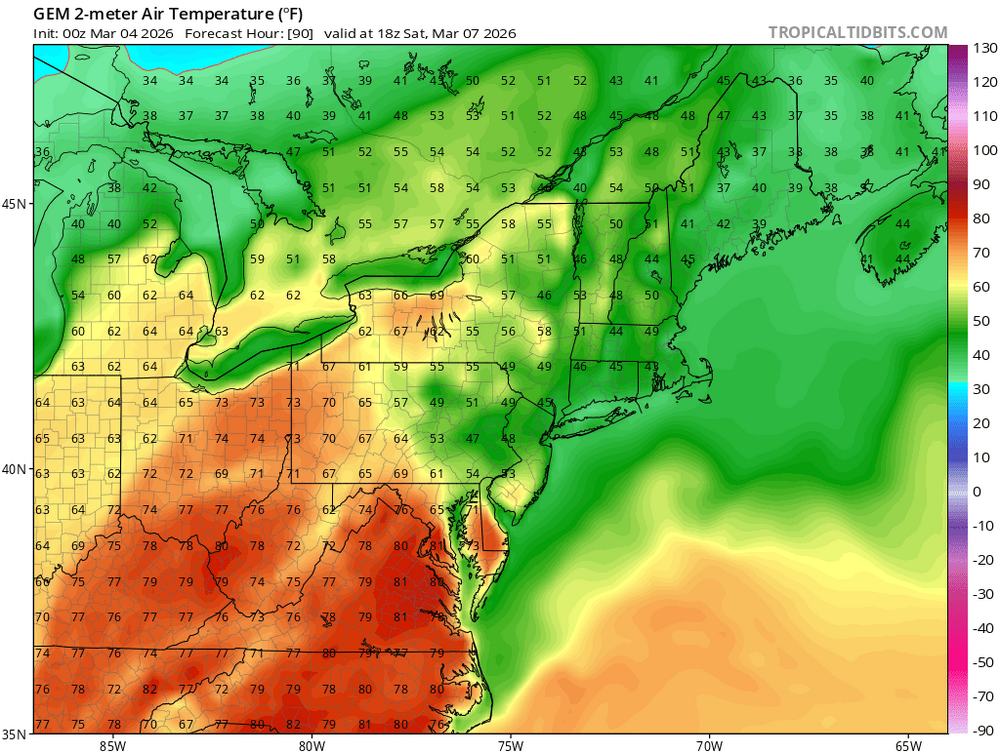
? GFS has DC at 73 at 1pm Saturday Euro and GEM even warmer.
-
@The 4 Seasons .5" (62.75" season) snow yesterday before the change over to freezing rain. Not a bad little event. Drive home from work yesterday, and drive in early this morning were not wonderful. Would be nice to find away to get me about 7" more to make 70" for the season. Not sure if that can happen, but I will work hard to make it so.
-
(002).thumb.png.6e3d9d46bca5fe41aab7a74871dd8af8.png)
E PA/NJ/DE Winter 2025-26 Obs/Discussion
ChescoWx replied to LVblizzard's topic in Philadelphia Region
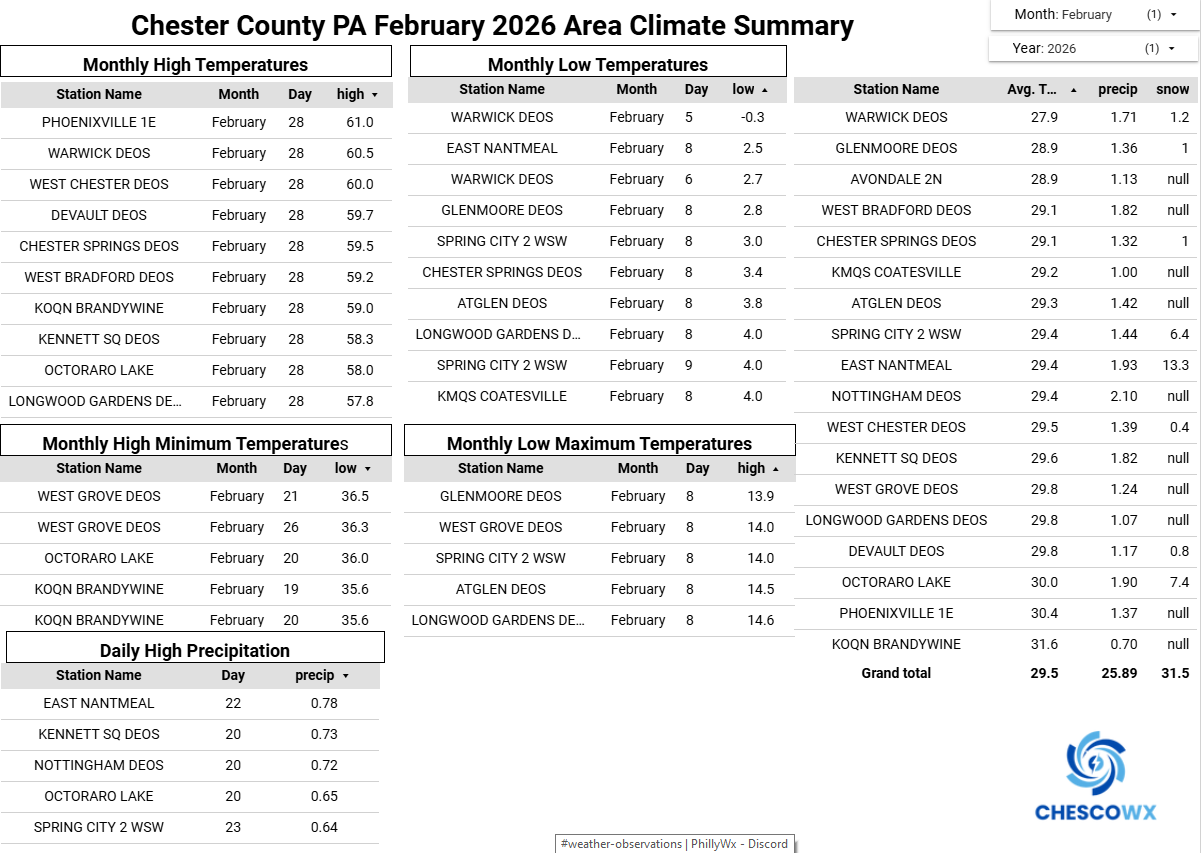
Below is the February Climate Summary for The Chester County Area. February 2026 was our coldest February since 2015 and these first 2 months of the year represents our 25th coldest start to any year since records began back in 1893.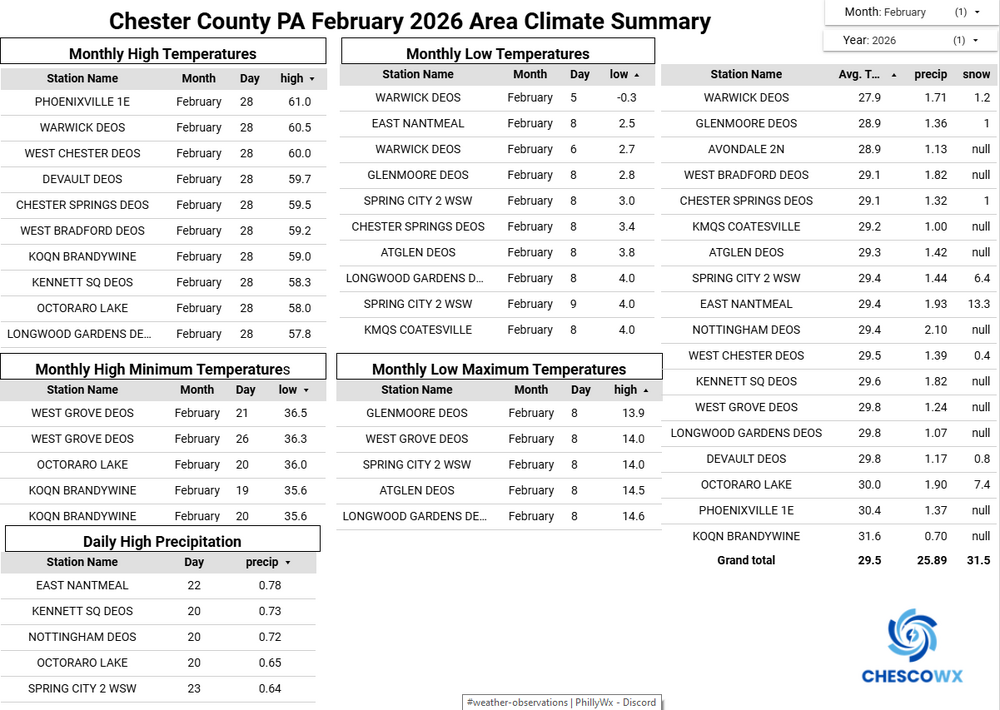
-
Central PA Winter 25/26 Discussion and Obs
ChescoWx replied to MAG5035's topic in Upstate New York/Pennsylvania
Below is the February Climate Summary for The Chester County Area. February 2026 was our coldest February since 2015 and these first 2 months of the year represents our 25th coldest start to any year since records began back in 1893.
-
Angry Ray is the best Ray.
-
2.5"
-
Doggie looks poised to lock in the next round of lips n hips
-
Man I am gonna miss this 1' plus since January

-
Sure and if my aunt had balls she'd be my uncle
-
Intriguing since wouldn't Kuchera be best in mixed? Gonna check Cobb Bufkit
-
I'm wondering a couple of things. one, will all this snow really be down to just piles in time. That's only 6 days away and the specifics of the CMC/GFS/Euro ops offer enough clouds and mean frontal position headaches to perhaps level the melt potential some. I mean, I've seen it approach 70 over a snow pack, sure. But that's with howling S gales and tons of steam rollin off the fields in firehose melt off that will be bare ground in a coffee break. I'm not sure it is environmentally possible to put 80 F over a geographic pan dimensional cryosphere and keep it sunny, when heights are really only marginal for mid 80s. There's kind of a 'absurdity limit' lol. two, if so ... does this approach on te 10th/11th period possibly expose a flaw in these AI versions? ie., not defining or integrating that aspect of the environmental precondition. For that matter, are we abundantly confidence the standard versions are doing that proficiently enough. I suspect the answer's no on the AI's, anyway. They still illustrate like 1993 MRF runs with that larger fuzzy granularity. That doesn't look like discrete systemic awareness really. Thing is... even the operational runs are bursting warm sector surge through all across those two days. The CMC with it's own 570+ dm plume now. Probably just go with whatever model's most conservative with temperatures until the ground snow is much much less.
-

2026-2027 El Nino
bluewave replied to Stormchaserchuck1's topic in Weather Forecasting and Discussion
If we do see another stronger El Niño so soon after 2023-2024, then it may be another piece of the puzzle indicating that the PCC has shifted positive leading to the big spike in global temperatures since 2023. We probably need to get past the spring forecast barrier in order to know the details of how strong this one gets. It’s possible that the faster rate of warming since 2023 is related to a shift in the newly discovered PCC near Nino 1.2. Notice the current Nino 1.2 temperatures have warmed in recent weeks. The last El Niño in 2023-2024 also experienced earlier warming than past events as the Nino 1+2 warming was early also. https://www.nature.com/articles/s41467-024-52731-6?utm_campaign=related_content&utm_source=HEALTH&utm_medium=communities Much recent work focused on whether equatorial Pacific cooling over past decades is driven by anthropogenic effects or arises from internally-generated climate variability, like the IPO. A definitive anthropogenic link to the recent trends would allow us to reliably predict a cooler tropical Pacific. As the tropical Pacific is known to be a climatic pacemaker, for (at least) the near-future this would mitigate global warming via ocean heat uptake and low-level cloud feedbacks. Instead, if the cyclic IPO dominates the recent cooling, we may expect a strong warming when it reverses. In support of the first possibility, we have identified an emerging climate change signal in the tropical Pacific across different observational datasets and we call it the PCC. The PCC has distinctive ocean-atmosphere dynamics that differ from those associated with the IPO. We further demonstrate that the recent trends during the satellite era, which have been the focus of significant attention, result from a combination of IPO and PCC. The emerging PCC SST trend pattern features a narrow band of cooling in the eastern equatorial Pacific and warming elsewhere. Throughout this paper we have taken for granted the widespread assumption that the IPO is an internal mode of the climate system. However, while we worked to distinguish between the recurrent IPO-related decadal variability and the emerging PCC signal, we are open to the possibility that these two may have become coupled together by anthropogenic forcing. They have much in common: shoaling of the thermocline in the east, enhanced upwelling somewhere in the central-to-eastern equatorial Pacific and an enhanced zonal SST gradient across the equatorial Pacific. It seems reasonable to postulate that if the response to radiative forcing is the emerging PCC pattern seen here, then it could initiate coupled ocean-atmosphere feedbacks that favor a negative IPO state that also has an enhanced SST gradient24. This might explain why the most recent IPO swing has been extreme and robust (Fig. S1b). If so, this suggests that in nature forcing is projecting onto natural modes of variability, while it is not clear whether climate models can reproduce this behavior. A new perspective on how internal variability interacts with the climate change signal will be needed in future studies. -
I am just going to say it. This weather is depressing.
-
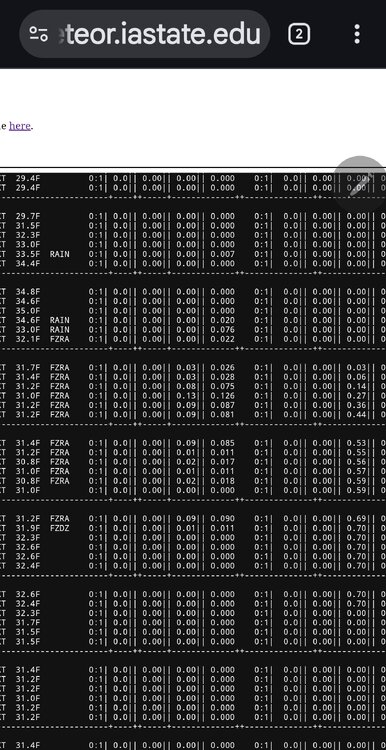
I tend to avoid using the Kuchie maps, especially in mixed bag events.